
Ground Penetrating Radar Market Size and Share
Market Overview
| Study Period | 2020 - 2031 |
|---|---|
| Market Size (2026) | USD 645.39 Billion |
| Market Size (2031) | USD 976.30 Billion |
| Growth Rate (2026 - 2031) | 8.63 % |
| Fastest Growing Market | Asia Pacific |
| Largest Market | North America |
| Market Concentration | Medium |
Major Players
*Disclaimer: Major Players sorted in no particular order Image © Mordor Intelligence. Reuse requires attribution under CC BY 4.0. |
|
Ground Penetrating Radar Market Analysis by Mordor Intelligence
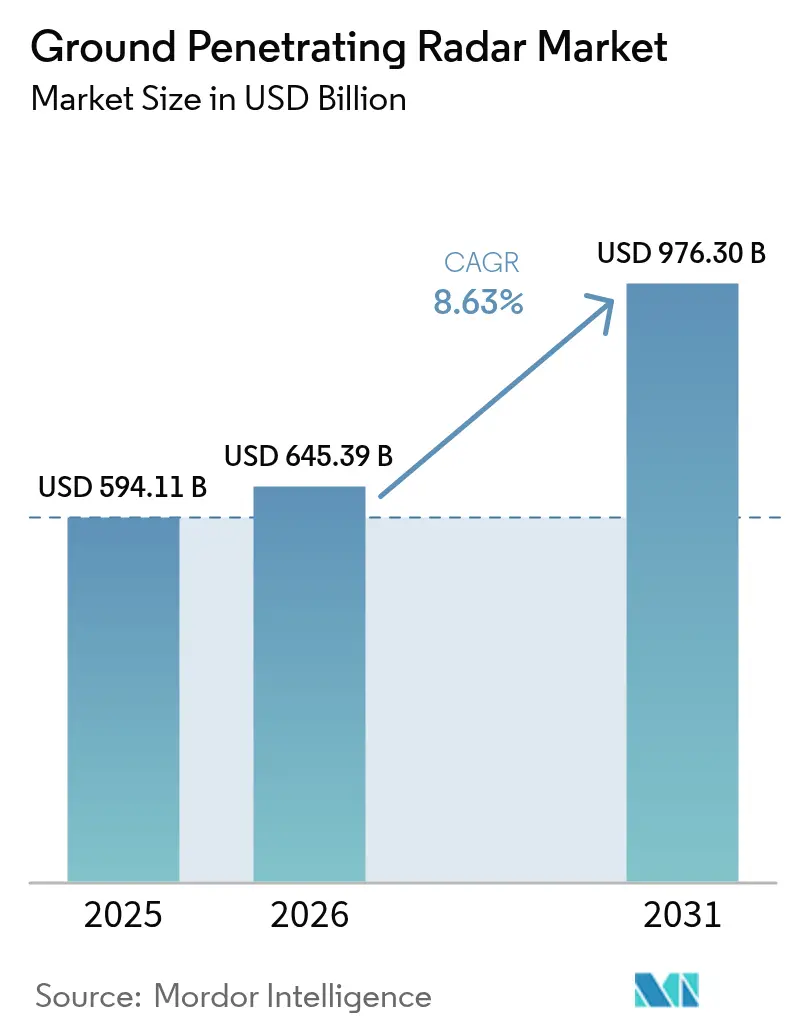
Ground penetrating radar market size in 2026 is estimated at USD 645.39 billion, growing from 2025 value of USD 594.11 billion with 2031 projections showing USD 976.3 billion, growing at 8.63% CAGR over 2026-2031. Rising demand for non-invasive subsurface mapping, mandated utility-locating standards, and rapid AI integration are turning radar data into predictive maintenance insights that lower downtime and repair costs. UAV-mounted solutions extend survey reach into hazardous terrain, while high-frequency antenna arrays open concrete imaging and forensic opportunities. Regulatory harmonization in North America and the EU shortens product-approval cycles, and expanding infrastructure investments across Asia accelerate adoption. Competitive intensity is increasing as software-centric entrants challenge established hardware leaders by linking real-time GPR streams to digital-twin platforms.
Key Report Takeaways
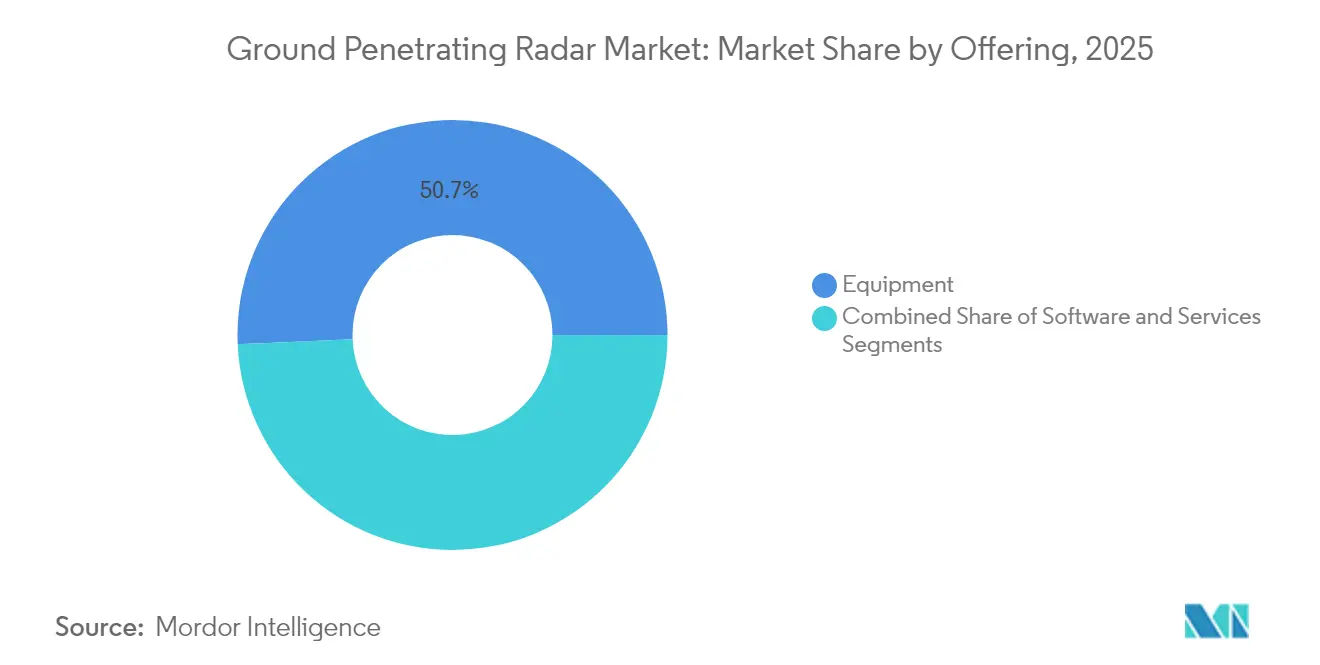
- By offering, equipment commanded 50.68% of the ground penetrating radar market share in 2025, while services are forecast to grow at a 9.05% CAGR to 2031.
- By product type, cart systems led with 41.35% revenue share in 2025; UAV-mounted units are projected to expand at an 10.9% CAGR through 2031.
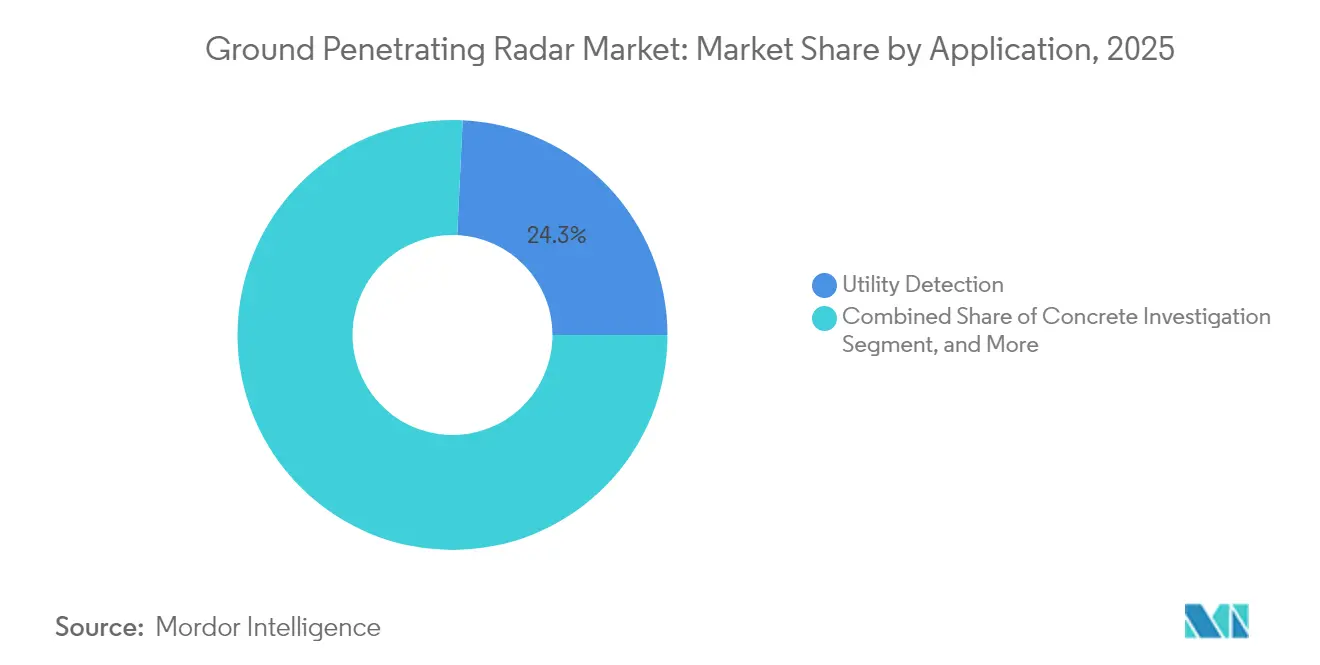
- By application, utility detection accounted for 24.25% of the ground penetrating radar market size in 2025; military and law-enforcement uses are advancing at a 9.95% CAGR to 2031.
- By end-user industry, construction and infrastructure remained the largest consumer segment in 2025, while defense is the fastest-growing vertical through the forecast horizon.
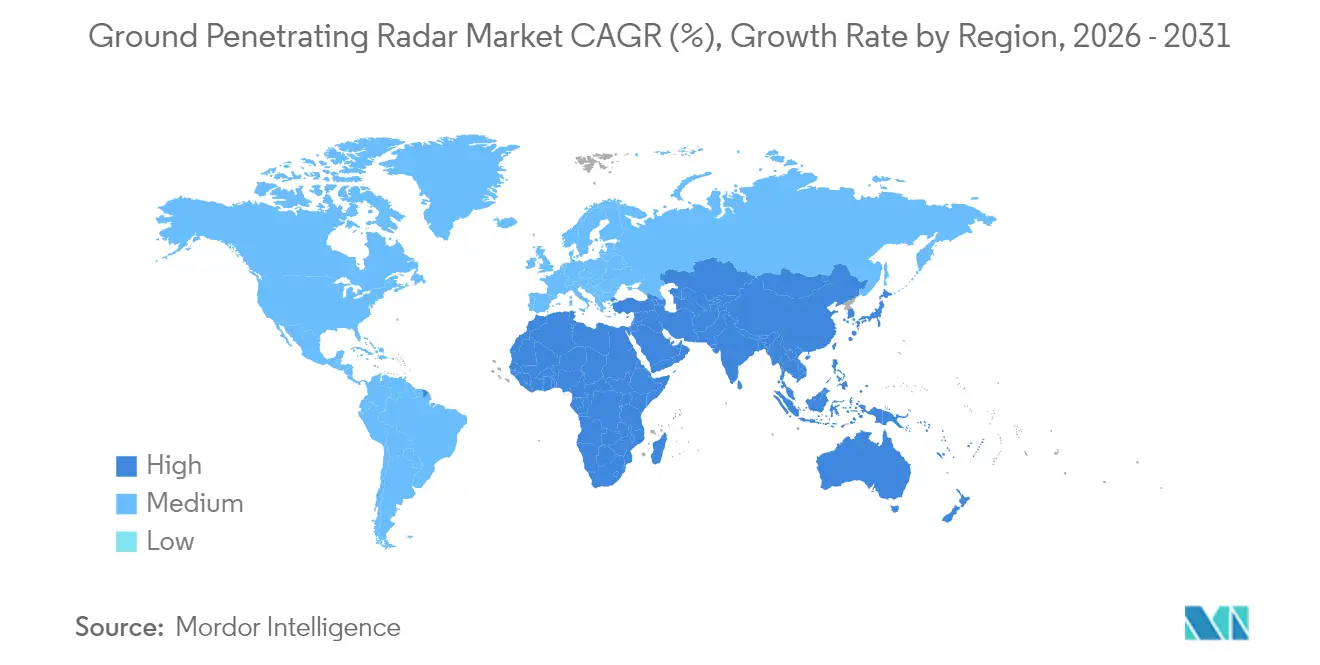
- North America dominated geographically with a 33.45% share in 2025; Asia-Pacific exhibits the quickest regional CAGR at 8.7% to 2031.
Note: Market size and forecast figures in this report are generated using Mordor Intelligence’s proprietary estimation framework, updated with the latest available data and insights as of 2026.
Market Trends and Insights
Drivers Impact Analysis of Ground Penetrating Radar Market*
| Driver | (~) % Impact on CAGR Forecast | Geographic Relevance | Impact Timeline |
|---|---|---|---|
| Rapid expansion of urban underground transportation corridors | +1.80% | Asia-Pacific, spillover to Middle East | Medium term (2-4 years) |
| Mandated underground utility mapping standards | +1.20% | North America and Europe | Short term (≤ 2 years) |
| Rising adoption of high-frequency antenna arrays for concrete imaging | +0.90% | Global, developed markets | Medium term (2-4 years) |
| Integration of GPR with AI-enabled data analytics platforms | +1.50% | Global, led by North America and Europe | Long term (≥ 4 years) |
| Growing demand for non-invasive subsurface mapping in renewable energy projects | +0.70% | Global, wind and solar corridors | Long term (≥ 4 years) |
| Increasing deployment of UAV-mounted GPR in remote and hazardous terrains | +1.10% | Global, mining and defense | Medium term (2-4 years) |
| Source: Mordor Intelligence | |||
Rapid Expansion of Urban Underground Transportation Corridors in Asia
Asia’s metro build-out from Beijing to Jakarta is fueling sustained purchases of network-ready GPR carts that couple live radar feeds with BIM dashboards. Contractors use continuous scans to guide tunnel-boring machines and avoid high-density utility clusters, reducing strike risk and schedule overruns. ESA’s TruewaveGPR trials logged 50% faster surveys once GNSS and IMU telemetry were embedded. [1] Government stimulus for climate-resilient infrastructure further underpins multi-year equipment demand.
Mandated Underground Utility Mapping Standards in North America and Europe
The Common Ground Alliance best-practice code now obliges electromagnetic verification before every dig, driving steady fleet renewals among locators and civil contractors. EU ultra-wideband harmonization delivers uniform frequency windows that simplify cross-border equipment logistics and reduce certification costs. [2]
Rising Adoption of High-Frequency Antenna Arrays for Concrete Imaging
Millimeter-resolution antenna grids spot rebar corrosion and voids before spalling appears. Smartphone-paired handheld units that use hyperbolic-curve-fitting reach depth errors below 3 mm in lab tests. [3] Civil-asset owners increasingly embed periodic concrete scans into preventive-maintenance plans.
Integration of GPR with AI-Enabled Data Analytics Platforms
Machine-learning classifiers now parse raw traces to separate soil layers, utilities, and anomalies with accuracy above 88% in controlled settings. [4] Digital-twin links let facility managers overlay radar outputs on 3D asset models, enabling condition-based maintenance workflows.
Restraints Impact Analysis of Ground Penetrating Radar Market*
| Restraint | (~) % Impact on CAGR Forecast | Geographic Relevance | Impact Timeline |
|---|---|---|---|
| High capital cost of advanced GPR systems | -1.00% | Asia-Pacific, Latin America, Africa | Medium term (2-4 years) |
| Limited rental ecosystem for GPR equipment | -0.40% | Asia-Pacific, Latin America, Africa | Medium term (2-4 years) |
| Signal attenuation in high-conductivity soils | -0.80% | Global, clay-rich and saline zones | Long term (≥ 4 years) |
| Scarcity of skilled GPR data interpreters | -1.10% | Global, acute in emerging markets | Long term (≥ 4 years) |
| Source: Mordor Intelligence | |||
High Capital Cost and Limited Rental Ecosystem in Emerging Economies
Industrial-grade systems with AI processors retail well above USD 100,000, a hurdle for small contractors. Sparse rental fleets in Africa and parts of Latin America curb project-based adoption.
Signal Attenuation in High-Conductivity Soils Limiting Depth Accuracy
Moisture-rich clay raises dielectric losses and trims effective range; detection accuracy drops markedly once water content tops 25%. Stepped-frequency compensation helps but cannot override fundamental electromagnetic limits.
*Our forecasts treat driver/restraint impacts as directional, not additive. The impact forecasts reflect baseline growth, mix effects, and variable interactions.
Ground Penetrating Radar Market Segment Analysis
By Offering:
Equipment Dominance Drives Hardware InnovationThe equipment segment controlled 50.68% of the ground penetrating radar market in 2025, underscoring the capital-intensive role of transmit-receive hardware in survey workflows. Adopters upgrade to multichannel arrays that boost coverage speed without sacrificing depth resolution. Services, expanding at 9.05% CAGR, attract project owners seeking OPEX models and turnkey data interpretation. As AI modules migrate to edge processors inside control units, vendors bundle analytics subscriptions with hardware to build annuity revenue.
Services growth also reflects a widening skills gap; interpreting complex radar signatures now blends geophysics with data science. Fleet operators specializing in post-processing sell rapid-response scans to infrastructure owners that lack in-house expertise. Software-only providers exploit this shift, feeding classified traces into cloud-hosted neural networks that deliver automated layer picks and object tags within minutes.

By Product Type:
Cart Systems Lead While UAVs AccelerateCart platforms held 41.35% revenue in 2025 by combining full ground coupling with ergonomic handling, a formula ideal for utility-locating and pavement surveys. Analytic dashboards turn live traces into color-coded depth slices viewable on-site. UAV payloads, although smaller, are scaling fastest at 10.9% CAGR. Mining firms fly radar beneath rotary-wing drones to map tailings-dam seepage paths, while defense teams use fixed-wing variants for border-tunnel sweeps. Despite lighter antennas limiting penetration versus carts, demand rises where ground access is restricted or hazardous.
Hybrid concepts are emerging: detachable sleds that clip to a drone harness for transit then pivot to wheel-based scanning once on site. This modularity lengthens flight endurance and maintains depth capability, hinting at future convergence of airborne and terrestrial designs.
By Component:
Control Units Drive Integration ComplexityModern control units embed GNSS receivers, inertial sensors, and AI accelerators that filter clutter in real time. Vendors advertise centimeter-level positioning accuracy even under dense tree canopy by fusing IMU drift corrections. Antenna innovation centers on metamaterial lenses and phased arrays that sharpen beam focus, while lightweight lithium-ion packs extend UAV sortie times above 30 minutes. Inter-component talk now rides on industrial Ethernet, easing tie-in to site networks and cloud servers.
R&D spending skews to software-defined transmitters able to sweep from 100 MHz to 3 GHz on the fly, tailoring frequency stacks to geology. This adaptability cuts multiple-pass requirements and lowers survey costs per kilometer.
By Frequency Range:
Sub-500 MHz Dominates Deep Penetration ApplicationsSub-500 MHz rigs remain indispensable for geologic sounding and large-diameter pipeline corridors, where deep reach outweighs fine detail. The 500–1000 MHz band balances penetration and resolution for utility-locating, supporting most municipal work orders. Frequencies above 1000 MHz thrive in concrete imaging and forensic work, mapping rebar grids and voids with millimeter clarity. Dual-mode units can hop bands mid-survey, yielding a single stitched data cube that blends depth and resolution tiers.
Laboratory tests on stepped-frequency prototypes record signal-to-noise uplifts above 3 dB, signalling a future where frequency agility becomes standard on flagship models.
By Application:
Utility Detection Leads Amid Military AccelerationUtility detection preserved 24.25% share of the ground penetrating radar market size in 2025 as cities enforce dig-safety laws. Radar traces feed GIS layers that asset owners update in real time, shrinking unplanned strike costs. Military and law-enforcement demand, growing at a 9.95% CAGR, covers tunnel hunting, UXO mapping, and perimeter security. Concrete investigation and transportation asset audits round out steady recurring work.
Archaeologists and environmental scientists add niche volume by scanning heritage sites and mapping contaminant plumes. Case studies in the UAE showed radar outlining buried stone foundations with minimal site disturbance.
By End-User Industry:
Construction Dominance Amid Defense AccelerationConstruction firms anchor system sales, embedding radar scans into pre-bid risk assessments, pile-drive planning, and asset handover packages. Defense procurement picks up pace as agencies fund drone-borne arrays for border patrols and humanitarian de-mining, areas where traditional handheld metal detectors struggle. Renewable-energy EPCs form a rising cohort; wind-farm trenchers verify cable corridors with radar before trenchless boring.
Geography Analysis
North America Ground Penetrating Radar Market
North America led with 33.45% revenue in 2025 thanks to stringent Common Ground Alliance rules that mandate subsurface verification and to steady replacement cycles among fleet operators. State-backed infrastructure grants covering broadband, EV plants, and grid upgrades ensure a deep pipeline of scanning projects. Regional vendors couple radar with AI software to export turnkey offerings globally.
APAC Ground Penetrating Radar Market
Asia-Pacific posts the highest regional CAGR at 8.7%. Mega-metro rail lines in China, India, and Southeast Asia require 24/7 radar monitoring during excavation. Smart-city programs layer radar outputs into digital twins of underground utility corridors, steering maintenance crews proactively. Japan and South Korea champion drone-based arrays for landslide-prone mountain routes, driving early adoption of lightweight antenna tech.
Europe Ground Penetrating Radar Market
Europe retains healthy demand under harmonized UWB regulations that smooth certification workflows. Heritage-site managers in Italy and Greece deploy high-frequency rigs to audit cathedral foundations without drilling cores. Defense sensor contracts surged in 2025 as regional tensions prompted larger counter-measure budgets, benefitting suppliers of radar altimeters and electronic-warfare payloads.
LATAM and MEA Ground Penetrating Radar Market
Latin America, the Middle East, and Africa remain under-penetrated yet opportunity-rich. Brazil’s power-grid expansion and Saudi Arabia’s giga-projects, for example, include sizable allocations for underground-utility mapping. The constraint remains equipment affordability and interpreter availability, spurring interest in pay-per-scan service models.
Regulatory Landscape
Ground penetrating radar (GPR) use is shaped mainly by ultra-wideband (UWB) and short-range device spectrum rules that set emission limits, and in many jurisdictions, restrict operation to trained or professional users to reduce interference risk. In the United States, GPR operation falls under FCC requirements for UWB intentional radiators (47 CFR Part 15, including Section 15.509), which influences product design around compliance testing, labeling, and controlled-use conditions for applications such as construction, mining, and public safety.
In Europe, harmonized ETSI standards (notably EN 302 066 for spectrum use and EN 301 489-32 for EMC) provide a common technical baseline, while authorization practices and any usage conditions are still handled by national administrations across member states. Canada regulates GPR/level probing radar through Innovation, Science and Economic Development Canada (ISED) Radio Standards Specifications such as RSS-211, treating compliant equipment as certification-driven radio apparatus. This structure ties market access to formal approval workflows and tends to favor vendors with documented conformance across regions, with ITU-R study work supporting broader international framing for UWB and radar coexistence.
Value Chain Analysis
The value chain starts with RF and positioning component inputs (antennas, control units with embedded processing, GNSS/IMU modules, batteries, and rugged tablets) that OEMs integrate into handheld, cart-based, vehicle-mounted, and UAV-compatible platforms. System makers then differentiate through multichannel arrays, onboard signal processing, and interoperability with mapping stacks, with hardware and workflow tooling offered by firms such as IDS GeoRadar (Hexagon AB), ImpulseRadar, and US Radar Inc. Software specialists also contribute by converting radargrams into map-ready outputs.
On the downstream side, distributors and service partners sell into civil engineering, utilities, transportation infrastructure, and defense users, where an increasing share of project value is tied to surveying, post-processing, and interpretation services rather than equipment alone. Interpretation complexity and the need for accurate georeferencing support recurring demand for bundled workflows (hardware plus SaaS analytics, automated feature extraction, and asset-management integration). Soil-dependent attenuation and skills scarcity further increase the importance of standardized procedures and managed-service offerings for repeatable utility mapping and condition assessment.
Competitive Landscape
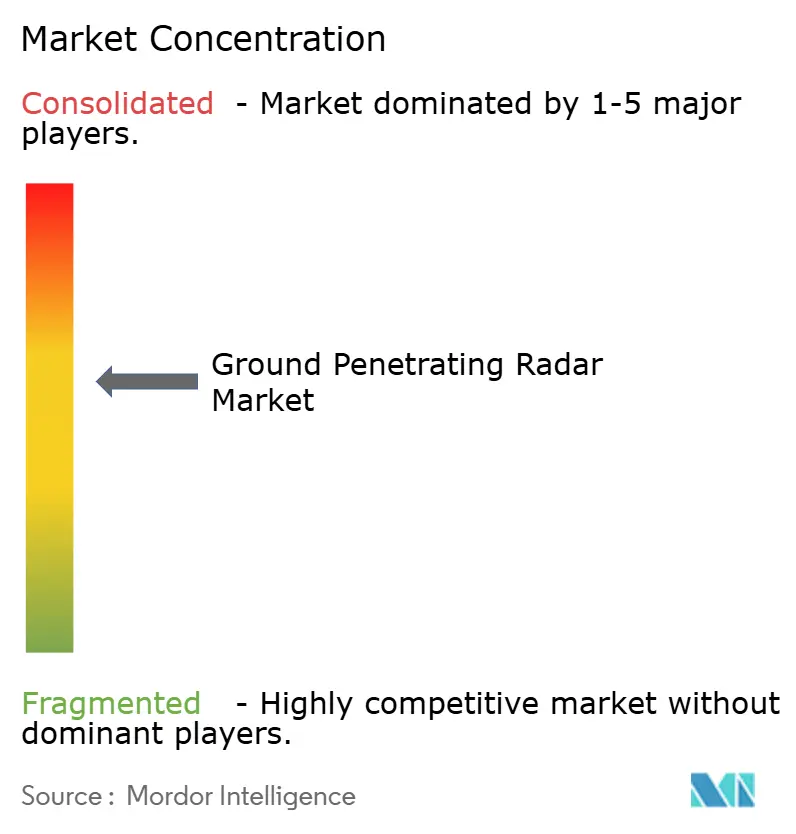
The ground penetrating radar market shows moderate fragmentation. Long-time innovators such as Geophysical Survey Systems Inc. leverage five decades of antenna IP and robust dealer networks to defend share. Trimble’s pivot toward software and recurring revenue yielded 62% subscription mix in a USD 3.2 billion sales base, underlining the profit pool shift toward analytics. Leica Geosystems integrated multi-array sensors with cloud dashboards to speed utility-map delivery.
Emerging challengers focus on AI-first workflows: distributed moving-transceiver prototypes from the University of Michigan enable 360-degree imaging without operator repositioning. Several startups bundle SaaS interpretation engines with low-cost antennas, lowering entry barriers for small contractors. Patent race intensity centers on phased arrays, metamaterial lenses, and neural-network-based clutter filters.
Strategic moves in 2024-2025 included OEM-service alliances, drone-payload partnerships, and defense-sector acquisitions. Chemring expanded production of miniature radar altimeters after booking GBP 26 million (USD 35.78 million) in new orders, targeting annual sales near GBP 800 million (USD 1100.89 million) by 2030. Overall, firms able to integrate hardware reliability with real-time analytics and cloud connectivity are positioned to capture the next growth wave.
Ground Penetrating Radar Industry Leaders
-
IDS Georadar
-
Sensors & Software Inc.
-
Chemring Group
-
Geophysical Survey Systems, Inc. (GSSI)
-
Guideline Geo AB
- *Disclaimer: Major Players sorted in no particular order
Ground Penetrating Radar Market Companies Covered in this Report
- IDS GeoRadar
- Sensors and Software Inc.
- Guideline Geo AB
- Chemring Group PLC
- GSSI (Geophysical Survey Systems Inc.)
- Ground Penetrating Radar Systems LLC
- Geoscanners AB
- Pipehawk PLC
- Utsi Electronics Ltd.
- Hilti Corporation
- Hexagon AB
- US Radar Inc.
- Radiodetection Ltd.
- Penetradar Corporation
- MALA GPR
- Leica Geosystems AG
- Trimble Inc.
- ImpulseRadar Sweden AB
- 4M Analytics Ltd.
- TransTech Systems Inc.
Market Opportunities and Future Outlook
A key near-term opportunity is turning mandated or policy-driven subsurface verification into scalable digital workflows, especially where agencies require non-invasive mapping before construction and roadworks. April 2026 guidance in Pune directed contractors to run GPR surveys ahead of road development or repair to reduce utility strikes, and in June 2026 Singapore's Urban Redevelopment Authority highlighted scaling non-invasive detection technologies including GPR for underground utility mapping. Together, these actions reinforce demand for field-ready systems that can be procured, deployed, and audited through municipal processes.
A further opportunity is the move from standalone radargrams toward integrated 3D subsurface models connected to BIM and digital-twin environments, which raises spend on software, positioning, and repeat surveys for asset maintenance. 2026 evidence includes validation of workflows combining GPR with BIM, UAV photogrammetry, and laser scanning for underground utility reconstruction, and deployments such as Genesys International using IDS GeoRadar solutions in India for 3D subsurface mapping within digital geospatial platforms. Vendors that package GPR with GNSS, automated interpretation, and export into GIS/BIM formats are positioned to support multi-stakeholder utility datasets that infrastructure owners maintain over time, rather than single-project deliverables.
Recent Industry Developments in Ground Penetrating Radar Market
- June 2026: Singapore's Urban Redevelopment Authority highlighted scaling non-invasive detection technologies including GPR for underground utility mapping, signaling rising municipal adoption of integrated subsurface workflows. The announcement underscores a shift toward standardized data capture and digital integration with existing GIS platforms.
- May 2026: Sensors & Software Inc. introduced a Noggin ground penetrating radar system featuring SplitView visualization. The release enables faster in-field interpretation and broader adoption among civil and utility teams seeking standardized outputs.
- April 2026: Pune authorities issued guidelines requiring contractors to perform GPR surveys before road development to reduce utility strikes. The policy increases early-stage procurement of robust, tested GPR systems by municipal contractors and construction vendors.
Ground Penetrating Radar Market Report Scope and Research Methodology
Market Definition and Coverage
This market covers revenues generated from ground penetrating radar (GPR) systems and related software and services that help detect and map subsurface objects and conditions across civilian and defense uses.
Scope exclusions: After-sales services are excluded from the market size.
Segments Covered in This Report
-
By Offering
- Equipment
- Software
- Services
-
By Product Type
- Handheld GPR
- Cart-Based GPR
- Vehicle-Mounted GPR
- UAV/Drone-Mounted GPR
-
By Component
- Control Unit
- Antenna
- Power Supply
-
By Frequency Range
- < 500 MHz
- 500 - 1000 MHz
- > 1000 MHz
-
By Application
- Utility Detection
- Concrete Investigation
- Municipal Inspection
- Forensics and Archaeology
- Transportation Infrastructure
- Geotechnical and Environment
- Disaster Inspection
- Law Enforcement and Military
-
By End-User Industry
- Construction and Infrastructure
- Oil and Gas / Mining
- Environmental and Agriculture
- Defense and Security
- Academic and Research
-
By Geography
-
North America
- United States
- Canada
- Mexico
-
South America
- Brazil
- Argentina
- Rest of South America
-
Europe
- Germany
- United Kingdom
- France
- Italy
- Spain
- Rest of Europe
-
Asia-Pacific
- China
- Japan
- India
- South Korea
- Southeast Asia
- Rest of Asia-Pacific
-
Middle East and Africa
- South Africa
- Saudi Arabia
- Nigeria
- United Arab Emirates
- Rest of Middle East and Africa
-
North America
Data Sources, Market Sizing, and Validation
Desk Research
Desk research is used to set the base context for demand and to keep assumptions realistic across construction, utilities, transport, and security use cases. We refer to public sources such as USGS publications for near-surface geophysics, US DOT and FAA infrastructure programs, US Census construction spending series, and defense procurement disclosures where available.
In addition, we review company annual reports, investor decks, product datasheets, and trade and association websites to understand use patterns, typical system configurations, and pricing direction. Patent databases are also reviewed to spot where antenna designs, multi-channel systems, and UAV integration are moving, which helps us avoid relying on outdated feature assumptions. For some checks, paid subscriptions for company financials and a news and financials platform are used to confirm corporate events and regional exposure. These sources are illustrative, and we also use additional public references to collect data, validate inputs, and clarify open questions.
Primary Interviews and Surveys
Primary work focuses on validating what gets purchased, how often systems are replaced, and how pricing differs by frequency range and platform type. We speak with a mix of manufacturers, channel partners, and end users such as utility locating teams, civil contractors, transport agencies, and defense oriented users across APAC, EMEA, and the Americas.
Respondent input specifically helps reconcile whether revenue is tracked as equipment only or split across equipment, software, and services, and whether replacement cycles vary meaningfully by application and platform (handheld, cart-based, vehicle-mounted, and UAV-mounted).
Distribution of primary research fieldwork respondents
| Company type | Respondent position | Region |
|---|---|---|
| Top tier: 27% | CXOs: 13% | APAC: 40% |
| Mid tier: 55% | Functional/Unit leaders: 27% | EMEA: 36% |
| Smaller Players: 18% | Managers: 60% | Americas: 24% |
Market-Sizing & Forecasting
The sizing starts with a top-down build that reconstructs the addressable demand pool using end-use activity signals, and then applies realistic adoption and spend layers for GPR in each application. For example, construction and infrastructure activity, underground utility mapping intensity, transportation inspection programs, and defense and security procurement cycles are used as anchor indicators.
To keep the totals practical, the model also gets checked through selective bottom-up approximations, such as sampled average selling prices by product type (handheld, cart-based, vehicle-mounted, and UAV-mounted) multiplied by implied unit demand, and channel feedback on mix shifts between equipment, software, and services. When data is thin in smaller countries, we estimate using proxy indicators like construction spend and utility network expansion, and then adjust using regional expert feedback.
Forecasting is run with scenario analysis supported by trend smoothing, because demand can move with infrastructure funding timing and security budgets. Key inputs that are tracked include frequency range mix, typical inspection cadence for transportation assets, growth in utility detection workloads, and expected price movement as multi-channel systems scale.
Data Validation & Update Cycle
Outputs are validated by cross-checking implied spend per project and per end-user group against interview feedback and publicly visible infrastructure activity levels. Large swings are flagged, and assumptions are revisited when the model suggests unrealistic unit shipments, sudden ASP jumps, or an application share that does not match field feedback.
Before sign-off, results go through multi-step internal review so inconsistencies across offering, product type, and region are corrected. The study is refreshed annually, and interim updates are done when material events occur (for example, policy shifts, major contracts, or supply changes). Right before delivery, a final pass is completed so clients receive the most current view.
Mordor Intelligence's Ground Penetrating Radar Market Size Compared Against Other Published Estimates
Published market sizes for ground penetrating radar can vary a lot, even when the topic name looks identical. The differences usually come from what is counted in the revenue pool, the year used as the anchor, and how pricing and services are treated as adoption expands.
Some published figures stay narrowly focused on equipment sales in USD millions and keep software and service revenues limited to what is directly bundled. In Mordor Intelligence's build for this market, the estimate is expressed in USD billions and it explicitly accounts for equipment, software, and services revenues, but it keeps after-sales services out of the total to avoid double counting.
Benchmark comparison
| Source | Market Size | Gaps in Research Methodology |
|---|---|---|
| Mordor Intelligence | USD 594.11 B (2025) | |
| Industry Publisher A | USD 390.50 M (2024) | Reported in USD millions and anchored to a single base year, with scope presented mainly as equipment and related services, which can understate totals if software and broader service revenue streams are treated as minimal or bundled. |
| Global Consultancy B | USD 491.98 M (2026) | Uses a later anchor year and a narrower product-type framing that emphasizes handheld, cart-based, and vehicle-mounted systems, which can shift the result if UAV-mounted units and wider offering-level revenue splits are not fully captured. |
The spread in the table is mostly explained by unit scale (millions versus billions), the treatment of software and services, and the handling of adjacent service revenues that can be counted twice if not separated cleanly. By tying the model to observable end-use activity signals and then checking mixes and pricing with field feedback, we keep the market number traceable to clear levers that can be revisited when conditions change year to year.
Key Questions Answered in the Report
What is the current size of the ground penetrating radar market?
The ground penetrating radar market is valued at USD 645.39 billion in 2026.
How fast will the ground penetrating radar market grow through 2031?
The market is forecast to expand at a 8.63% CAGR, reaching roughly USD 976.3 billion by 2031.
Which segment holds the largest ground penetrating radar market share?
Equipment leads with 50.68% revenue share in 2025.
Why are UAV-mounted GPR systems gaining traction?
They enable surveys in hazardous or inaccessible areas and are projected to grow at 10.9% CAGR.
What is the main regulatory driver in North America?
Common Ground Alliance standards require electromagnetic utility verification before every excavation.
Which region is expected to post the fastest growth?
Asia-Pacific, driven by rapid subway construction and smart-city projects, is projected to grow at 8.7% CAGR.