
Green Hydrogen Market Size and Share
Market Overview
| Study Period | 2021 - 2031 |
|---|---|
| Market Volume (2026) | 0.47 Million tons |
| Market Volume (2031) | 10.78 Million tons |
| Growth Rate (2026 - 2031) | 87.12 % |
| Fastest Growing Market | Europe |
| Largest Market | Asia Pacific |
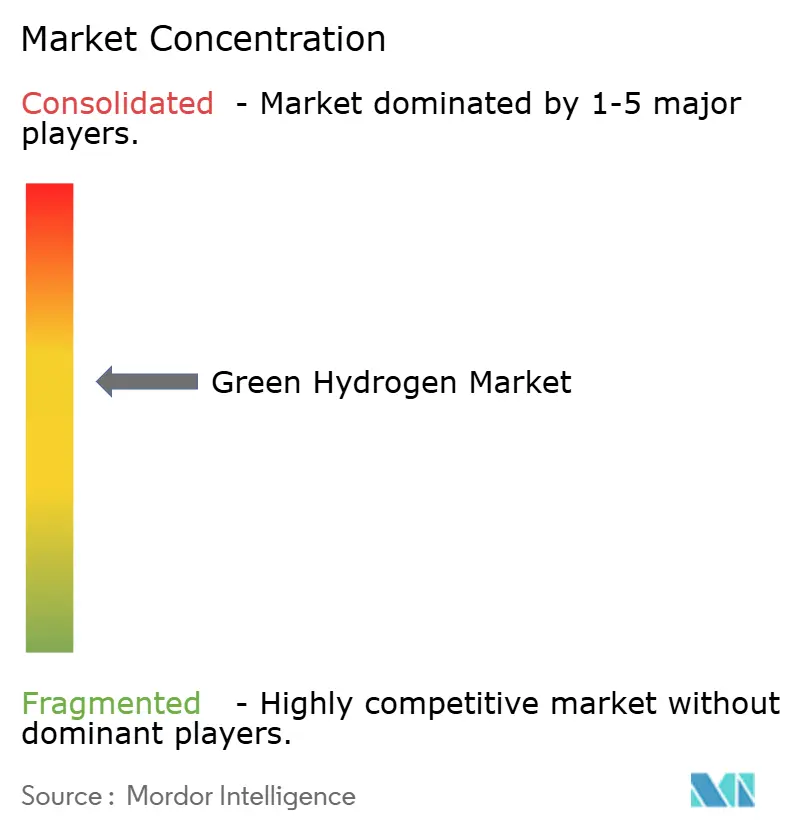
| Market Concentration | Medium |
Major Players *Disclaimer: Major Players sorted in no particular order Image © Mordor Intelligence. Reuse requires attribution under CC BY 4.0. | |
Green Hydrogen Market Analysis by Mordor Intelligence
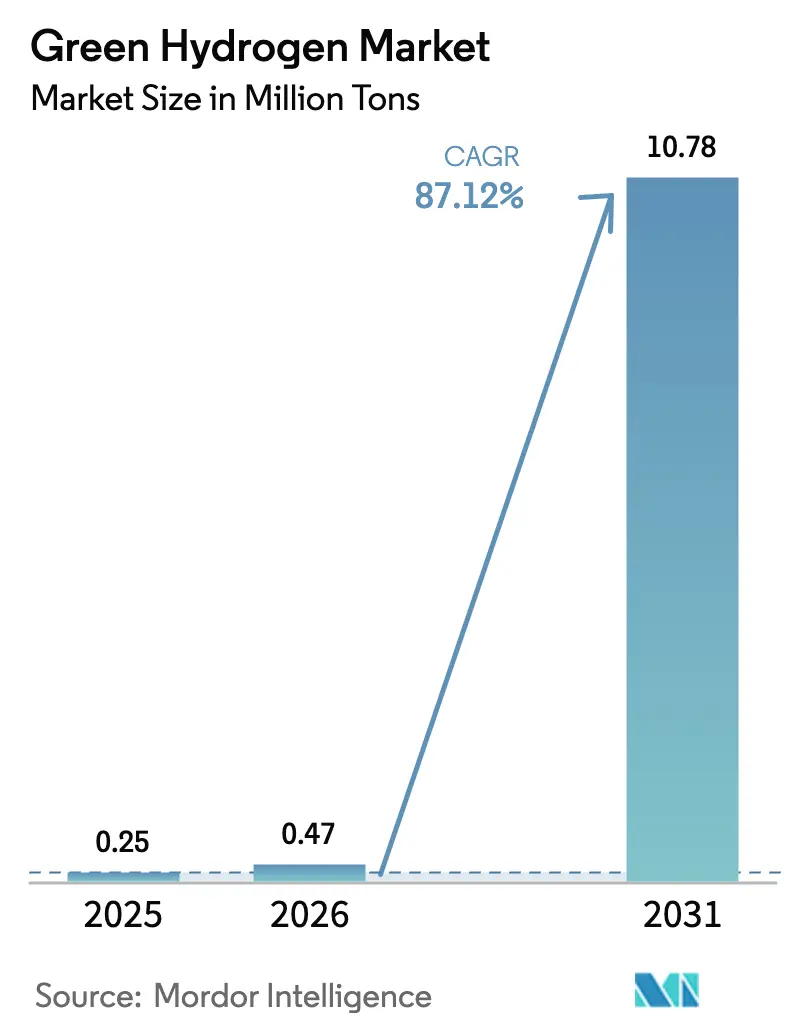
The Green Hydrogen Market size is projected to expand from 0.25 million tons in 2025 and 0.47 million tons in 2026 to 10.78 million tons by 2031, registering a CAGR of 87.12% between 2026 to 2031. This outlook translates into a sizable jump in market size and confirms that large‐scale industrial decarbonization is replacing gray hydrogen rather than supplementing it. Persistent drops in renewable power costs, supportive government incentives, and early-stage infrastructure build-outs are the primary catalysts. Capacity additions concentrate in regions with high solar irradiance or strong wind resources, while emerging carbon border fees in Europe and more stringent fuel rules in shipping extend demand to new use cases. Cost curves for electrolyzers keep bending downward as gigafactories ramp up, and merchant PPAs for curtailed electricity now let many projects lock in near-zero input prices. Competitive intensity is moderate because five manufacturers still handle most orders, yet Chinese suppliers are cutting into margins with lower-priced alkaline units and may reset price expectations once export volumes rise.
Key Report Takeaways
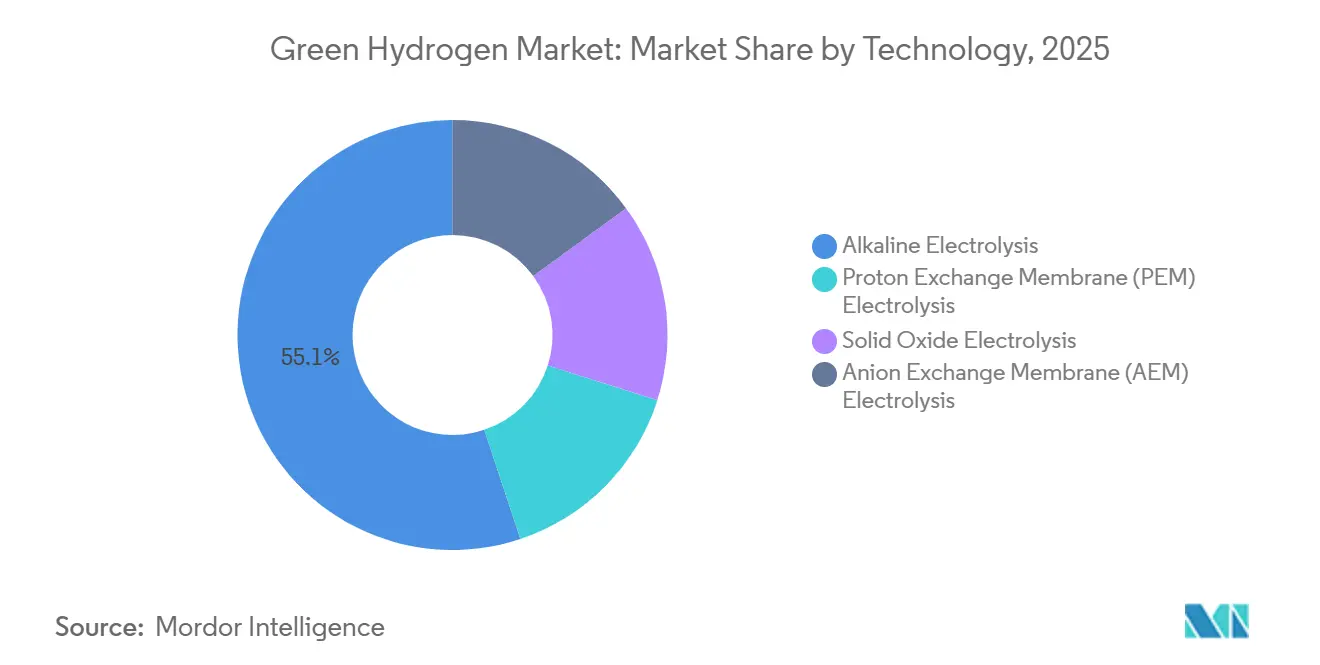
- By technology, alkaline electrolysis captured 55.13% of the 2025 volume, while PEM is forecast to post a 92.35% CAGR through 2031.
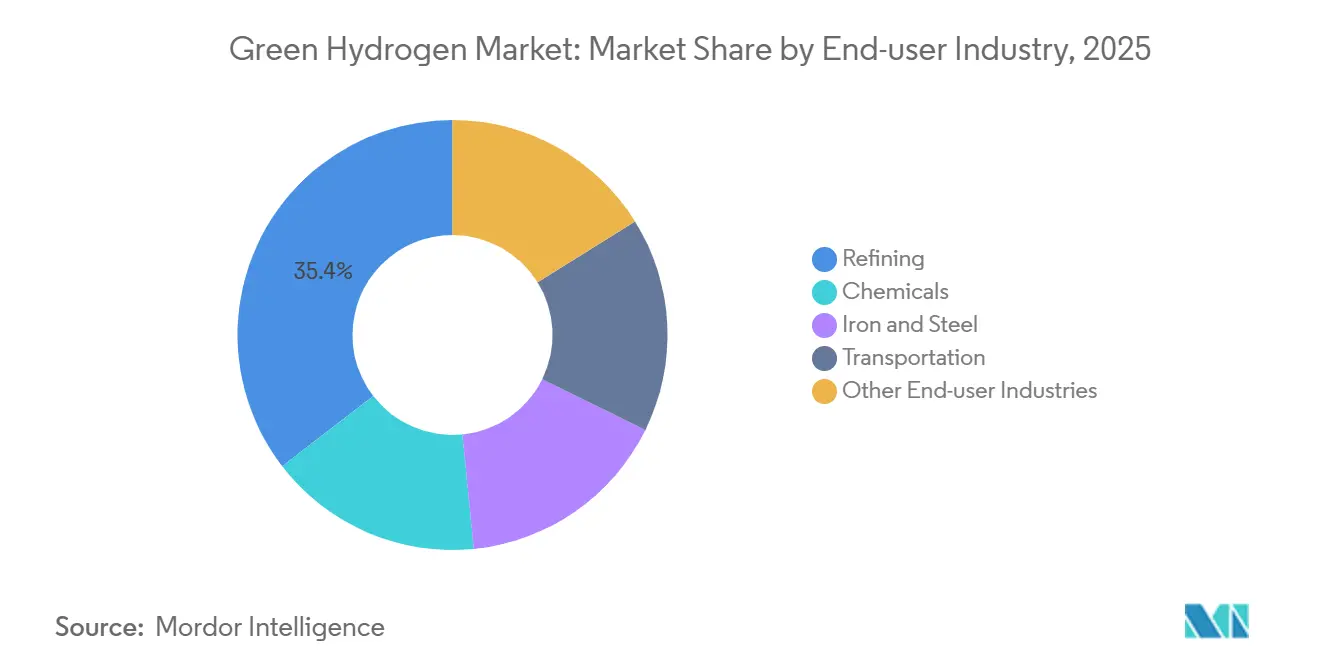
- By end-user industry, refining held 35.45% of the green hydrogen market share in 2025, but chemicals are projected to expand at a 97.22% CAGR to 2031.
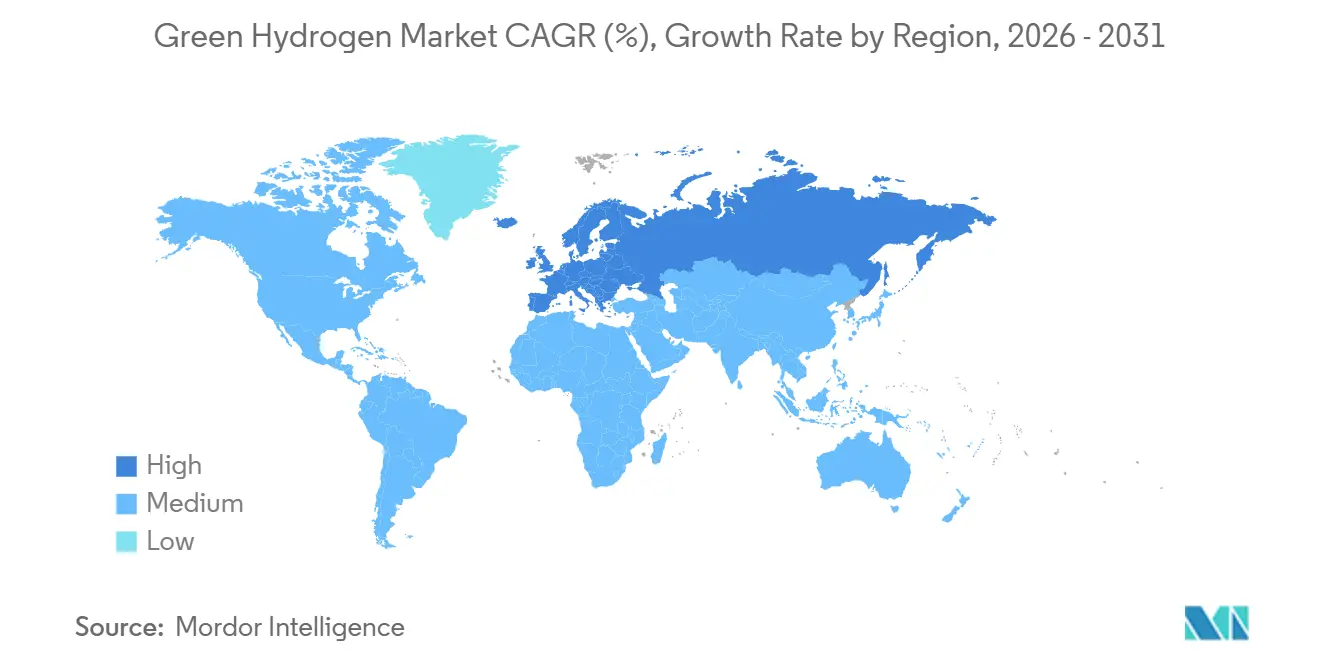
- By geography, Asia-Pacific accounted for 48.23% of the 2025 volume, yet Europe is expected to advance at a 94.19% CAGR through 2031.
Note: Market size and forecast figures in this report are generated using Mordor Intelligence’s proprietary estimation framework, updated with the latest available data and insights as of January 2026.
Market Trends and Insights
Drivers Impact Analysis of Green Hydrogen Market*
| Drivers | (~) % Impact on CAGR Forecast | Geographic Relevance | Impact Timeline |
|---|---|---|---|
| Declining LCOE of renewables in high-irradiance regions | +18.5% | Middle East, North Africa, Australia, Chile | Medium term (2-4 years) |
| EU industrial decarbonization mandates (steel, fertilizer) | +17.2% | Europe, spillover to Turkey and North Africa | Short term (≤ 2 years) |
| Maritime fuel rules spurring green-ammonia bunkering demand | +16.1% | Global, early adoption in Europe and Singapore | Medium term (2-4 years) |
| Electrolyzer-gigafactory economies of scale | +15.8% | Global, concentrated in China, Germany, India, United States | Short term (≤ 2 years) |
| Surplus curtailed wind/solar PPAs enabling negative-price H₂ | +14.3% | North America, Europe, Australia | Long term (≥ 4 years) |
| Source: Mordor Intelligence | |||
Declining LCOE of Renewables in High-Irradiance Regions
In 2025, solar and onshore wind projects in Saudi Arabia, Chile, and Australia achieved low generation costs. This pricing enables electrolytic hydrogen to compete with steam methane reforming, provided natural gas prices remain favorable. The NEOM complex enjoys a competitive blended LCOE, allowing it to operate without subsidies. Meanwhile, Chile’s Magallanes wind cluster aims to export green ammonia by 2030. By co-locating electrolyzers with resource sites, projects can significantly reduce transmission costs. A case in point is Fortescue’s system in Pilbara, which showcases how iron-ore producers are integrating hydrogen into their operations [1]. Collectively, these initiatives have narrowed the green premium over time.
EU Industrial Decarbonization Mandates (Steel, Fertilizer)
Under the 2026-2030 ETS, a carbon price floor renders blast-furnace steel unviable unless carbon capture or hydrogen-based DRI is employed. This is underscored by ArcelorMittal’s trials in Hamburg, where a shift to hydrogen achieved a significant reduction in Scope 1 emissions. Germany allocated funds to help fertilizer producers mitigate the green premium, facilitating the offtake of green ammonia. The Carbon Border Adjustment Mechanism amplifies these challenges beyond the EU, leading Turkish and Ukrainian mills to either explore electrolytic methods or brace for tariffs on their product's value.
Maritime Fuel Rules Spurring Green-Ammonia Bunkering Demand
By 2030, the IMO mandates a reduction in well-to-wake emissions, positioning ammonia as a prime alternative fuel. In a strategic move, Maersk placed orders for vessels primed for ammonia use, but with a caveat: the establishment of bunkering hubs in Rotterdam, Singapore, and Los Angeles. Demonstrating the fuel's potential, MAN Energy unveiled a prototype ammonia engine boasting high thermal efficiency. Further solidifying ammonia's foothold, Rotterdam inaugurated a substantial storage terminal in November 2025. While ammonia storage demands more space than diesel, shipowners find value in sidestepping sulfur scrubbers and intricate carbon capture systems, streamlining compliance for their long-haul fleets.
Electrolyzer-Gigafactory Economies of Scale
At thyssenkrupp Nucera’s Delfzijl plant, alkaline stack costs have been reduced, while at Reliance Industries’ Jamnagar factory, PEM stack costs have also decreased. In China, Ningxia Baofeng has achieved a milestone, producing alkaline units at a competitive rate. Thanks to automated assembly and standardized balance-of-plant packages, engineering expenses have been reduced. This efficiency allows the green hydrogen market to profitably support projects operating at low utilization levels.
Restraints Impact Analysis of Green Hydrogen Market*
| Restraints | (~) % Impact on CAGR Forecast | Geographic Relevance | Impact Timeline |
|---|---|---|---|
| Iridium and platinum supply bottlenecks for PEM stacks | -3.2% | Global, acute in Europe and North America | Short term (≤ 2 years) |
| Limited grid-hosting capacity for greater than 100 MW electrolysis clusters | -2.4% | Asia Pacific, North America, emerging markets | Medium term (2-4 years) |
| High cost of cryogenic LH₂ shipping over 7,000 km routes | -1.8% | Intercontinental trade routes (Middle East to Asia, Australia to Europe) | Long term (≥ 4 years) |
| Source: Mordor Intelligence | |||
Iridium and Platinum Supply Bottlenecks for PEM Stacks
Global iridium output was significant in 2025, yet PEM demand may increase substantially in 2028 if loading rates stay constant. Spot iridium prices rose sharply in December 2025, adding to PEM costs. Recycling provides only a limited amount annually, and mixed-oxide substitutes lag in durability[2]. Suppliers aim to cut loadings by 2027, but supply concentration in South Africa and labor strikes heighten price volatility.
Limited Grid-Hosting Capacity for Large Electrolyzers
Clusters require reactive-power compensation and frequently require the construction of new high-voltage lines. Reliance Industries undertook the construction of a dedicated 400 kV substation and a 60 MVAR static-VAR unit in Jamnagar, resulting in a project delay. California’s Path 15 corridor faces a limitation, unable to accommodate additional electrolysis load without transmission enhancements, consequently deferring certain projects. Germany and Australia encountered analogous challenges, leading to moratoria or the implementation of distributed siting regulations.
*Our forecasts treat driver/restraint impacts as directional, not additive. The impact forecasts reflect baseline growth, mix effects, and variable interactions.
Green Hydrogen Market Segment Analysis
By Technology:
PEM Gains Despite Alkaline DominanceAlkaline systems controlled 55.13% of 2025 volume, thanks to capital costs and lifetimes aligning perfectly with the demands of refiners and chemical plants operating at near-maximum efficiency. Meanwhile, PEM systems are set to climb at a 92.35% CAGR, bolstered by their rapid ramp rates, making them ideal for harnessing intermittent power. As strategies for renewable integration mature, the market size for PEM projects in the green hydrogen sector is set for a pronounced uptick. On the other hand, high-temperature SOEC pilots, boasting impressive electrical efficiency, face a hurdle: their stack life, falling short of 20,000 hours, curtails immediate adoption. AEM units, while successfully sidestepping the use of platinum group metals, grapple with a challenge of membrane durability, also under the 20,000-hour mark, before they can hit the commercial stage.
Recent orders highlight this industry shift. In 2025, refiners in the Asia-Pacific region secured a significant amount of alkaline equipment, prioritizing lower capital expenditures. Conversely, Europe, leaning towards PEM, captured a dominant share of those orders, justifying the premium with potential grid-service revenue. Solid oxide systems, though holding a smaller share of the 2025 volume, are on track for robust growth, driven by iron and steel plants merging electrolysis with their waste heat streams. This trend underscores a pivotal shift: the choice of technology is increasingly dictated by plant-specific economics rather than a blanket preference for one technology over another.

By End-User Industry:
Chemicals Overtake Refining GrowthRefining commanded 35.45% of 2025 demand, a testament to the entrenched hydrogen networks in hydrocracking and desulfurization units. Chemicals will be the fastest-growing segment at a 97.22% CAGR. This surge is largely fueled by fertilizer and methanol producers striving to align with increasingly stringent life-cycle carbon thresholds. Yara's electrolyzer is making waves, displacing natural-gas feedstock annually. Meanwhile, BASF has ambitious plans, eyeing PEM capacity that promises an annual yield of green methanol. Although transportation currently accounts for a modest share of the 2025 volume, the landscape could shift as heavy-duty fuel cell trucks edge closer to diesel's cost competitiveness. Notably, the green hydrogen market for the chemicals segment is on track to outpace refining within the forecast period.
Iron and steel are set for significant expansion, driven by the viability of DRI retrofits in the wake of rising carbon pricing. While major plants grapple with substantial capex, the direct-reduction technology offers a silver lining, slashing output CO₂ emissions. This reduction is especially crucial for European mills contending with CBAM levies. The remaining sectors, including glass, power generation, and smaller industrials, collectively account for a smaller share of the 2025 demand.
Geography Analysis
APAC Green Hydrogen Market
Asia-Pacific’s 48.23% share in 2025, driven by the rapid expansion of electrolyzer capacity in China and India, even as coal-dominated grids pose challenges to carbon intensity improvements. China Three Gorges operates a large electrolyzer, harnessing cost-effective off-peak wind power. With limited domestic renewable resources, Japan emerges as the top prospective importer, securing long-term agreements. South Korea, bolstered by substantial subsidies, is retrofitting the Ulsan and Incheon clusters, targeting a complete transition to green supply by 2029. Meanwhile, India’s National Mission has rallied commitments, but to address reactive power and harmonic constraints in Rajasthan, an investment is needed for grid enhancements.
Europe Green Hydrogen Market
Europe records the highest growth rate at a projected 94.19% CAGR. The CBAM policy compels upstream suppliers to pivot to green hydrogen or incur tariffs. Concurrently, Germany is channeling significant funding into a pipeline initiative, connecting offshore wind resources to plants in the Ruhr Valley. Highlighting the region's potential, Iberdrola's ambitious project in Castilla-La Mancha demonstrates that competitively priced solar energy can yield hydrogen at a low cost. The UK is making strides too, with a long-term guarantee of a strike price, facilitating the development of new capacity. Not to be outdone, France's TotalEnergies has augmented its La Mède facility, aiming for a substantial reduction in renewable diesel emissions.
North America Green Hydrogen Market
North America, buoyed by the U.S. 45V tax credit, is witnessing robust growth. Air Products is making a significant move with a large complex in Louisiana, integrating electrolysis with renewable energy, targeting substantial annual output for export. In Quebec, Canada, a plant is capitalizing on hydro energy, translating to a low production cost. Mexico is also in the fray, with Tula refinery's retrofit set to substitute gray hydrogen, leading to significant annual CO₂ savings.
MEA and South America Green Hydrogen Market
By 2030, the Middle East and Africa, spearheaded by NEOM and Masdar, are poised to export a large volume of green ammonia. Meanwhile, South America's Chilean wind corridor is attracting substantial investment for projects aimed at exports.
Value Chain Analysis
The green hydrogen value chain starts with renewable electricity supply (utility-scale solar and wind, grid power backed by qualifying PPAs, and curtailed-power offtake) and proceeds through electrolyzer technology selection (alkaline, PEM, and emerging SOEC/AEM), stack and balance-of-plant manufacturing, and project delivery via EPC and integrators. Large projects increasingly co-locate generation and electrolysis to reduce transmission exposure, while industrial-gas majors and OEMs support engineering, commissioning, and long-term service. Examples of scale in the midstream include Air Liquide and TotalEnergies advancing large Dutch electrolyzer developments in Rotterdam (ELYgator, 200 MW) and Zeeland (250 MW), showing how hub-based deployment links electrolysis with port and industrial cluster logistics.
Downstream, hydrogen is conditioned and moved through on-site pipelines and storage for captive use in refineries and chemical plants, with derivatives (notably ammonia and methanol) supporting easier transport and end-use substitution in shipping and chemicals. Key enabling layers include certification and life-cycle accounting systems that validate renewable origin, plus grid and interconnection infrastructure (substations, reactive power equipment, and high-voltage lines) that can become schedule-critical for >100 MW clusters. Supply-side constraints persist around PEM catalysts and membranes. Competitive dynamics also keep shifting as Chinese alkaline suppliers expand exports, while Western vendors differentiate through higher-efficiency stacks, standardized balance-of-plant packages, and service contracts.
Competitive Landscape
The green hydrogen market is moderately consolidated. Chinese firms priced alkaline stacks competitively, capturing a significant share of bookings in the Asia-Pacific region and exerting pressure on Western margins. Patent activity centers on iridium-free PEM catalysts and low-resistance plate coatings; thyssenkrupp nucera secured patents for titanium-nitride layers, achieving a notable reduction in contact resistance. Growth opportunities lie in distributed off-grid packages, SOEC systems for process-heat integration, and electrolyzer-as-a-service contracts.
Green Hydrogen Industry Leaders
-
Air Liquide
-
Linde PLC
-
China Petroleum & Chemical Corporation (Sinopec)
-
Plug Power Inc.
-
Nel
- *Disclaimer: Major Players sorted in no particular order
Green Hydrogen Market Companies Covered in this Report
- Air Liquide
- Air Products and Chemicals Inc.
- BP PLC
- CHARBONE Hydrogen Corporation
- China Petroleum & Chemical Corporation (Sinopec)
- China Three Gorges Corporation
- Cummins Inc.
- Engie SA
- Fortescue Future Industries
- Green Hydrogen International Corp.
- Iberdrola SA
- Intercontinental Energy
- ITM Power PLC
- Lhyfe SA
- Linde PLC
- McPhy Energy S.A.
- Nel
- Ningxia Baofeng Energy Group Co. Ltd.
- Orsted A/S
- Plug Power Inc.
- Reliance Industries Limited
- Shell PLC
- Siemens Energy AG
- thyssenkrupp nucera
- Tidewater Renewables Ltd.
- Uniper SE
- Yara
Market Opportunities and Future Outlook
Near-term whitespace centers on converting industrial clusters from gray hydrogen to certified low-carbon supply by pairing new electrolysis capacity with qualifying renewable electricity and firm offtake. Large-scale hub projects provide concrete pathways for this shift: Air Liquide and TotalEnergies have progressed major electrolyzer investments in the Netherlands (Rotterdam and Zeeland), aligning green hydrogen supply with port-adjacent refining and chemical demand, and opening follow-on work for pipeline interconnects, storage, and derivative handling within cluster footprints.
Geographically, policy-backed demand creation and infrastructure build-out are opening additional routes to scale. In China, Sinopec has operational green hydrogen assets (including a 20,000 tpa facility in Kuche, Xinjiang) and is developing long-distance logistics such as a reported 400 km green hydrogen pipeline from Ulanqab to the Beijing-Tianjin-Hebei region, which expands the addressable market beyond local production-consumption pairs. In the United States, California Senate Bill 1350 (signed June 29, 2026) explicitly integrates renewable hydrogen-fueled turbines into the state Renewable Portfolio Standard, supporting opportunities for power-sector hydrogen procurement where grid flexibility and firm capacity are valued. Across project economics, equipment-side cost-downs from gigafactory-scale manufacturing and modular plant designs increase the case for standardized, repeatable deployments, while grid-hosting limitations and critical-material bottlenecks push opportunities toward siting strategies, hybridization (storage and grid services), and catalyst-loading reduction or non-PGM pathways in PEM-adjacent technology development.
Recent Industry Developments in Green Hydrogen Market
- May 2026: Air Liquide announces that the ELYgator 200 MW project milestone was reached with the delivery and installation of the first PEM modules in the Netherlands. The development highlights near-term on-site decarbonization capacity for refineries and industrial hubs. It strengthens electrolyzer as a service and onsite deployment momentum.
- January 2026: Plug Power Inc. completes installation of 100 MW GenEco electrolyzers at Galp’s Sines Refinery, Portugal. This shows large-plant deployment and refinery decarbonization collaboration. It validates PEM Megawatt-class stack deployment at the site.
- February 2025: Air Liquide launches two electrolyzer projects in Rotterdam and Zeeland totaling approximately 450 MW. This expands European green hydrogen capacity and supports policy-driven decarization and PPA-driven demand growth.
Green Hydrogen Market Report Scope and Research Methodology
Market Definition and Coverage
For this study, the green hydrogen market covers hydrogen produced through water electrolysis where the electricity is sourced from renewables. We count it when the hydrogen is produced and supplied for end use or contracted offtake.
Scope exclusions: Grey and blue hydrogen pathways, along with revenue from electrolyzer equipment sales, are not counted in this market size.
Segments Covered in This Report
- By Technology
- Alkaline Electrolysis
- Proton Exchange Membrane (PEM) Electrolysis
- Solid Oxide Electrolysis
- Anion Exchange Membrane (AEM) Electrolysis
- By End-user Industry
- Refining
- Chemicals
- Iron and Steel
- Transportation
- Other End-user Industries (Power Generation, Glass, Semiconductors)
- By Geography
- Asia-Pacific
- China
- India
- Japan
- South Korea
- Rest of Asia-Pacific
- North America
- United States
- Canada
- Mexico
- Europe
- Germany
- United Kingdom
- France
- Italy
- Rest of Europe
- South America
- Brazil
- Argentina
- Rest of South America
- Middle-East and Africa
- Saudi Arabia
- South Africa
- Rest of Middle-East and Africa
- Asia-Pacific
Data Sources, Market Sizing, and Validation
Desk Research
Desk work starts by building a clean fact base on supply, demand drivers, and policy signals, because project pipelines in renewable power and hydrogen are changing quickly. We review public energy and climate releases, renewable power additions, and hydrogen strategy updates, then map them into a common set of terms and units.
Examples of sources we use include the International Energy Agency, IRENA, the U.S. Department of Energy, Eurostat, UN Comtrade trade statistics, and national statistics offices. These inputs are supplemented with project announcements, company filings, investor decks, and reputable press coverage. In some cases, we also reference paid subscriptions for company financials and news screening, patent databases for electrolyzer and stack innovation activity, and shipment-level import and export datasets, where trade flows help confirm inputs. This list is not exhaustive, and many other sources were also referred to for data collection, validation, and research clarification.
Primary Interviews and Surveys
Primary work is used to confirm what is actually getting built and operated, and to pressure test assumptions that desk sources cannot fully settle. We speak with a mix of project developers, equipment ecosystem participants, offtakers, utilities, and policy or standards stakeholders across major regions, so cost, utilization, and timing assumptions are aligned with real contracting behavior.
Distribution of primary research fieldwork respondents
| Company type | Respondent position | Region |
|---|---|---|
| Top tier: 36% | CXOs: 13% | APAC: 51% |
| Mid tier: 42% | Functional/Unit leaders: 43% | EMEA: 30% |
| Smaller Players: 22% | Managers: 44% | Americas: 19% |
Market-Sizing & Forecasting
Our sizing starts from a top-down build where announced and operating electrolyzer-linked hydrogen output is reconstructed by geography and end-use, then filtered through realistic commissioning schedules. To keep it grounded, the total is checked against selective bottom-up views, including sampled project capacity rollups, channel feedback on delivered volumes, and price-per-kg cross checks where local pricing is available.
Key inputs that move the model include renewable electricity availability and pricing, electrolyzer capacity additions and expected utilization rates, water and site constraints for large projects, policy support mechanics (such as auctions, credits, and guarantees of origin), and the pace of signed offtake agreements in refining, chemicals, steel, and transport. When data gaps show up, we use conservative fill rules based on similar projects in the same region, then recheck them through follow-up expert calls.
For forecasting, we use scenario analysis because timelines can shift quickly with permitting, grid connection, and subsidy clarity. We then narrow the scenario ranges using consensus from interviews on expected commissioning and ramp-up patterns. The final output is kept reproducible, since the same steps can be rerun when new capacity announcements or policy changes occur.
Data Validation & Update Cycle
Validation is done through multiple passes. Model outputs are compared with independent signals such as renewable capacity trends, electrolyzer shipment momentum, public project trackers, and disclosed offtake volumes. Any large variance triggers a deeper review of assumptions.
Before sign-off, an analyst runs anomaly checks across regions, technologies, and end-use categories, followed by an internal review so that calculation logic and inputs remain consistent. Reports are refreshed annually, and interim updates are made when material events occur, such as large project cancellations, major subsidy changes, or step-changes in electrolyzer pricing. Right before delivery, we do a fresh data pass so clients receive the latest updated view.
Mordor Intelligence's Green Hydrogen Market Sizing Compared With Other Published Estimates
Published market values for green hydrogen often disagree because the market can be counted in different units and at different points in the value chain, which changes what is included in the total. The spread is usually driven by whether the estimate tracks physical output, revenue, or pipeline intent, and by how quickly project timelines are refreshed.
Electrolyzer hardware revenue sits outside Mordor Intelligence's scope, so the market is expressed as produced green hydrogen volume. This reduces distortion from equipment sales or capacity announcements that have not yet converted into output. Differences also come from whether under-construction projects are counted at nameplate capacity, how utilization rates are assumed during ramp-up, and whether currency timing is applied to a single base year or rolled forward with price-per-kg changes.
Benchmark comparison
| Source | Market Size | Gaps in Research Methodology |
|---|---|---|
| Mordor Intelligence | USD 0.47 M (2026) | |
| Industry Publisher A | USD 475.00 M (2023) | Uses a revenue lens and a different base year, which can blend early pilot sales and contracted pricing without tying totals to produced volume. |
| Industry Publisher B | USD 3.78 B (2024) | Values the market mainly through project pipeline and broader commercial activity, which can include planned capacity and adjacent spending that is not yet reflected in actual output. |
The table shows that the main disagreement comes from mixing volume-based measurement with revenue-based or pipeline-based counting. By keeping the scope tied to what is produced, and validating ramp-up assumptions with independent build and offtake signals, the estimate stays easier to trace back to clear, repeatable inputs.
Key Questions Answered in the Report
What volume does the green hydrogen market reach by 2031?
The market is forecast to hit 10.78 million tons by 2031, up from 0.47 million tons in 2026, registering a CAGR of 87.12%.
Which technology grows fastest through 2031?
PEM electrolysis posts the highest forecast growth at a 92.35% CAGR because its fast ramp rates blend well with variable renewable generation.
Why is Europe showing the highest growth rate?
Binding carbon-border fees, an updated ETS, and well-funded infrastructure programs are driving a projected 94.19% CAGR for European demand.
Which end-use segment will overtake refining?
The chemicals segment is projected to expand at a 97.22% CAGR and surpass refining demand before 2031, mainly through ammonia and methanol synthesis.