
Green Coatings Market Size and Share
Market Overview
| Study Period | 2020 - 2031 |
|---|---|
| Market Size (2026) | USD 153.14 Billion |
| Market Size (2031) | USD 191.39 Billion |
| Growth Rate (2026 - 2031) | 4.56 % |
| Fastest Growing Market | Asia Pacific |
| Largest Market | Asia Pacific |
| Market Concentration | Medium |
Major Players *Disclaimer: Major Players sorted in no particular order Image © Mordor Intelligence. Reuse requires attribution under CC BY 4.0. | |
Green Coatings Market Analysis by Mordor Intelligence
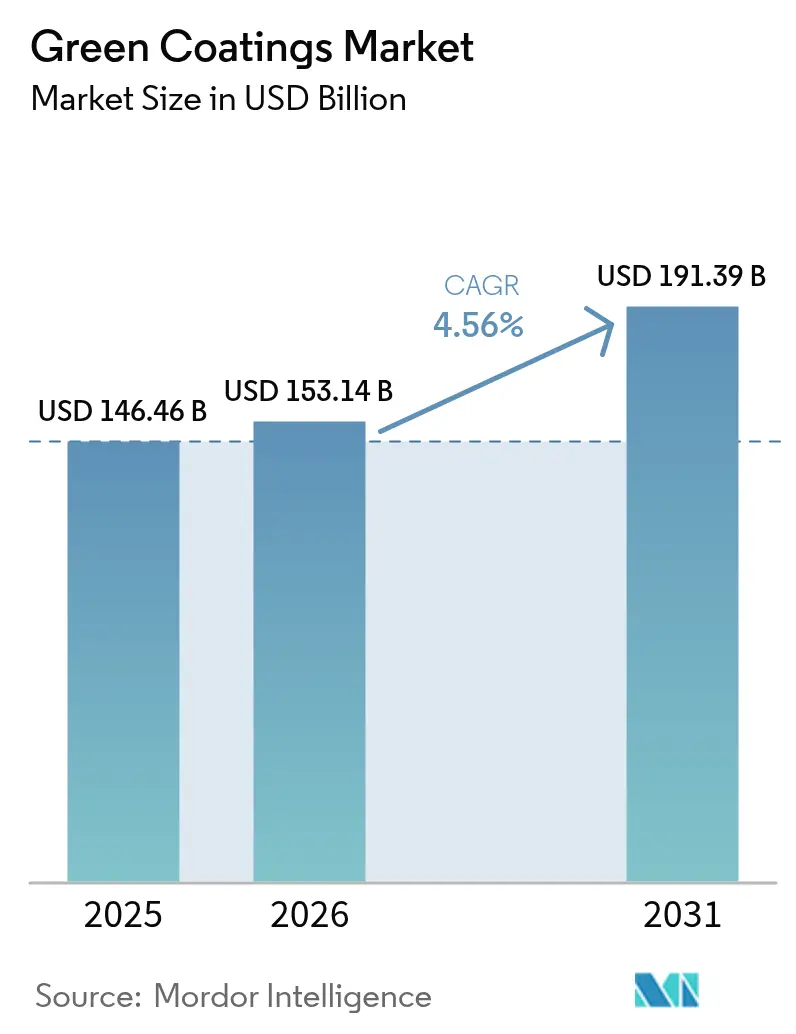
The green coatings market size is expected to grow from USD 146.46 billion in 2025 to USD 153.14 billion in 2026 and is forecast to reach USD 191.39 billion by 2031 at 4.56% CAGR over 2026-2031. Regulatory pressure that tightens limits on volatile organic compounds (VOC), rapid progress in water-borne chemistries and powder technologies, and higher penetration in automotive and architectural uses remain the central growth engines of the green coating market. California’s South Coast Air Quality Management District has already cut allowable VOC content in automotive refinish products under amended Rule 1151 and will enforce even stricter levels by 2033. In parallel, the European Union will prohibit per- and polyfluoroalkyl substances (PFAS) in food-contact packaging from August 2026, redirecting packaging formulators toward bio-based barriers. OEMs seeking lower energy paint shops and builders pursuing green certifications are expanding the addressable pool for sustainable solutions, while technology that lifts the durability of water-based resins now rivals solvent-borne systems.
Key Report Takeaways
- By type, water-based coatings led with 54.62% revenue share in 2025, whereas powder coatings are projected to post a 6.18% CAGR through 2031, remaining the fastest-growing sub-category.
- By application, architectural coatings accounted for 48.21% of 2025 revenue; packaging coatings are set to expand at 6.1% CAGR through 2031.
- By geography, Asia-Pacific commanded 43.68% of 2025 revenue and is also the quickest-advancing region at 5.42% CAGR through 2031.
Note: Market size and forecast figures in this report are generated using Mordor Intelligence’s proprietary estimation framework, updated with the latest available data and insights as of 2026.
Market Trends and Insights
Drivers Impact Analysis of Green Coatings Market*
| Driver | (~) % Impact on CAGR Forecast | Geographic Relevance | Impact Timeline |
|---|---|---|---|
| Stringent environmental regulations on VOC emissions | +1.8% | Global, with California and EU leading | Medium term (2-4 years) |
| Growing demand for low-VOC architectural coatings | +1.2% | North America & EU, expanding to Asia-Pacific | Short term (≤ 2 years) |
| Automotive OEM shift toward energy-efficient paint shops | +0.9% | Global, concentrated in automotive manufacturing hubs | Medium term (2-4 years) |
| Advances in water-based resin chemistry enhancing durability | +0.7% | Global | Long term (≥ 4 years) |
| Adoption of bio-based resins from agricultural waste | +0.6% | Global, with early gains in Europe and North America | Long term (≥ 4 years) |
| Source: Mordor Intelligence | |||
Stringent Environmental Regulations on VOC Emissions
New VOC limits are redefining acceptable formulation windows for the green coating market. South Coast AQMD’s Rule 1151 phases in lower VOC ceilings for automotive refinish products beginning May 2025 and culminates in the strictest thresholds by 2033, pushing body shops toward water-borne systems[1]. On another front, the EU Packaging and Packaging Waste Regulation caps PFAS at 25 ppb per individual substance and 250 ppb total, steering packaging suppliers to bio-based coatings that avoid fluorinated chemistries[2]. Businesses already holding portfolios of compliant products gain a first-mover advantage, whereas producers tied to legacy solvent-borne lines face incremental compliance cost and potential market exclusion.
Growing Demand for Low-VOC Architectural Coatings
Home repairs, commercial retrofits, and green-building standards continue to draw the construction value chain toward low-VOC alternatives. Sherwin-Williams reports a noticeable shift in residential repaint orders toward paints designed for easy recycling and lower embodied carbon[3]. Water-borne formulations now deliver the same gloss retention and scrub resistance as solvent-borne equivalents. AkzoNobel’s RUBBOL WF 3350 exemplifies this transition, pairing 20% bio-based content with warranty-backed durability in indoor and outdoor wood finishes.
Automotive OEM Shift Toward Energy-Efficient Paint Shops
Vehicle makers are updating paint lines to curb operating expenditure and future-proof against carbon tariffs. General Motors’ three-wet process omits the primer-bake stage, trimming 50% of paint-booth energy per car and avoiding 80,000 t of greenhouse gases annually. Joint programs between PPG and the U.S. Department of Energy explore multi-layer systems that cure at lower temperatures, unlocking further gains for water-borne topcoats.
Advances in Water-Based Resin Chemistry Enhancing Durability
Research in self-crosslinking acrylics and bio-epoxies is closing the historical performance gap with solvent lines. Mazda’s Aqua-tech paint technology, for instance, cuts plant VOC emissions 57% yet keeps premium-grade finish quality. New water-borne latex platforms reach salt-spray corrosion resistance comparable to legacy alkyds, expanding their use to industrial machinery coatings often exposed to moisture and abrasion.
Restraints Impact Analysis of Green Coatings Market*
| Restraint | (~) % Impact on CAGR Forecast | Geographic Relevance | Impact Timeline |
|---|---|---|---|
| Performance gaps versus solvent-borne in harsh environments | -0.8% | Global, particularly in marine and industrial applications | Medium term (2-4 years) |
| Higher total applied cost for end-users | -0.6% | Global, with greater impact in price-sensitive markets | Short term (≤ 2 years) |
| Supply constraints of bio-based feedstocks | -0.4% | Global, with acute impact in regions dependent on imports | Medium term (2-4 years) |
| Source: Mordor Intelligence | |||
Performance Gaps Versus Solvent-Borne in Harsh Environments
Marine hulls, offshore platforms, and chemical storage tanks still demand the long-term fouling resistance and barrier strength of high-solids epoxies rich in solvents. Although self-healing siloxane hybrids and chrome-free inhibitors are emerging, their commercial adoption is gradual because certification cycles are lengthy and shipowners resist untested chemistries.
Higher Total Applied Cost for End-Users
Even as raw VOC-free ingredients fall in price, the installed cost of a water-borne or bio-based system can remain 5–15% higher once extended flash-off or specialized spray equipment is factored in. This differential narrows when operations internalize lower insurance premiums tied to reduced fire risk and when local incentives discount greener materials, yet it persists in cost-sensitive geographies.
*Our forecasts treat driver/restraint impacts as directional, not additive. The impact forecasts reflect baseline growth, mix effects, and variable interactions.
Green Coatings Market Segment Analysis
By Type:
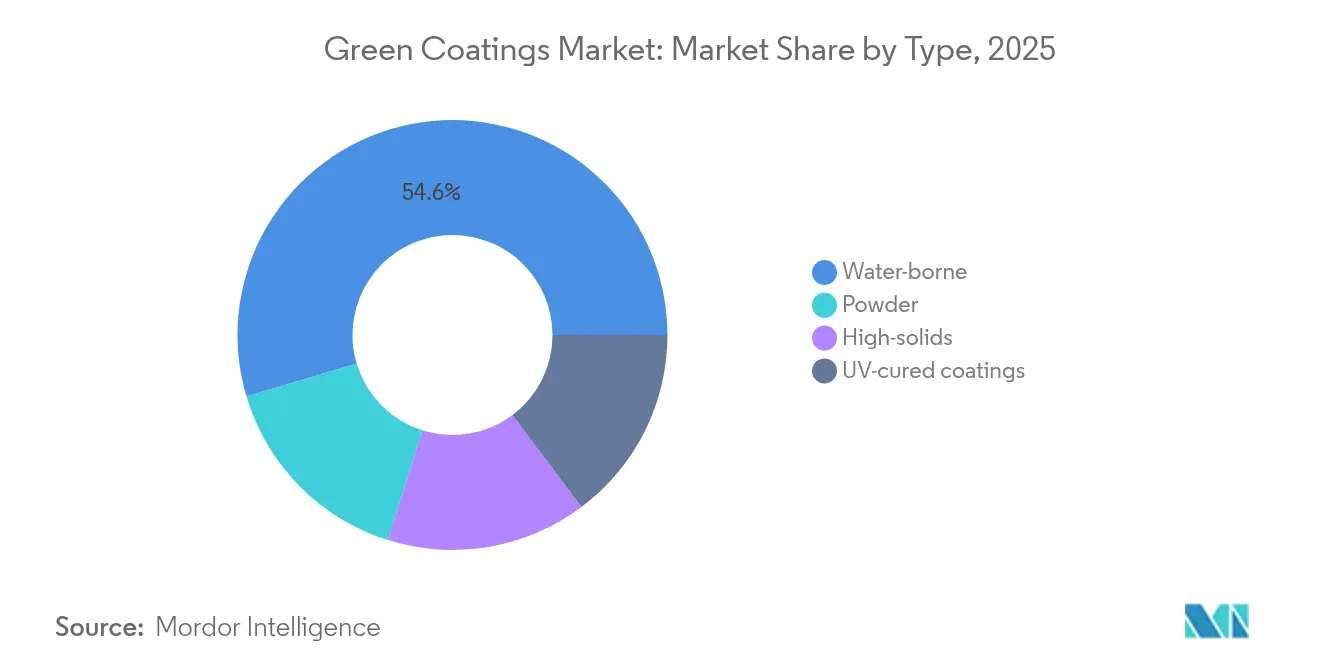
Powder Coatings Lead Innovation DriveWater-borne systems preserved leadership in 2025 with a 54.62% share of the green coating market. Their dominance is rooted in favorable compliance footprints and constant resin upgrades that yield mechanical strength on par with solvent-borne counterparts. Mazda’s plant-wide switch to advanced water-based topcoats alone lowered VOC output by 57% while retaining showroom-grade gloss. Powder coatings, however, offer the most rapid trajectory, advancing at 6.18% CAGR to 2031. Catalyst-assisted infrared ovens now cure thick films in just 2–3 minutes at roughly 225 °C, elevating production throughput and slashing utility bills. Sherwin-Williams’ Powdura ECO illustrates circular design, embedding every pound of powder with recycled PET equal to sixteen half-liter bottles. The green coating market size for powder lines is projected to expand in tandem with low-temperature formulations that harden at 150 °C, opening doors to heat-sensitive plastics and MDF furniture. Meanwhile, UV-curable liquids occupy specialized niches in electronics where near-instant cure is mandatory.
The green coating industry also benefits from higher-solids alkyd and acrylic hybrids. These systems cut the solvent fraction below 250 g/L without sacrificing wet edge or adhesion to metallic substrates. Collectively, such variants reinforce the perception that sustainable chemistries can meet or exceed conventional benchmarks.

By Application:
Packaging Drives Sustainability TransitionArchitectural paints captured 48.21% of green coating market share in 2025, propelled by construction rebounds and stricter indoor-air credit thresholds within LEED, BREEAM, and WELL frameworks. Formulators migrate toward water-borne emulsions featuring bio-solvents and renewable pigments, exemplified by AkzoNobel’s 20% bio-based wood-care line. Demand is especially resilient in the U.S. repaint segment, where homeowners favor low-odor options for occupied dwellings. Packaging coatings, on the other hand, are scaling fastest at 6.1% CAGR, pushed by EU PFAS bans and rising consumer scrutiny of food-contact safety. This segment alone is expected to enlarge the green coating market size by an incremental USD 6.3 billion between 2026 and 2031, buoyed by edible polysaccharide films that extend shelf life while maintaining compostability.
Industrial coatings, from oil-field equipment to heavy-duty trucks, converge on self-healing and anti-scratch additives that extend maintenance intervals. Automotive clearcoats harness nanoceramic dispersions to resist micro-marring, aligning with multi-coat wet-on-wet processes that pare down oven stages. Wood, electronics, and specialized sectors remain secondary yet critical adopters, turning to niche chemistries such as lignin-based binders and halogen-free flame retardants to address unique functional gaps.

Geography Analysis
APAC Green Coatings Market
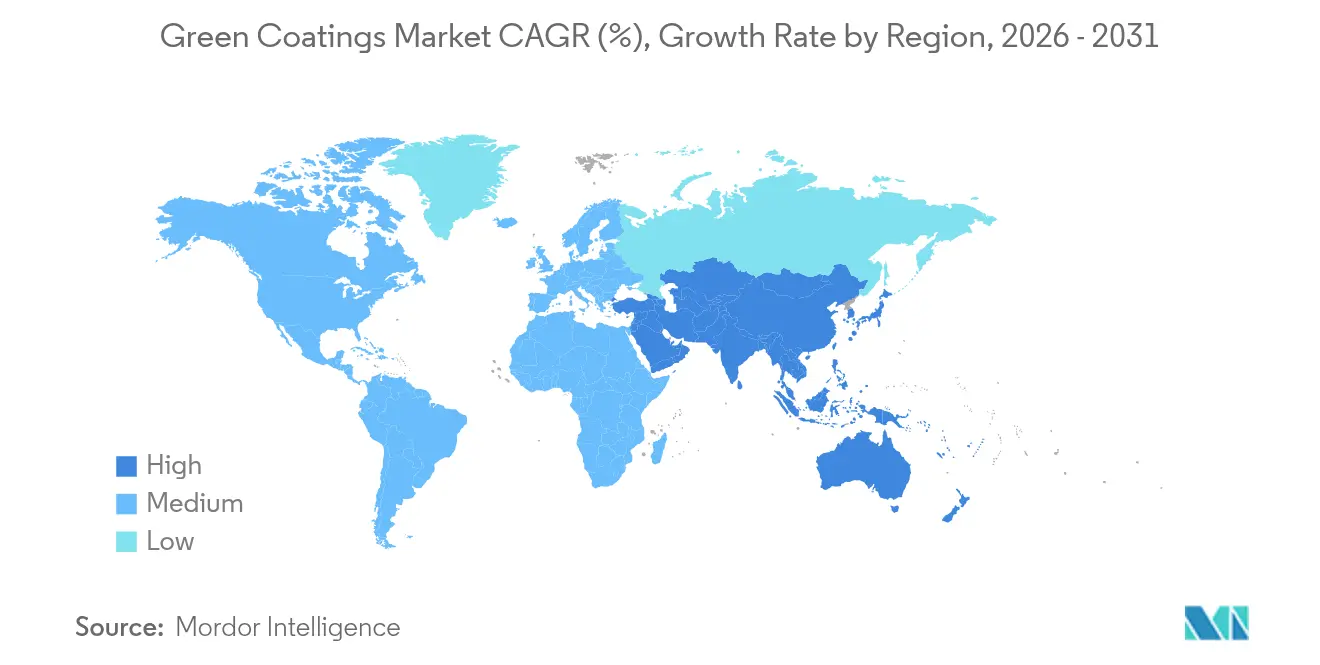
Asia-Pacific confirmed its dominance with 43.68% of 2025 revenue while charting the fastest 5.42% CAGR through 2031. Indonesian output surpassed 1 million tons in 2024, with waterborne decorative paints taking a striking 67% share of local production. The region’s green coating market is further stimulated by China’s express-packaging law GB 43352-2023 that forces e-commerce warehouses to switch to compliant coatings. India’s move to tighten food-container rules under the Food Safety and Standards Authority (FSSAI) also underpins demand. Continued urbanization, automotive build-outs, and foreign direct investment into OEM paint shops present long-run momentum.
North America Green Coatings Market
North America enjoys a resilient path powered by California’s VOC benchmarks and robust residential repaint cycles. General Motors’ three-wet technique underscores the competitive edge of low-energy lines, and multiple Tier 1 suppliers pivot to water-borne primers that simplify color changeover. Canada mirrors this progress through appliance manufacturers investing in powder booths, whereas Mexico’s coil-coating capacity staking USD 3.6 million in upgrades provides the region a cost-efficient supply hub.
Europe Green Coatings Market
Europe remains a heavyweight courtesy of sweeping PFAS restrictions and carbon-border considerations that motivate rapid reformulation. Member states impose antidumping duties on high-solvent titanium dioxide imports, indirectly steering formulators toward lower-solids or water-borne routes that require less pigment. Germany and France continue to incubate bio-based resin start-ups, fostering technical collaborations with existing conglomerates.
South America and MEA Green Coatings Market
Emerging geographies in South America, the Middle East, and Africa post moderate yet accelerating uptake. Brazil’s industrial output and Saudi Arabia’s Vision 2030 mega-projects heighten the relevance of sustainable coatings in protective steelwork and decorative lines. However, fragmented regulatory enforcement and limited access to renewable feedstocks temper pace in several local markets.
Regulatory Landscape
VOC control and chemical-substance restrictions continue to shape green coating formulations across major regions. In the United States, federal VOC compliance for coatings runs under EPA frameworks, including the January 2025 final amendments to the National VOC Emission Standards for Aerosol Coatings, while states such as California impose additional, application-specific tightening (for example, South Coast AQMD Rule 1151 phases in lower VOC limits for automotive refinish beginning May 2025 and steps down further through 2033). These requirements are pushing demand toward water-borne, high-solids, UV-cured, and powder systems that can meet performance needs within lower-VOC formulation windows.
In Europe, the regulatory agenda is increasingly influenced by product ecolabel criteria and targeted substance restrictions. The European Commission updated EU Ecolabel criteria for paints and varnishes in February 2026, with validity through December 31, 2032, lifting the bar on VOC/SVOC and indoor air-related thresholds for decorative coatings used in green-building and public procurement channels. At the same time, the EU advanced its chemicals policy in 2026, including publication of new REACH Annex XVII restrictions covering specific solvents and additives used in industrial coatings, which supports reformulation toward safer chemistries and accelerates substitution work on legacy ingredients in performance coatings.
Value Chain Analysis
The green coatings value chain begins with upstream feedstocks and intermediates (petrochemical and bio-based monomers, additives, pigments, and recycled-content inputs such as rPET and chemically recycled streams). It then moves through resin producers and compounders, coating formulators, and application equipment suppliers, before reaching OEM and contractor end users across architectural, automotive, industrial, wood, packaging, and marine uses. Regulatory and ecolabel compliance requirements increasingly affect raw-material selection and documentation. EU Decision 2025/2607 for EU Ecolabel paints criteria and Green Seal GS-11 (Edition 4.1, updated March 2025) tighten constraints on VOC and hazardous constituents and push suppliers to offer verified low-emission, PFAS-free, and circular-content options.
Midstream integration and collaboration are also being used to secure compliant inputs and reduce carbon footprints in binders and finished coatings. BASF and Cromology commercializing an interior wall paint using chemically recycled feedstocks derived from end-of-life tires (May 2026) illustrates this approach, along with consortia work on new bio-based binders (for instance, Circolide, AkzoNobel, and the University of Groningen supported by regional funding in March 2026). Downstream, large end-user programs in automotive and marine shape specifications and volumes, with long-term supply agreements and performance validation cycles favoring formulators that can combine low-VOC performance with traceable circular or bio-based inputs at scale.
Competitive Landscape
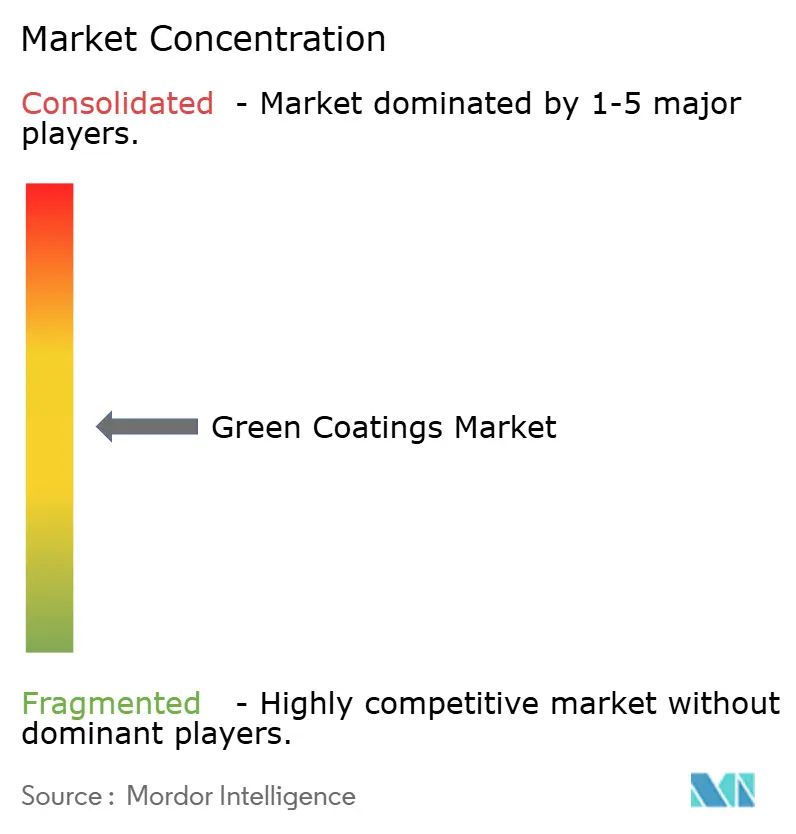
The green coatings market exhibits moderate fragmentation. PPG’s USD 550 million carve-out of its non-core architectural line was followed by Nippon Paint’s USD 2.3 billion purchase of AOC, signaling an appetite for assets that strengthen sustainable offerings. ALTANA’s investment in Finnish fire-retardant specialist NORDTREAT underscores the strategic value of bio-based additives.
Technological leadership focuses on one-coat direct-to-metal water-borne solutions, self-healing topcoats, and microwave-curable powders that cut curing cycles to under 90 seconds. Firms with integrated resin-to-colorant chains wield better control over feedstock security, critical as bio-based monomers still face supply and price volatility.
Digital tools accelerate innovation, from high-throughput formulation platforms that screen thousands of resin-pigment combinations to AI-enabled in-line color monitoring that reduces rework. Cost leadership alone no longer suffices; customers evaluate lifecycle emissions, recycled content rates, and energy savings across the coating’s use phase.
Green Coatings Industry Leaders
-
AkzoNobel N.V.
-
The Sherwin Williams Company
-
PPG Industries Inc.
-
Axalta Coating Systems, LLC
-
BASF
- *Disclaimer: Major Players sorted in no particular order
Green Coatings Market Companies Covered in this Report
- AkzoNobel N.V.
- Arkema
- Asian Paints Ltd.
- Axalta Coating Systems, LLC
- BASF
- Beckers Group
- Berger Paints India Ltd.
- DAW SE
- Eastman Chemical Company
- Evonik Industries AG
- Hempel A/S
- Jotun
- Kansai Paint Co., Ltd.
- Nippon Paint Holdings Co., Ltd.
- PPG Industries Inc.
- RPM International Inc.
- Sika AG
- The Sherwin-Williams Company
Market Opportunities and Future Outlook
Packaging and architectural coatings offer opportunities for greener binders and barrier systems as regulatory and voluntary criteria move beyond VOC into broader chemical content and circularity. The EU Ecolabel update (February 2026, valid through 2032) raises the compliance bar for decorative paints and varnishes used in green-building and procurement channels, while EU substance restrictions under REACH continue to intensify demand for reformulated industrial coating packages. This supports suppliers with proven low-VOC dispersions, PFAS-free additives, and bio-attributed or recycled-content resin platforms that can be qualified across multiple end uses.
Asia-Pacific capacity build-out and localization of raw-material supply are also near-term levers for expanding green coating adoption in high-volume segments such as architectural and automotive. BASF expanded resin capacity in Shanghai in March 2025 and advanced additional dispersions investments, including starting a low-VOC, low-CO2 dispersions line in Dilovasi, Turkiye (October 2025) and announcing a new dispersions production line at Mangalore, India (February 2026) for construction and architectural demand. Other scaling investments and partnerships, such as the Berger-Beckers joint venture commissioning a new resin facility in Nagpur, India (May 2026), and Allnex announcing a sag control agent plant in Rayong, Thailand (July 2026), also point to continued expansion in additives and binder infrastructure needed to scale water-borne and other green chemistries in the region.
Recent Industry Developments in Green Coatings Market
- June 2026: Sherwin-Williams entered a long-term strategic partnership with Do it Best Group focused on independent retail paint categories, including Sherwin-Williams assuming manufacturing of the EasyCare and Best Look brands. The move strengthens downstream access and private-label supply in a channel where low-VOC and sustainability claims increasingly influence SKU selection and shelf space.
- May 2025: PPG launched PPG ENVIROLUXE Plus powder coatings featuring up to 18% post-industrial recycled PET and formulated without PFAS. The product expands circular-content options in powder while addressing chemical-content screening that is tightening in packaging-adjacent and building-focused specifications.
- December 2024: PPG completed the sale of its U.S. and Canada architectural coatings business to American Industrial Partners for USD 550 million. The divestment sharpened PPG's portfolio focus and capital allocation toward higher-value coatings segments and sustainability-led technology platforms.
Green Coatings Market Report Scope and Research Methodology
Market Definition and Coverage
For this study, the green coatings market is defined as coating products and systems sold for protective or decorative purposes where the formulation reduces environmental impact, mainly by lowering VOC emissions or enabling solvent reduction, while still meeting typical performance needs.
Scope exclusions: Excludes upstream raw materials sold as standalone chemicals and also excludes surface-prep services that are not part of a coating sale.
Segments Covered in This Report
- By Type
- Water-borne
- Powder
- High-solids
- UV-cured coatings
- By Application
- Architectural Coatings
- Industrial Coatings
- Automotive Coatings
- Wood Coatings
- Packaging Coatings
- Other Applications (Electronics and Electrical Coatings, etc.)
- By Geography
- Asia-Pacific
- China
- India
- Japan
- South Korea
- Rest of Asia-Pacific
- North America
- United States
- Canada
- Mexico
- Europe
- Germany
- United Kingdom
- France
- Italy
- Rest of Europe
- South America
- Brazil
- Argentina
- Rest of South America
- Middle East and Africa
- Saudi Arabia
- South Africa
- Rest of Middle East and Africa
- Asia-Pacific
Data Sources, Market Sizing, and Validation
Desk Research
Desk research is used to set the factual base for our model so the numbers can be rebuilt and checked by year and region. We mainly rely on public sources such as the US EPA and related state air-quality agencies for VOC rules, the European Chemicals Agency for restriction updates that can impact formulations, and agencies such as the US Census Bureau and Eurostat for construction and manufacturing indicators.
We also review trade and industry sources such as UN Comtrade for coatings-related trade flows (as directional signals), along with peer reviewed papers and patent databases to track shifts in waterborne, powder, UV-cured, and high-solids technologies. Company filings, investor decks, and press releases are used to validate capacity additions, product mix shifts, and end-market exposure, supported by a paid subscription for company financials and a paid patent database where it helps fill gaps. These are illustrative sources, and many other public references were also used for data collection, validation, and clarification.
Primary Interviews and Surveys
Primary work focused on interviews and short surveys with coating formulators, resin and additive suppliers, distributors, and large end users across key demand centers. Since this is a global market, inputs were cross-checked across APAC, EMEA, and the Americas to confirm adoption timing, price movement patterns, and what is realistically counted as green in each use case.
Distribution of primary research fieldwork respondents
| Company type | Respondent position | Region |
|---|---|---|
| Top tier: 35% | CXOs: 18% | APAC: 42% |
| Mid tier: 43% | Functional/Unit leaders: 28% | EMEA: 32% |
| Smaller Players: 22% | Managers: 54% | Americas: 26% |
Market-Sizing & Forecasting
Sizing starts with a top-down build where coatings demand is reconstructed from end-use activity and technology penetration, and then translated into value using regional price bands. To keep it practical, totals are corroborated with selective bottom-up checks, such as sampled volume by application multiplied by typical selling prices, and distributor channel feedback on mix shifts.
Key inputs used in the model include the share shift toward waterborne and powder technologies, VOC regulation tightening schedules, construction output and housing starts for architectural demand, automotive and industrial production trends, and observed raw-material and energy cost pass-through that influences coating pricing. Where direct visibility is weaker, gaps are handled by using proxy indicators (for example, adjacent coatings consumption trends) and then tightening the range through interview feedback.
Forecasting is carried out using scenario analysis supported by multivariate regression on the most stable demand drivers, followed by expert-led adjustments for step changes like regulation deadlines or rapid substitution events. Assumptions are kept explicit by region so clients can see which variables move the forecast most.
Data Validation & Update Cycle
Validation is done through multiple checks so the final value is not driven by one single data stream. Model outputs are compared against independent signals like technology adoption commentary, regional construction and manufacturing cycles, and price movement narratives from the supply chain, and then variance flags are reviewed before sign-off.
When a number looks off, analysts re-check unit conversions, currency timing, and whether an application was double counted across technology buckets, and then we re-contact sources if the gap stays material. The report is refreshed each year, and interim updates are made when major regulation changes, sharp feedstock price shifts, or clear demand shocks occur. Before delivery, a final analyst pass is completed so the view reflects the latest available information.
Mordor Intelligence's Green Coatings Market Size Compared With Other Published Estimates
Published market values for green coatings can still look far apart because authors use different definitions of what qualifies as green, and they do not always treat pricing and regional conversions the same way. Differences also show up when one study blends broader paints and coatings value into the total, or when forecast years and base years are not aligned.
Raw-material categories like standalone bio-based resins sit outside Mordor Intelligence's scope, which keeps the estimate anchored on finished coating demand rather than upstream chemistry revenue. The remaining spread usually comes from whether low-VOC is counted only when it meets common regulatory thresholds, how fast average selling prices are assumed to rise by region, and whether older base-year values are carried forward without a fresh reality check from industry interviews.
Benchmark comparison
| Source | Market Size | Gaps in Research Methodology |
|---|---|---|
| Mordor Intelligence | USD 153.14 B (2026) | |
| Global Consultancy A | USD 137.43 B (2025) | Uses a different base year and time window, and the definition appears to be broader on what is labeled green, which can shift the starting value and CAGR when carried into later years. |
| Industry Publisher B | USD 115.19 B (2016) | Anchored on an older base year with a shorter forecast horizon, and the value seems tied to historical volumes and earlier technology shares, which can understate later adoption and price progression. |
Overall, the spread is mainly explained by year alignment and what gets counted as in-scope revenue, especially upstream materials versus finished coatings sold into end uses. By tying the model to clear demand drivers and then pressure-testing it with channel and end-user feedback, our total stays traceable to assumptions that can be revisited as new regulations and pricing conditions emerge.
Key Questions Answered in the Report
What is the current Green Coatings Market size?
The green coating market is valued at USD 153.14 billion in 2026 and is projected to reach USD 191.39 billion by 2031.
Which segment leads in revenue within the green coating market?
Water-based coatings dominate with 54.62% of 2025 revenue.
Which application is growing fastest?
Packaging coatings record the highest CAGR at 6.1% through 2031.
Why is Asia-Pacific pivotal for growth?
The region commands 43.68% of revenue and benefits from stringent regulations and manufacturing expansion, enabling a 5.42% CAGR.