
Green Cement Market Size and Share
Market Overview
| Study Period | 2020 - 2031 |
|---|---|
| Market Size (2026) | USD 35.1 Billion |
| Market Size (2031) | USD 49.46 Billion |
| Growth Rate (2026 - 2031) | 7.10 % |
| Fastest Growing Market | Asia Pacific |
| Largest Market | North America |
| Market Concentration | Medium |
Major Players *Disclaimer: Major Players sorted in no particular order Image © Mordor Intelligence. Reuse requires attribution under CC BY 4.0. | |
Green Cement Market Analysis by Mordor Intelligence
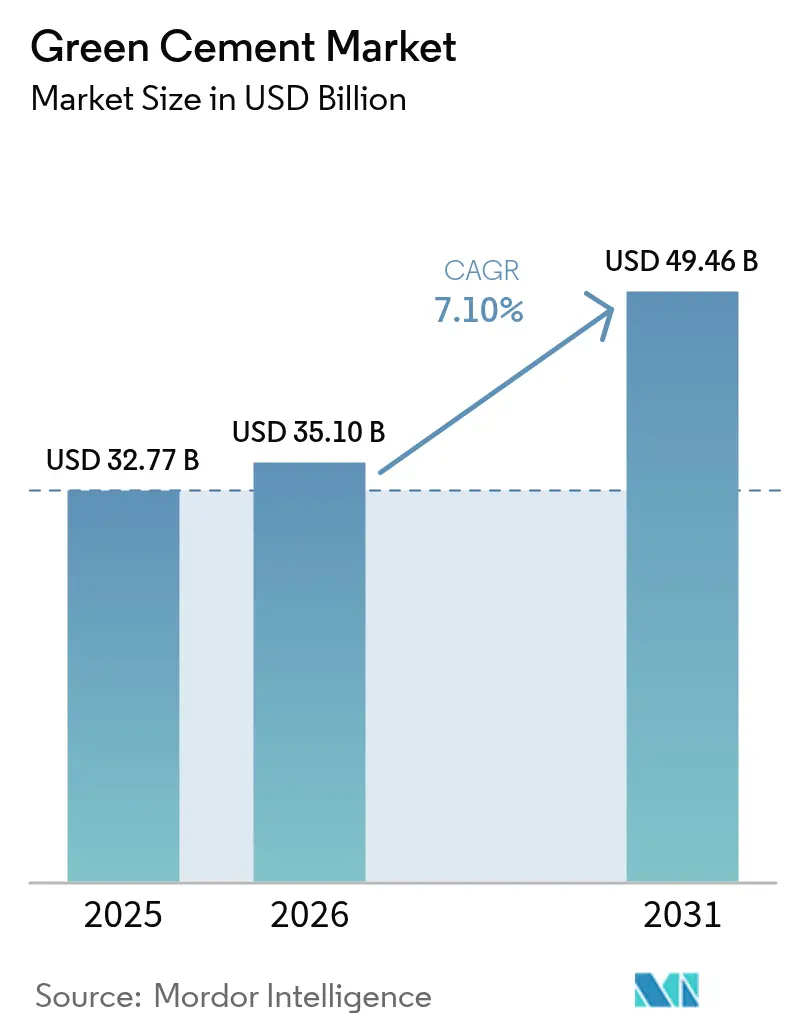
The Green Cement market size is expected to grow from USD 32.77 billion in 2025 to USD 35.1 billion in 2026 and is forecast to reach USD 49.46 billion by 2031 at 7.1% CAGR over 2026-2031. Regulatory mandates, rising carbon prices, and procurement rules that favor low-carbon materials move the green cement market from niche status to mainstream selection in public and private projects. Fly-ash-based formulations command the largest revenue share, while infrastructure spending and ESG-linked financing accelerate uptake across non-residential works. Asia-Pacific provides the fastest growth, whereas North America retains volume leadership because of early policy adoption and mature supply chains. Competitive intensity stays moderate as incumbent cement majors scale green portfolios and specialized producers leverage secured feedstock contracts.
Key Report Takeaways
- By product type, fly-ash-based cement led with 43.55% of the green cement market share in 2025, and is projected to expand at a 7.62% CAGR through 2031.
- By construction sector, non-residential works accounted for 57.80% of the green cement market size in 2025 and are forecast to advance at an 8.15% CAGR to 2031.
- By geography, North America held 37.55% revenue share of the green cement market in 2025; Asia-Pacific is set to register the fastest regional CAGR at 7.94% during 2026-2031.
Note: Market size and forecast figures in this report are generated using Mordor Intelligence’s proprietary estimation framework, updated with the latest available data and insights as of 2026.
Global Green Cement Market Trends and Insights
Drivers Impact Analysis*
| Driver | (~) % Impact on CAGR Forecast | Geographic Relevance | Impact Timeline |
|---|---|---|---|
| Global decarbonisation mandates & ESG-centric building codes | +2.10% | Global, led by EU & North America | Medium term (2-4 years) |
| Rising carbon pricing & emissions-trading schemes | +1.80% | EU, California, select APAC markets | Long term (≥ 4 years) |
| APAC urbanisation surge requiring low-carbon materials | +1.50% | APAC core, spill-over to MEA | Short term (≤ 2 years) |
| Abundant SCM feedstocks (fly-ash, slag) lowering costs | +1.20% | Coal-heavy regions worldwide | Medium term (2-4 years) |
| Commercialisation of hydrogen-fuelled kilns | +0.90% | EU, select North American plants | Long term (≥ 4 years) |
| Source: Mordor Intelligence | |||
Global Decarbonization Mandates & ESG-Centric Building Codes
Mandatory low-carbon procurement policies drive immediate demand shifts from ordinary Portland cement to verified green formulations. California targets a 40% emissions cut for its cement sector by 2035 and net-zero by 2045, anchoring similar actions in other U.S. states[1]. The EU’s revised Construction Products Regulation obliges digital passports and CO₂ disclosure for concrete from 2024, pushing producers already equipped with life-cycle documentation to the front of tender lists. France, Denmark, Ireland, and New York State have each introduced progressive emissions ceilings or Buy Clean rules that make compliant materials the default choice rather than a premium option. As jurisdictions replicate pioneering statutes, the green cement market gains a policy-driven growth floor that traditional producers can meet only by retrofitting kilns or partnering with specialized suppliers.
Rising Carbon Pricing & Emissions-Trading Schemes
Carbon costs alter clinker economics by turning CO₂ into a direct expense. The EU Emission Trading System gradually withholds free allowances, prompting cement manufacturers to accelerate low-carbon substitutions or risk margin compression. China’s national trading platform now covers cement, expanding cost pressure to the world’s largest producer. As more regions price carbon, supplementary cementitious materials gain relative competitiveness, and the green cement market benefits from a structural cost advantage over legacy products.
APAC Urbanization Surge Requiring Low-Carbon Materials
India’s accelerating infrastructure buildout contrasts with China’s moderated real-estate cycle, yet both markets enforce stricter environmental rules that raise demand for low-carbon binders. Regional utilities, transport authorities, and private developers incorporate sustainability clauses that specify green cement in designs for metro lines, data centers, and renewable-energy foundations. With APAC electricity generation having risen 16.5-fold between 1971 and 2018, the construction sector remains under pressure to decarbonize quickly—even as concrete volumes grow[2].
Abundant SCM Feedstocks Lowering Costs
Fly ash continues to dominate as a supplementary cementitious material, representing nearly 90% of global pozzolan use and helping green cement achieve price parity in many regions. Harvested ash from legacy ponds—now 10% of recycled volumes in the United States—extends supply life even as coal closures mount. Concurrently, steel-slag supply faces uncertainty due to electric arc furnace adoption, directing producers to sign long-term contracts or acquire processing assets, as seen in Heidelberg Materials’ purchase of The SEFA Group.
Restraints Impact Analysis*
| Restraint | (~) % Impact on CAGR Forecast | Geographic Relevance | Impact Timeline |
|---|---|---|---|
| Performance scepticism among builders & contractors | -1.40% | Global, acute in emerging markets | Short term (≤ 2 years) |
| Fragmented standards in emerging markets | -0.80% | APAC, MEA, Latin America | Medium term (2-4 years) |
| Shrinking slag supply as steel shifts to EAF/DRI | -1.10% | Steel-producing regions worldwide | Long term (≥ 4 years) |
| Source: Mordor Intelligence | |||
Performance Scepticism Among Builders & Contractors
Some contractors resist specification changes, citing extended curing, cold-weather set delays, and inconsistent regional availability of supplementary materials. Standards bodies work to replace prescriptive mix limits with performance-based guidelines, yet knowledge gaps persist, especially in small and mid-size firms. Demonstration projects and targeted training remain essential for mainstream adoption.
Fragmented Standards in Emerging Markets
Divergent definitions of “green cement” across national codes complicate compliance for multinationals and inflate testing costs. Regulators in Asia, the Middle East, and Latin America advance at uneven paces, which slows cross-border project execution and supply consolidation. Technical assistance programs and regional alignment initiatives aim to unify standards over the medium term.
*Our forecasts treat driver/restraint impacts as directional, not additive. The impact forecasts reflect baseline growth, mix effects, and variable interactions.
Segment Analysis
By Product Type: Fly-Ash Dominance Faces Supply Constraints
Fly-ash-based formulations kept a 43.55% green cement market share in 2025, underscoring their status as the default low-carbon substitute where coal-combustion residues remain abundant. Producers leverage mature logistics and well-documented performance to serve large infrastructure contracts and government tenders. However, declining coal generation narrows future feedstock pools, prompting companies to harvest legacy ash ponds or shift toward limestone-calcined clay blends. LC3 technology, able to trim emissions by up to 40%, gains visibility as laboratories validate mechanical parity with ordinary Portland cement. Silica-fume-based variants occupy high-specification niches, delivering impermeable concrete suited to marine and chemical containment structures. Slag-based alternatives struggle with impending supply shifts but retain relevance near integrated steelworks. Novel binder chemistries, including geopolymer concretes, progress through pilot projects that could diversify the green cement market if scale economics improve.
Growing diversification reduces over-reliance on any single supplementary stream and insulates producers from raw-material shocks. With harvested ash constituting 10% of recycled U.S. fly ash, supply security improves, yet processing costs rise. Strategic agreements between cement makers and utility coal-ash reclamation entities therefore feature prominently in recent deal flow. Slag-grinding partnerships and clay-calcination joint ventures become equally critical as companies balance technical feasibility, emissions objectives, and raw-material economics.


By Construction Sector: Infrastructure Drives Non-Residential Leadership
Non-residential projects held 57.80% of 2025 revenues and will advance at an 8.15% CAGR through 2031, reflecting policy-backed spending on transport corridors, grid upgrades, and public buildings that now specify verified low-carbon mixes. Procurement documents increasingly mandate third-party environmental product declarations, giving compliant producers a clear channel to recurring work. Commercial real-estate developers also integrate green cement into core-and-shell scopes to secure sustainability certifications that attract institutional investors.
Residential uptake grows more gradually. Although mortgage-rate declines in 2025 could lift housing starts, cost-sensitive builders remain cautious about adopting unfamiliar binders without scheduling assurances. Trials in Egypt show potential 44.5% CO₂ savings in non-structural blocks using modified green formulations. As building codes tighten and consumer awareness rises, the segment should close adoption gaps, yet near-term growth continues to lean on large civil works where public procurement dictates material choices.

Geography Analysis
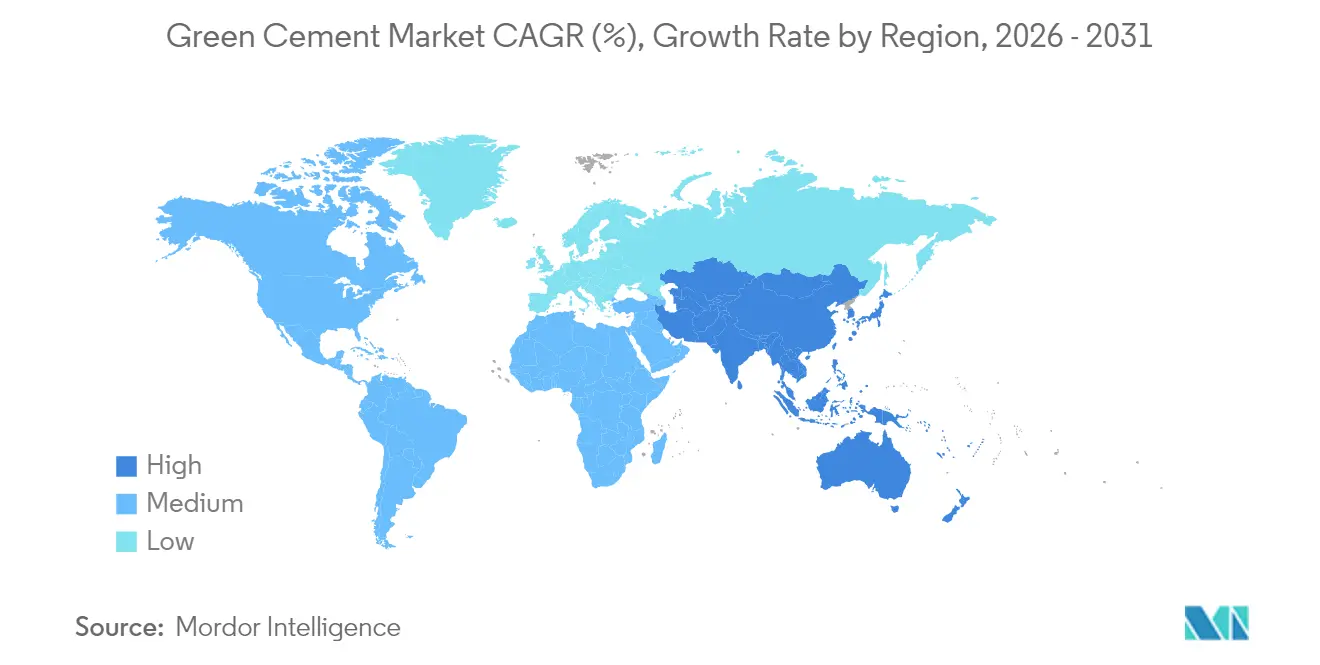
North America retained 37.55% of 2025 revenues, anchored by federal and state Buy Clean rules, early carbon-capture pilots, and high contractor familiarity with blended cements. Heidelberg Materials’ Mitchell CCS project alone targets geological storage for more than 50 million t of CO₂ over 30 years, signaling infrastructure that can underpin long-run volume commitments. Supply availability differs by region: Midwest states leverage proximity to coal-ash basins, while coastal areas import slag or calcined clay to meet specifications.
Asia-Pacific registers the fastest 7.94% CAGR to 2031, fueled by India’s multi-year infrastructure pipeline and progressively stricter codes across Southeast Asia. China’s consolidation efforts prompt large groups to upgrade plants with low-carbon lines to retain permits amid property-sector headwinds. Two-thirds of global high-speed rail networks reside in the region, requiring concrete that satisfies tightening emissions caps and boon the green cement market as projects replenish track and station stock.
Europe blends robust climate policy with mature industrial capabilities. Ireland’s 2024 mandate for low-carbon cement in all state projects and Denmark’s 2025 emissions ceiling of 7.1 kg CO₂e/m²/year set influential benchmarks. Carbon pricing ensures that the green cement market size expands despite construction-volume volatility, as CO₂ costs tilt bid evaluations toward low-clinker mixes. The Middle East and Africa witness emerging demand, especially in Gulf economies planning hydrogen hubs and large-scale public works, yet fragmented standards and limited on-site expertise slow penetration until harmonized guidelines mature.
Mordor Intelligence provides coverage of the green cement market across other key regional markets, including Middle East, Africa, Europe, Asia, and North America, each with their regulatory frameworks and demand patterns.
Regulatory Landscape
Low-carbon cement policy is moving from voluntary disclosure toward mandatory reporting, procurement thresholds, and border measures. In the European Union, the Carbon Border Adjustment Mechanism (CBAM) enters its definitive phase on January 1, 2026, tightening emissions accountability for imported cement as embedded emissions coverage scales during 2026-2033 alongside the phase-out of free EU ETS allocations. On the procurement side, the United States is operationalizing Buy Clean style requirements through federal purchasing, with the U.S. General Services Administration (GSA) specifying global warming potential (GWP) limits for low-embodied-carbon cement (Top 20%: 751 kgCO2e/t, Top 40%: 819 kgCO2e/t, better-than-average: 858 kgCO2e/t), translating EPD data into pass-fail eligibility in public tenders.
Standards harmonization is also becoming a market access gate. The U.S. Environmental Protection Agency (EPA) finalized Product Category Rule (PCR) criteria for construction materials aligned to ISO/TS 14027:2017, with conformance required from January 1, 2026, strengthening the comparability of EPDs used in procurement and specification. International initiatives such as the Cement and Concrete Breakthrough are working on common definitions and interoperability for emissions measurement toward COP30, reinforcing a shift to performance-based carbon metrics that favors producers with auditable life-cycle documentation and verified low-clinker pathways.
Value Chain Analysis
The green cement value chain begins with sourcing and processing supplementary cementitious materials (SCMs) and alternative binders, including fly ash (including reclaimed ash), slag, calcined clay, silica fume, and novel chemistries. Feedstock security and preprocessing (classification, grinding, activation, and quality assurance) shape commercial outcomes, particularly because fly ash dominates current formulations while slag availability faces structural pressure from steel decarbonization shifts. As upstream constraints tighten, upstream technology and input providers sit alongside traditional raw material suppliers, with calcined-clay supply scaling (for LC3-type blends) and other process innovations such as electrified clinker production or electrochemical limestone splitting adding specialized equipment, engineering, and validation partners to the chain.
Midstream manufacturing includes blending and grinding for SCM-heavy products, along with deeper process changes in integrated plants, including alternative fuels, electrification pilots, and carbon capture integration. Partnerships show how OEMs and technology firms are shaping plant-level decarbonization pathways: Air Liquide and Holcim agreed to develop carbon capture at Holcim's Obourg plant in Belgium (targeting 1.1 million tons of CO2 capture per year), while Ambuja Cements partnered with Leilac to advance a commercial-scale low-carbon pathway at the Sanghipuram (Sanghi) plant in Gujarat. Downstream, distribution moves through ready-mix and precast networks and public procurement channels that increasingly require verified EPDs, with contractor and specifier acceptance supported by demonstrations such as Holcim, Paebbl, and Goldbeck executing a first commercial-scale application of Paebbl Rebond carbon-storing SCM in South Germany, linking product performance proof to site-level adoption.
Competitive Landscape
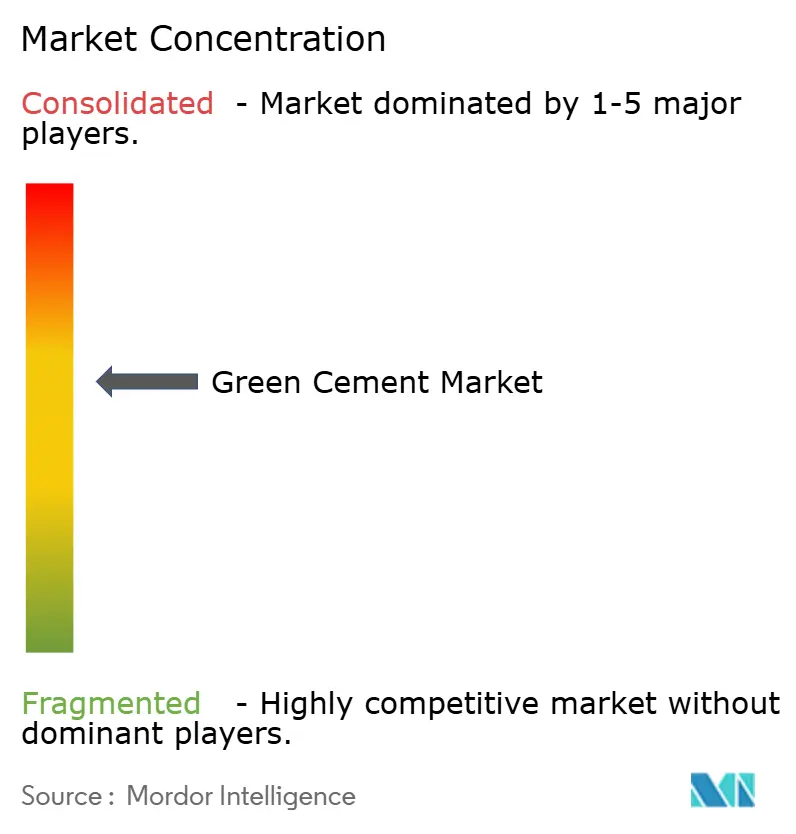
The green cement market exhibits moderately consolidated concentration. Holcim, Heidelberg Materials, and Cemex exploit integrated logistics and brand recognition while retrofitting kilns for alternative fuels and carbon capture. CarbonCure pursue differentiated chemistries that circumvent clinker altogether, targeting early adopters seeking greater emissions cuts than blended cements offer.
M&A activity concentrates on feedstock control and technology access. Heidelberg Materials’ takeover of fly-ash recycler The SEFA Group secures consistent pozzolan supply along the U.S. Eastern Seaboard. Cemex’s minority stakes in KC8 Capture Technologies and HiiROC provide in-house pilots for solid-carbon capture and hydrogen production. Vertical integration into ash harvesting, clay calcination, and renewable-power procurement strengthens margin resilience as carbon costs rise.
Strategic collaboration emerges through the Global Cement and Concrete Association’s Green Cement Technology Tracker, which now monitors calcined-clay kiln roll-outs to facilitate knowledge sharing. Producers co-invest in R&D to de-risk novel binders and jointly lobby for performance-based codes. The resulting ecosystem encourages portfolio differentiation while maintaining baseline interoperability for global contractors—an environment in which the green cement market can scale without compromising structural performance requirements.
Green Cement Industry Leaders
-
Cemex S.A.B DE C.V.
-
Heidelberg Materials
-
Holcim
-
UltraTech Cement Ltd.
-
Votorantim Cimentos
- *Disclaimer: Major Players sorted in no particular order
Market Opportunities and Future Outlook
Public procurement thresholds and standardized disclosure requirements are creating whitespace for suppliers able to deliver verified, low-GWP cement at scale with consistent documentation. The U.S. GSA's low-embodied-carbon cement GWP limits turn EPD-backed compliance into a commercial differentiator, while the EU CBAM definitive phase from January 1, 2026 increases the strategic value of low-clinker and low-emissions production for importers and exporters serving Europe. This environment supports product portfolio opportunities tied to EPDs and PCR alignment, third-party verification services, and producer investments that shorten the path from plant emission data to procurement-eligible product SKUs.
Technology-driven decarbonization beyond blending is widening the addressable solution set and expanding roles for equipment providers, technology licensors, and project developers in carbon capture, electrified thermal processes, and carbon-storing materials. In 2026, multiple company actions reflect a shift from pilots toward commercial demonstrations and site deployments: Ambuja Cements' agreement with Leilac for commercial-scale carbon capture and hybrid electric heating evaluation in India, SaltX securing EU funding (CET Partnership) with Holcim and Paebbl to demonstrate electrified and circular cement production, and Holcim's commercial-scale use of Paebbl Rebond on a logistics project in Germany. Capacity and product rollout moves also indicate near-term commercialization pathways for alternative binders and low-clinker systems, including Heidelberg Materials commissioning a new dry kiln line at Airvault in France to enable higher alternative fuel use and clinker reduction, and Hoffmann Green scaling 0% clinker offerings through technology launches and licensing steps in Europe.
Recent Industry Developments
- June 2026: Hoffmann Green Cement Technologies launched H-CLAY, a cold-processing clay technology designed to support its 0% clinker cement formulations. The launch expands the set of scalable alternative raw materials available for clinker-free products, addressing supply-chain constraints that can arise from dependence on traditional SCM streams.
- May 2026: Holcim partnered with Paebbl and Goldbeck for the first commercial-scale application of Paebbl Rebond, a carbon-storing supplementary cementitious material, in a logistics center project in South Germany. The completed site use strengthens the commercial case for carbon-storing SCMs by moving beyond trials into real project execution and contractor workflows.
- September 2024: New York State updated its Buy Clean Concrete Guidelines for state entities and affected agencies under State Finance Law 136-d and Executive Order 22, setting a pathway to lower mandatory GWP limits starting January 1, 2027. The revision reinforces demand pull for EPD-backed low-carbon cement and concrete mixes, translating climate targets into enforceable procurement criteria.
Research Methodology Framework and Report Scope
Market Definition and Coverage
For this report, the market covers revenue generated from green cement sold for construction use, where the binder or blend is designed to reduce embodied carbon versus conventional cement through alternative materials and processes.
Scope exclusions: It excludes downstream concrete and mortar sales, and it also excludes carbon capture services that may be used at cement plants.
Segmentation Overview
- By Product Type
- Fly-Ash-Based
- Slag-Based
- Limestone-Based
- Silica-Fume-Based
- Other Product Types
- By Construction Sector
- Residential
- Non-Residential
- By Geography
- Asia-Pacific
- China
- India
- Japan
- South Korea
- Rest of Asia-Pacific
- North America
- United States
- Canada
- Mexico
- Europe
- Germany
- United Kingdom
- France
- Italy
- Rest of Europe
- South America
- Brazil
- Argentina
- Rest of South America
- Middle East and Africa
- Saudi Arabia
- South Africa
- Rest of Middle East and Africa
- Asia-Pacific
Data Sources, Market Sizing, and Validation
Desk Research
We start by collecting public reference points that help explain where cement demand sits and how low-carbon materials are being adopted. Key inputs are taken from sources such as the USGS for cement and clinker statistics, the International Energy Agency for CO2 and industry decarbonization pathways, and UN Comtrade for cross-border flows of cement and related inputs.
Along with that, we review technical and policy signals that change adoption speed, including publications from standards bodies such as ASTM International, selected peer-reviewed journals on supplementary cementitious materials, and national environment or building agencies for green building and procurement updates. For commercialization checks, we use company annual reports, investor presentations, association websites, and reputable press, then cross-check with paid subscriptions for company financials and intelligence. Patent databases are also reviewed to see where innovation is concentrating. These desk research sources are illustrative rather than exhaustive, and other references were used to fill gaps and validate assumptions.
Primary Interviews and Surveys
To make the model realistic, we validate assumptions through expert interviews and structured surveys across manufacturers, distributors, contractors, and project-side decision makers, and feedback is taken across APAC, EMEA, and the Americas. These conversations help resolve gaps such as typical price premiums, whether fly ash or slag availability is tightening, and how quickly specifications are shifting in real bids, which is then fed back into the sizing and forecast assumptions.
Distribution of primary research fieldwork respondents
| Company type | Respondent position | Region |
|---|---|---|
| Top tier: 37% | CXOs: 18% | APAC: 37% |
| Mid tier: 45% | Functional/Unit leaders: 22% | EMEA: 36% |
| Smaller Players: 18% | Managers: 60% | Americas: 27% |
Market-Sizing & Forecasting
Sizing begins with a top-down reconstruction of the addressable cement pool by region, where production and trade data are converted into apparent consumption and then filtered by the practical adoption share of lower-carbon cement blends. Once that view is built, we corroborate it with selective bottom-up approximations such as sampled supplier revenues, channel checks in key countries, and volume-by-ASP calculations for commonly specified green cement types.
To keep the model grounded, we track a set of market fingerprints that directly move demand and pricing, including infrastructure and building activity levels, clinker substitution rates, availability of fly ash and slag, typical blend ratios by application, and observed price premiums versus ordinary Portland cement. Where local data is missing, we handle gaps using proxy indicators such as nearby market substitution patterns and import reliance, then stress-test the outcome through expert feedback.
For forecasting, scenario analysis is used so policy strength, industrial byproduct availability, and construction cycles can be varied without overfitting the model. The final forward curve is adjusted using consensus ranges from primary discussions, particularly for ASP progression and the pace of specification changes in public and private projects.
Data Validation & Update Cycle
We validate outputs by triangulating market totals against independent signals, including cement consumption trends, major project pipelines, and observed pricing ranges, and then checking whether implied growth matches realistic capacity and supply constraints. When variances appear, we review them, isolate the drivers, and trigger follow-up outreach to confirm whether the difference is timing, scope, or a local market event.
Before sign-off, the full model is reviewed in multiple analyst passes, where calculations are rechecked and key assumptions are challenged for consistency across regions and years. Reports are refreshed annually, and interim updates are made when material events occur, followed by a final pre-delivery pass so clients receive the most current view available.
Mordor Intelligence's Green Cement Market Size Measured Against Other Published Estimates
Published market sizes for green cement often look different because each study makes its own calls on what products qualify, how quickly pricing changes are applied, and whether the totals reflect conservative or aggressive adoption curves.
The table shows a noticeable spread, and in Mordor Intelligence's model the value is counted only for green cement sales (by the defined product types) into residential and non-residential construction, which avoids mixing in downstream concrete revenue and keeps totals tied to repeatable cement demand signals.
Benchmark comparison
| Source | Market Size | Gaps in Research Methodology |
|---|---|---|
| Mordor Intelligence | USD 32.77 B (2025) | |
| Global Consultancy A | USD 43.37 B (2025) | This estimate appears to use a broader application boundary and a faster adoption curve, and it may also apply higher price uplift assumptions across infrastructure use cases, which can raise the total versus a cement-only demand pool. |
| Industry Publisher B | USD 32.80 B (2025) | The close number can still come from different building blocks, such as alternative product groupings (including geopolymer mixes) and a different treatment of regional weighting and ASP progression, which can offset each other and land near the same total. |
Overall, the comparison suggests that the biggest differences come from scope boundaries and how pricing and adoption are applied year by year. By keeping inputs traceable to cement consumption signals, substitution rates, and validated price ranges, our estimate stays easier to replicate and to update when policies, byproduct supply, or construction activity shifts.
Key Questions Answered in the Report
What is the current value of the green cement market?
The green cement market size stands at USD 35.1 billion in 2026 and is projected to grow to USD 49.46 billion by 2031.
Which product type leads the market?
Fly-ash-based formulations lead with 43.55% revenue share, supported by established supply chains and proven performance.
Which region shows the fastest growth?
Asia-Pacific records the highest forecast CAGR at 7.94%, driven by large infrastructure pipelines and tightening environmental codes.
How do carbon prices influence green cement adoption?
Rising carbon prices directly increase the cost of clinker-intensive cement, making low-carbon alternatives cost-competitive and accelerating substitution.
What are the main challenges facing the green cement industry?
Supply constraints for supplementary materials, performance skepticism among contractors, and fragmented standards in emerging markets remain key hurdles.
Which companies are the major players in this market?
Holcim, Heidelberg Materials, Cemex S.A.B DE C.V., UltraTech Cement Ltd., and Votorantim Cimentos are the major players in the green cement market.