
Green Ammonia Market Size and Share
Market Overview
| Study Period | 2021 - 2031 |
|---|---|
| Market Volume (2026) | 0.49 Million tons |
| Market Volume (2031) | 9.85 Million tons |
| Growth Rate (2026 - 2031) | 82.47 % |
| Fastest Growing Market | Europe |
| Largest Market | Europe |
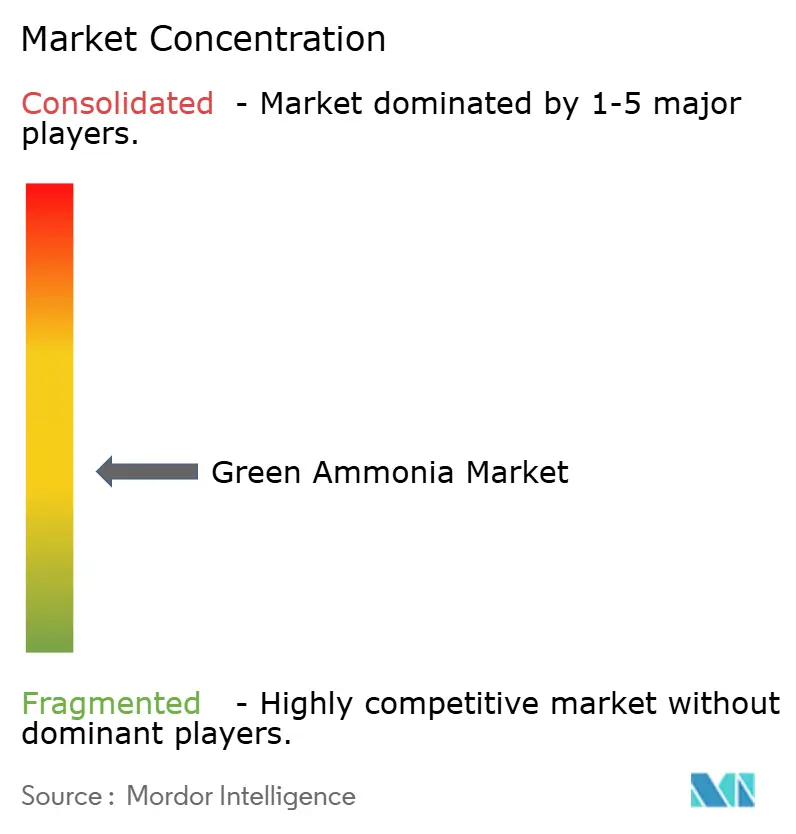
| Market Concentration | Medium |
Major Players *Disclaimer: Major Players sorted in no particular order Image © Mordor Intelligence. Reuse requires attribution under CC BY 4.0. | |
Green Ammonia Market Analysis by Mordor Intelligence
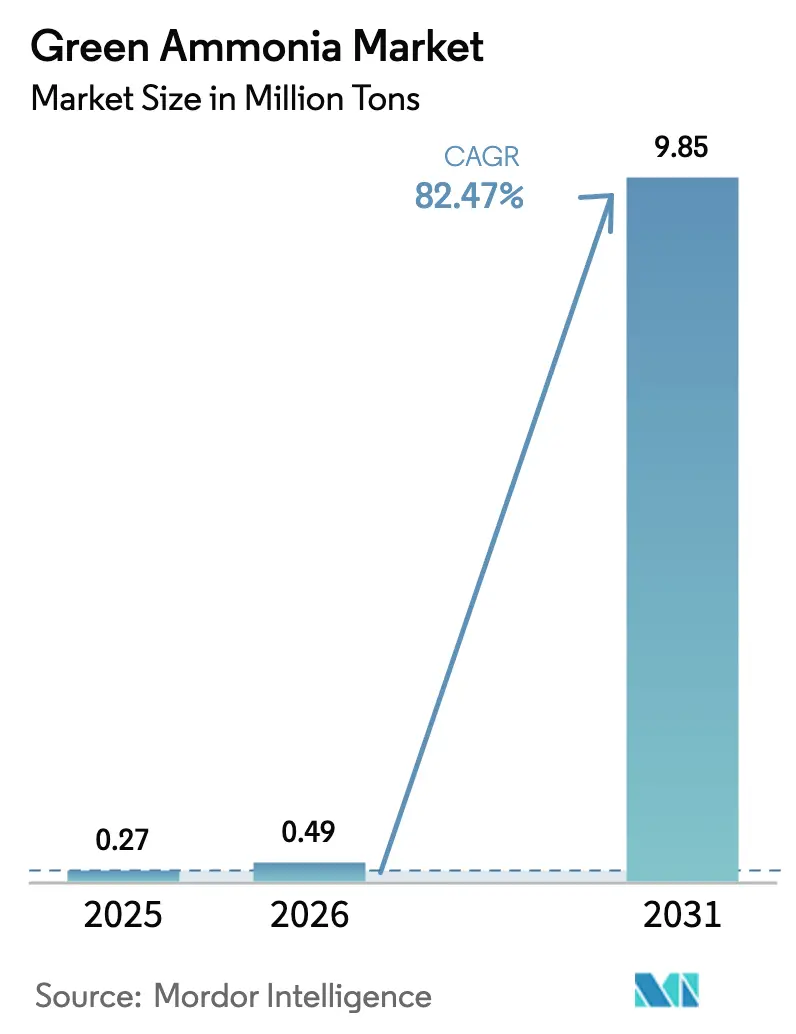
The Green Ammonia Market size is projected to expand from 0.27 million tons in 2025 and 0.49 million tons in 2026 to 9.85 million tons by 2031, registering a CAGR of 82.47% between 2026 to 2031. Europe holds the early lead because the REPowerEU plan assigns hard quotas for renewable hydrogen derivatives and underwrites long-term offtake through contracts-for-difference, shielding producers from price volatility. The industry is also benefiting from national revenue-support schemes in the United Kingdom, Germany, and Australia that guarantee price floors for electrolyzer operators, accelerating final-investment decisions in ways unseen during the first solar and wind rollouts. Additionally, the International Maritime Organization’s revised greenhouse-gas strategy forces shipowners to place orders for zero-carbon vessels this decade, creating a forward curve of demand for green bunker fuels. Power utilities in Japan and South Korea are co-firing ammonia in coal units to hit interim emissions caps without retiring baseload assets, a near-term anchor of offtake that lengthens asset lives and stabilizes regional grids.
Key Report Takeaways
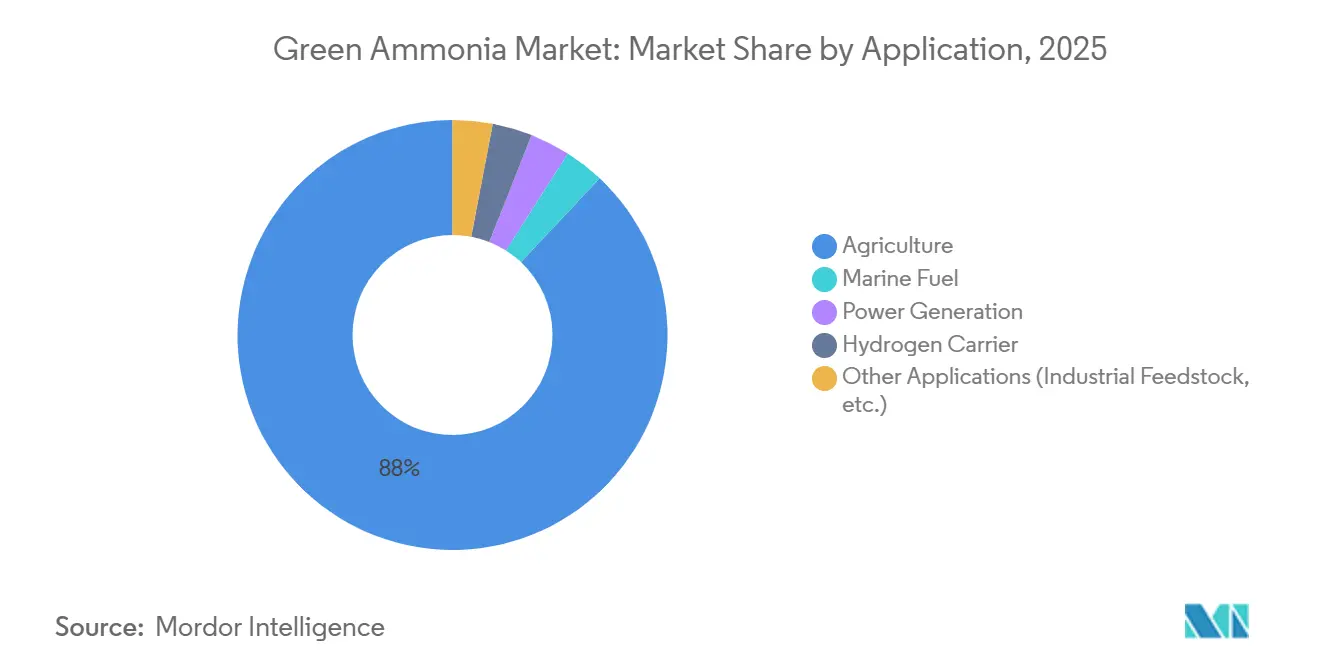
- By application, agriculture led with 87.99% of green ammonia market share in 2025 and is also the fastest-growing segment at an 85.67% CAGR through 2031.
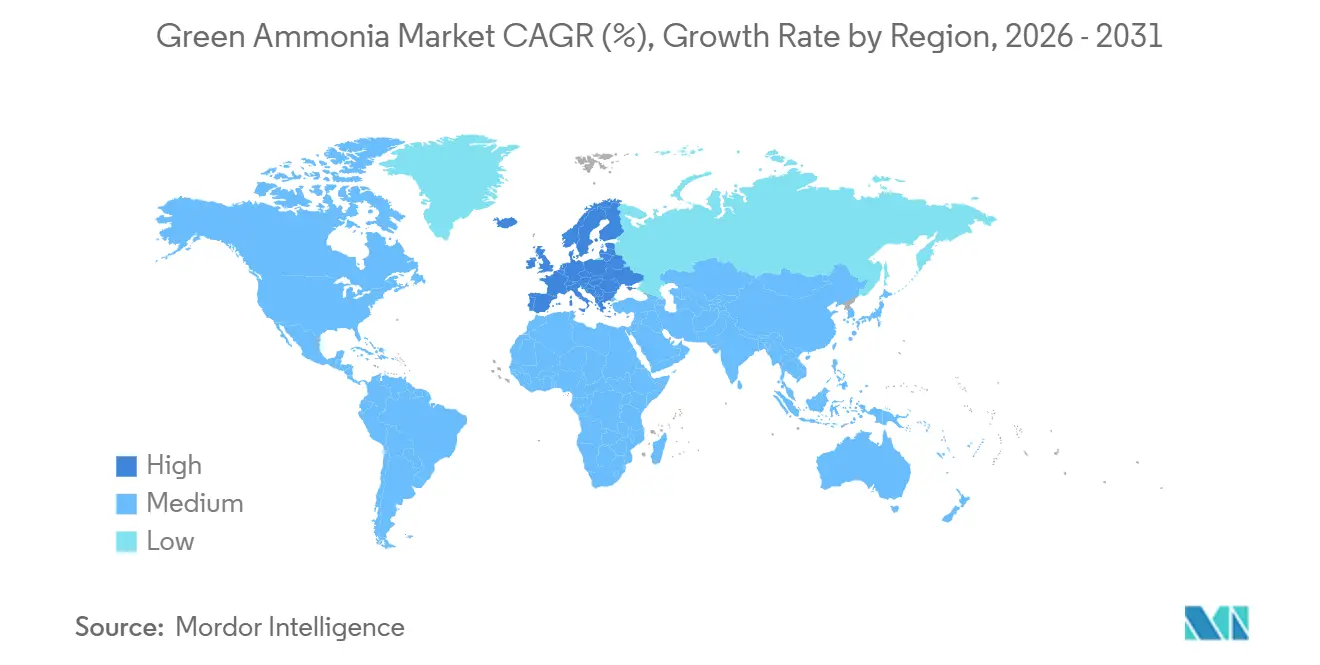
- By geography, Europe held 35.91% of the green ammonia market share in 2025 while advancing at an 87.20% CAGR to 2031.
Note: Market size and forecast figures in this report are generated using Mordor Intelligence’s proprietary estimation framework, updated with the latest available data and insights as of 2026.
Market Trends and Insights
Drivers Impact Analysis of Green Ammonia Market*
| Driver | (~) % Impact on CAGR Forecast | Geographic Relevance | Impact Timeline |
|---|---|---|---|
| Rising fertilizer demand from food-insecure nations | +18.5% | Sub-Saharan Africa, South Asia, Middle East export corridors | Medium term (2-4 years) |
| Decarbonization policies accelerating green fuels in shipping | +22.3% | Europe, Asia-Pacific, North America West Coast | Long term (≥ 4 years) |
| Growing demand for green ammonia as a hydrogen carrier | +14.7% | Global, early adoption in Germany, Japan, Australia | Medium term (2-4 years) |
| Increasing usage in power generation and grid stability | +16.2% | Asia-Pacific, Europe | Short term (≤ 2 years) |
| National clean-hydrogen CFD auctions guaranteeing long-term offtake | +10.8% | United Kingdom, Germany, Netherlands, Australia | Short term (≤ 2 years) |
| Source: Mordor Intelligence | |||
Rising Fertilizer Demand From Food-Insecure Nations
Nitrogen-fertilizer imports in Sub-Saharan Africa climbed past 6.5 million tons in 2024, while domestic production remained negligible because large-scale natural-gas infrastructure is absent or economically stranded[1]. Green ammonia offers a leapfrog pathway in the Green Ammonia Market as wind resources above 9 m/s along the Atlantic and Indian Ocean coasts enable cost-competitive electrolysis. Mauritania and Namibia are negotiating decade-long supply contracts that bypass pipeline gas and ship product in ISO tanks, locking in both volume and price. India, where the fertilizer subsidy bill hit USD 24 billion in fiscal 2025, now mandates a 5% green-ammonia blend in urea production by 2027 under the National Green Hydrogen Mission. Egypt followed with a 2025 memorandum covering 1 million tons of capacity at Ain Sokhna, signaling that food-security concerns and energy-transition goals are converging across the Global South.
Decarbonization Policies Accelerating Green Fuels in Shipping
The IMO’s 2023 revision sets a well-to-wake greenhouse-gas intensity cut of 40% by 2030 versus 2008, a target unattainable with LNG or scrubber-equipped heavy fuel oil. Ammonia’s zero-carbon combustion profile positions it as the only scalable deep-sea fuel that satisfies both the 2030 and 2050 checkpoints without relying on shipboard carbon capture. MAN Energy Solutions delivered the first ammonia-ready two-stroke engine in late 2024, while DNV issued bunkering guidelines that require double-wall piping and real-time vapor detection[2]. Port authorities in Rotterdam, Singapore, and Busan are co-investing in terminals, but the absence of a unified ISO shore-to-ship safety standard fragments regulatory oversight and slows rollouts. Early mover shipowners such as Maersk have nonetheless placed multi-billion-dollar orders for ammonia-fueled containerships, banking on first-mover cost advantages once carbon levies tighten.
Growing Demand For Green Ammonia As A Hydrogen Carrier
Hydrogen’s low volumetric density and cryogenic storage requirement make intercontinental shipping uneconomic, whereas ammonia liquefies at -33 °C under ambient pressure, enabling carriage in modified LPG vessels in the Green Ammonia Market. Germany’s H2Global auction awarded long-term contracts in 2024 for imports from Canada and Australia, with cracking terminals scheduled for Hamburg and Wilhelmshaven. Japan forecasts 3 million tons of hydrogen equivalent to arrive as ammonia by 2030, supporting both power generation and industrial demand. Cracking costs of USD 150–200 per ton narrow arbitrage margins versus pipeline imports, but rising carbon prices raise the delivered value of low-emission hydrogen, improving project bankability. Early projects show that solid-oxide electrolyzer cells attain 75% round-trip efficiency, signaling technological headroom to push logistics costs lower over time.
Increasing Usage In Power Generation And Grid Stability
Coal-heavy grids in Japan and South Korea face binding emissions caps yet cannot retire baseload plants without risking blackouts. Ammonia co-firing provides a compliance bridge, with JERA’s Hekinan plant proving a 20% blend that reduces annual CO₂ by 300,000 tons while keeping full dispatch flexibility. South Korea’s mandate for 20% blending at all coal plants by 2030 will create captive demand for 2.5 million tons a year and has already triggered long-term supply deals with Middle-Eastern exporters. Nitrous-oxide emissions remain a concern, prompting selective catalytic reduction retrofits that add USD 40–60 million per gigawatt, though technology vendors report promising trials with advanced catalysts that cut N₂O formation by half. Short-term offtake visibility combined with carbon-credit revenue streams tightens investment cases for new electrolyzer capacity.
Restraints Impact Analysis of Green Ammonia Market*
| Restraint | (~) % Impact on CAGR Forecast | Geographic Relevance | Impact Timeline |
|---|---|---|---|
| High capital requirements for electrolysis & Haber-Bosch retrofits | -6.4% | Global, acute in emerging markets | Short term (≤ 2 years) |
| Safety and toxicity hurdles for maritime bunkering | -3.8% | Asia-Pacific port hubs, Europe, North America | Medium term (2-4 years) |
| Blue-ammonia price competition along subsidized CCS corridors | -2.3% | Middle East, US Gulf Coast, Russia | Long term (≥ 4 years) |
| Source: Mordor Intelligence | |||
High Capital Requirements For Electrolysis & Haber-Bosch Retrofits
Proton-exchange-membrane stacks still cost USD 850–1,100 per kilowatt in 2026, while alkaline units need larger footprints and deliver 10–15% lower current density, stretching payback beyond 12 years at prevailing ammonia prices in the Green Ammonia Market. Existing Haber-Bosch lines engineered for steady natural-gas feed must add buffer storage and advanced controls to handle intermittent hydrogen, adding USD 80–120 million for each 1,000-ton-per-day line. Concessional lenders demand sovereign guarantees that heavily indebted emerging-market governments struggle to provide, widening the financing gap just as food-import bills climb. Below 500 tons per day, green ammonia plants lose scale economies, limiting decentralized models that could otherwise localize fertilizer supply.
Safety And Toxicity Hurdles For Maritime Bunkering
Ammonia becomes lethal at 300 ppm, so bunkering protocols must exceed LNG safety baselines. DNV’s 2024 guide calls for double containment piping, real-time vapor monitoring and exclusion zones, driving retrofit costs to USD 50–80 million per berth at existing LNG terminals. The IGC Code governs ammonia as cargo, not fuel, leaving insurers reluctant to underwrite liabilities until ISO completes TC 197 amendments. Crew training is another bottleneck; the International Maritime Organization estimates a shortage of 15,000 qualified personnel by 2030. Maersk’s first ammonia-fueled containership, due in 2027, will test these protocols but broader rollout awaits standardized global rules.
*Our forecasts treat driver/restraint impacts as directional, not additive. The impact forecasts reflect baseline growth, mix effects, and variable interactions.
Green Ammonia Market Segment Analysis
By Application:
Agriculture Anchors Early DemandAgriculture captured 87.99% of the 2025 volume, equal to 235 kilotons, and is forecast to retain dominance with a CAGR of 85.67% during the forecast period (2026-2031), even as the green ammonia market size expands toward 9,854 kilotons by 2031. Yara’s Porsgrunn plant now supplies 75,000 tons annually to European fertilizer blenders, proving that existing downstream assets can accommodate green molecules without modification. India’s Fertiliser Corporation of India Limited signed a five-year offtake deal for 200,000 tons per year at a 15% premium over grey prices, a template deal that derisks equity and accelerates debt closure. These commitments reduce merchant-price exposure, a prerequisite for non-recourse financing and faster project sanctioning.
Marine fuel and power generation are the fastest risers, even though they start from a small base. Maersk’s 12 ammonia-fueled vessels will each burn 18,000 tons a year, adding a visible tranche of demand as soon as 2027. JERA’s planned 50% co-firing at Hekinan requires 800,000 tons yearly and demonstrates that utilities view ammonia as a compliance hedge until grid batteries scale. Hydrogen-carrier pilots such as Uniper’s 30,000-ton cracking plant in Wilhelmshaven illustrate mid-stream optionality, though project economics hinge on European carbon prices above EUR 100 per ton. Collectively these emerging uses introduce diversified revenue stacks that stabilize cash flows, reinforcing investor confidence in the green ammonia industry.

Geography Analysis
Europe Green Ammonia Market
Europe maintained a 35.91% green ammonia market share in 2025 and will grow at an 87.20% CAGR through 2031 because REPowerEU obliges the bloc to import and produce 20 million tons of renewable hydrogen equivalents by 2030. Germany’s H2Global has already awarded EUR 900 million in contracts for imports from Canada and Australia, using a double-auction to absorb price risk. The Nordic cluster leverages hydropower and offshore wind to keep electrolyzers running at 85% capacity factors, pushing green ammonia costs below USD 400 per ton and cementing regional supply leadership.
Middle East and APAC Green Ammonia Market
The Middle East is scaling export capacity faster than any other region. Air Products’ USD 7 billion NEOM complex, which began commissioning in January 2026, will ramp to 1.2 million tons per year by Q4 2026 under 30-year offtake deals indexed to Brent crude. The United Arab Emirates and Oman have pipeline projects totaling 4 million tons of annual capacity by 2030, each exploiting high solar irradiance and low land costs to outcompete many OECD markets. These volumes primarily target Asia-Pacific importers, reinforcing the emerging triangular trade among renewable-resource havens, fertilizer-hungry agrarian economies and maritime-fuel hubs.
The Americas Green Ammonia Market
North America’s trajectory depends on US Inflation Reduction Act production credits of USD 3 per kilogram for green hydrogen with cradle-to-gate emissions below 0.45 kg CO₂e. In the US Green Ammonia Market, CF Industries plans to retrofit its Donaldsonville plant with 300 MW electrolyzers, adding 200,000 tons of annual green ammonia by 2028. Canada’s Atlantic provinces pursue export projects tied to German offtake contracts, while Mexico studies wind-powered units on the Baja Peninsula. South America’s first-mover is Chile, where wind speeds in Magallanes rival Patagonia’s, but port-handling gaps delay commercial start dates beyond 2028. Collectively, these regional plays enlarge the addressable base of the green ammonia market.
Regulatory Landscape
Green ammonia is shaped by a mix of chemicals regulation, industrial permitting rules, and emerging low-carbon fuel and product certification regimes that determine trade eligibility and premium pricing. India formalized a Green Ammonia standard on February 27, 2026 under the National Green Hydrogen Mission, defining how non-biogenic greenhouse-gas emissions are accounted over a 12-month period and affecting qualification for domestic procurement and downstream blending mandates.
In Europe, producers and importers also work through REACH and CLP for hazardous substances, alongside compliance under the Industrial Emissions Directive for large facilities. Renewable Fuels of Non-Biological Origin (RFNBO) rules add traceability requirements, and cross-border supply increasingly depends on corridor-level evidence and project-level emissions data as carbon-accounting responsibilities are split across producers, shippers, and import terminals while CBAM rules evolve.
Value Chain Analysis
The green ammonia value chain typically begins with renewable power procurement (wind, solar, and grid-backed PPAs), then moves to electrolyzers producing green hydrogen, nitrogen separation, and ammonia synthesis via Haber-Bosch or modular loop configurations. Upstream economics are influenced by electrolyzer technology choices and utilization, while midstream integration, storage, and logistics (including cryogenic tanks, terminals, and shipping) drive delivered cost and the viability of export corridors.
Early commercialization has often relied on tightly integrated or partnership-led chains that bundle project development, technology, and marketing to reduce bankability risk. Export-oriented corridor builds and structured offtake programs in Europe have used H2Global-linked supply pathways, and the India-Singapore value-chain work led by Mitsubishi Heavy Industries under a METI-funded program focuses on coordinating production and logistics to lower system costs. As standards and certification mature, measurement, reporting, and verification requirements add further screening on which molecules can move into regulated markets.
Competitive Landscape
The Green Ammonia market is moderately fragmented. Integrated majors and sovereign wealth-backed developers dominate announced capacity, with Air Products, Yara, and CF Industries controlling a substantial portion of the global pipeline through 2030. Electrolyzer suppliers, Nel, ITM Power, and thyssenkrupp Uhde, are racing to add gigawatt-scale factories; thyssenkrupp’s modular alkaline stack filed in 2025 claims a 20% capex cut via standardized plates. Compliance standards shape maritime demand, yet the absence of a unified green-certification scheme leaves room for geographic arbitrage.
Green Ammonia Industry Leaders
-
Air Products and Chemicals Inc.
-
CF Industries Holdings Inc.
-
Fertiglobe
-
Yara
-
ENGIE
- *Disclaimer: Major Players sorted in no particular order
Green Ammonia Market Companies Covered in this Report
- ACME Group
- Air Products and Chemicals Inc.
- Casale SA
- CF Industries Holdings Inc.
- Engie SA
- ENOWA
- Fertiglobe
- Fortescue
- Greenko Group
- Iberdrola, S.A.
- ITM Power plc
- KAPSOM plc
- MAN Energy Solutions
- Nel
- Ørsted AS
- Proton Ventures
- Siemens Energy
- Technip Energies N.V.
- thyssenkrupp Uhde GmbH
- Yara
- AM Green
- Ocior
Market Opportunities and Future Outlook
India's Green Ammonia Standard announced on February 27, 2026 provides a regulatory anchor, setting a non-biogenic greenhouse-gas emissions threshold of 0.38 kg CO2e per kg of ammonia and clarifying compliance for domestic producers and buyers.
Export corridors backed by policy mechanisms are central to long-term demand and capex decisions. Europe leans on H2Global and NEOM-linked pathways to underwrite offtake, and Scatec started partial hydrogen production at Ain Sokhna for Fertiglobe's green ammonia exports to Germany under the H2 Global program. Supply and terminal projects are also moving forward as firms adjust portfolios toward near-term export readiness, including Mitsubishi Heavy Industries' identification of cost-reduction potential in the India-Singapore value chain under a METI-funded program, and Yara expanding its low-carbon ammonia portfolio through recent Gulf Coast and NEOM-related initiatives.
Recent Industry Developments in Green Ammonia Market
- June 2026: Air Products and Chemicals Inc. not proceeding with the Louisiana Clean Energy Complex project and finalizing a marketing and distribution agreement with Yara for renewable ammonia from NEOM Green Hydrogen Project. The action reshapes supply chain access and expands the partner network for green ammonia.
- January 2026: AM Green commenced construction of a green hydrogen based ammonia plant in Kakinada, with 1.5 mtpa capacity; roadmap to start production of 0.5 mtpa by mid 2027. The development adds a large scale regional production node that broadens near term supply potential for Asia Pacific markets.
- April 2025: CF Industries Holdings Inc. formed a joint venture with JERA Co. and Mitsui Co. for production and offtake of low carbon ammonia at the Blue Point Complex, Louisiana, with 1.4 mtpa capacity. The project strengthens US Gulf Coast low carbon ammonia footprint and international offtake relationships.
Green Ammonia Market Report Scope and Research Methodology
Market Definition and Coverage
For this study, the market covers ammonia produced using renewable electricity based hydrogen and then supplied for downstream use as a low carbon molecule. We size the market at the point where green ammonia is delivered into end uses so the model stays linked to real offtake.
Scope exclusions: We exclude conventional ammonia made from fossil feedstocks and projects that are only announced or conceptual without a defined path to production and delivery.
Segments Covered in This Report
- By Application
- Agriculture
- Marine Fuel
- Power Generation
- Hydrogen Carrier
- Other Applications (Industrial Feedstock, etc.)
- By Geography
- Asia-Pacific
- China
- Japan
- India
- South Korea
- ASEAN Countries
- Rest of Asia-Pacific
- North America
- United States
- Canada
- Mexico
- Europe
- Germany
- United Kingdom
- France
- Italy
- Spain
- Russia
- NORDIC Countries
- Rest of Europe
- South America
- Brazil
- Argentina
- Rest of South America
- Middle East and Africa
- Saudi Arabia
- South Africa
- Rest of Middle East and Africa
- Asia-Pacific
Data Sources, Market Sizing, and Validation
Desk Research
We start by building a fact base on project pipelines, policy timelines, and the production and trade context for ammonia. Public sources help anchor the demand story and timing, such as IEA publications on hydrogen and ammonia, IRENA renewable capacity and cost statistics, UN Comtrade trade flows for ammonia products, and government and regulator portals that publish hydrogen and renewable fuel rules.
Next, we layer in corporate disclosures and project documentation, using items such as annual reports, investor presentations, environmental permitting notes, and port or terminal planning updates. A paid subscription covering company financials and news is used to track corporate actions and plant progress, and a paid patent database is used to sanity check technology direction and maturity. The sources listed here are illustrative, and many other public references were also used for data collection, validation, and clarification.
Primary Interviews and Surveys
Primary interviews and surveys are used to pressure test the desk view on what will be commissioned on time and what will actually be sold, which can differ in early stage markets. We speak with project developers, engineering stakeholders, offtakers across fertilizer, marine, power, and hydrogen carrier use cases, and logistics and certification informed experts across key producing and importing regions so assumptions do not rely on one geography.
Distribution of primary research fieldwork respondents
| Company type | Respondent position | Region |
|---|---|---|
| Top tier: 39% | CXOs: 15% | APAC: 46% |
| Mid tier: 44% | Functional/Unit leaders: 34% | EMEA: 36% |
| Smaller Players: 17% | Managers: 51% | Americas: 18% |
Market-Sizing & Forecasting
The core sizing uses a top-down model that reconstructs the addressable pool from project level capacity plans and expected ramp-ups, which are then filtered through commissioning dates, utilization assumptions, and likely offtake by application. Results are corroborated with selective bottom-up approximations, such as sampled capacity by region multiplied by expected operating rates, followed by channel checks on typical contract terms and delivered pricing ranges.
Key inputs include electrolyzer commissioning timelines linked to renewable power availability, ammonia plant nameplate capacity and ramp curves, expected allocation across agriculture, marine fuel, power generation, and hydrogen carrier demand, and constraints from storage and export terminal readiness. When project data is incomplete (for example, missing utilization or offtake split), we apply interview guided ranges and conservative ramp assumptions until clearer evidence becomes available.
For forecasting, scenario analysis is used because policy support, certification acceptance, and shipping fuel adoption can shift timing quickly. The scenarios are anchored to observable triggers such as tender awards, signed offtake coverage, and construction progress, and then the final outlook is selected after reconciling expert expectations with the modeled supply and demand balance.
Data Validation & Update Cycle
We run several checks before sign-off so the model does not drift away from what the market can physically deliver. Outputs are compared against independent signals such as permitted capacity, construction milestones, and offtake visibility by end use, and then any large jumps are reviewed by another analyst before totals are finalized.
If a variance is driven by a single project delay or a sudden policy change, we re-contact sources to confirm the timing and the implied volume impact, and then assumptions are updated with traceable notes. Reports are refreshed annually, with interim updates for material events, and a final pre-delivery pass is completed so clients receive the latest updated view.
Mordor Intelligence's Green Ammonia Market Estimate Compared With Other Published Estimates
Published green ammonia values can look far apart because some sources size the market from future capacity headlines, while others only count volumes that are actually delivered into end uses. Differences also appear when one estimate uses volume proxies and another uses revenue, or when base years and currency conversion timing do not match.
Commissioning progress, contracted offtake signals, and application level demand checks are the evidence that keeps Mordor Intelligence tied to delivered volumes rather than announced nameplate capacity. In other publications, the gap often comes from treating under-construction plants as fully utilized, or from mixing renewable and broader low carbon definitions that pull in adjacent ammonia supply.
Benchmark comparison
| Source | Market Size | Gaps in Research Methodology |
|---|---|---|
| Mordor Intelligence | USD 0.28 B (2025) | |
| Trade Journal A | USD 0.30 B (2024) | Uses a different base year and often presents an early market value without showing commissioning filters, which can overstate near term deliverable supply. |
| Industry Press Release B | USD 0.28 B (2023) | Applies long range growth rates with limited visibility on utilization, offtake coverage, and certification readiness, which can shift both the starting point and the slope. |
The spread across the table is mainly explained by year alignment and what gets counted as market activity in the early years. Our method stays traceable because it ties assumptions to project readiness, realistic operating rates, and application demand pull, which makes updates straightforward when plants move from plans into output.
Key Questions Answered in the Report
How large will global production be by 2031?
The green ammonia market is projected to reach 9.85 million tons by 2031, reflecting an 82.47% CAGR over 2026-2031.
Why is fertilizer the dominant use?
Agriculture required 87.99% of volume in 2025 because ammonia is the primary nitrogen-fertilizer input, and emerging food-insecure nations are securing long-term green supply.
Which region offers the lowest delivered cost?
The Middle East combines world-class solar and wind resources with large land parcels, enabling projects such as NEOM to hit sub-USD 2 per kilogram hydrogen costs, translating to green ammonia below USD 400 per ton.
What policy tool most accelerates adoption?
Contracts-for-difference in the United Kingdom, Germany and Australia guarantee revenue for up to 15 years, closing financing gaps and shortening time to FID.
Is blue ammonia a long-term threat?
Blue ammonia undercuts green by USD 100–150 per ton today, but its competitiveness will erode if carbon-border adjustments penalize residual emissions.