
Market Overview
| Study Period | 2020 - 2031 |
|---|---|
| Forecast Data Period | 2026 - 2031 |
| Historical Data Period | 2020 - 2024 |
| Market Size (2026) | USD 1.11 Billion |
| Market Size (2031) | USD 1.83 Billion |
| Growth Rate (2026 - 2031) | 10.44% CAGR |
| Market Concentration | Medium |
Major Players *Disclaimer: Major Players sorted in no particular order Image © Mordor Intelligence. Reuse requires attribution under CC BY 4.0. | |
Greece POS Terminals Market Analysis by Mordor Intelligence
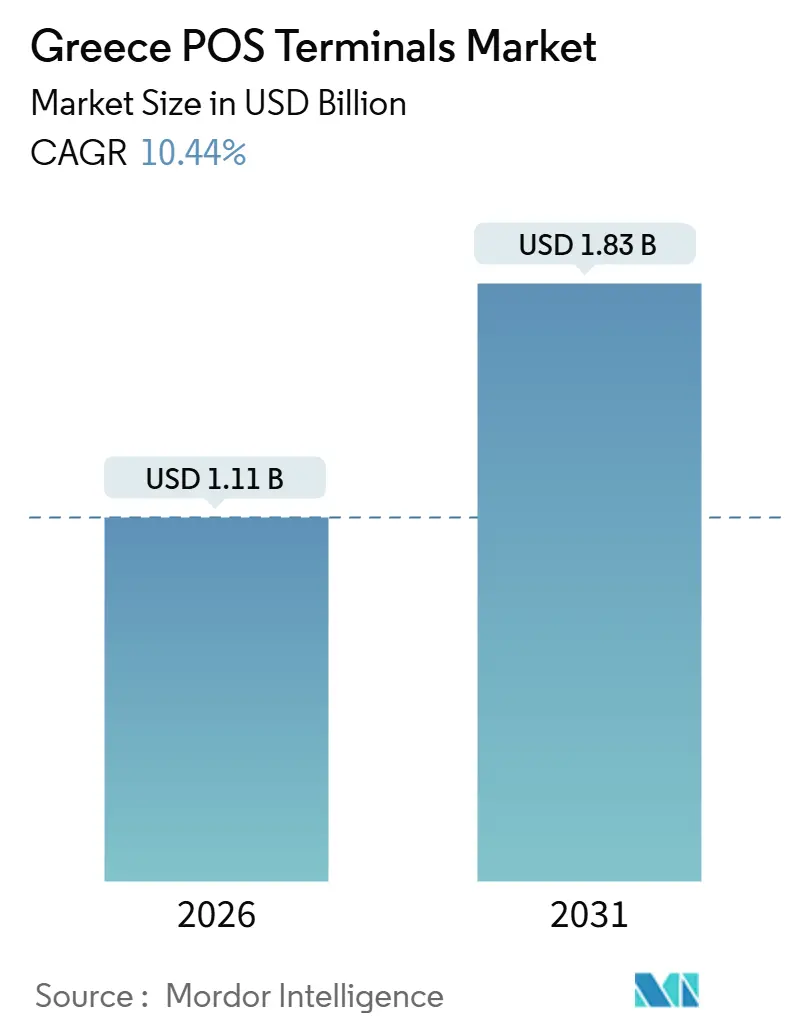
The Greece POS terminals market size stood at USD 1.11 billion in 2026 and is forecast to reach USD 1.83 billion by 2031, reflecting a robust 10.44% CAGR. This expansion is propelled by regulatory mandates that require instant-payment readiness, a rapid rebound in tourism that is driving contactless preferences, and micro-merchants’ move toward software-based acceptance. Acquirers responded to the November 2025 IRIS deadline with nationwide hardware refresh programs, while the phased e-invoicing rollout in 2026 is pushing even the smallest retailers toward fiscal-compliant solutions. Rising demand for cloud subscriptions, loyalty integration, and buy-now-pay-later functionality is further elevating replacement cycles and supporting premium pricing. Meanwhile, the EU’s Digital Transformation of SMEs funds and the ECB’s digital-euro roadmap are expanding the addressable base for compliance-ready devices and firmware-upgradable Android models.
Key Report Takeaways
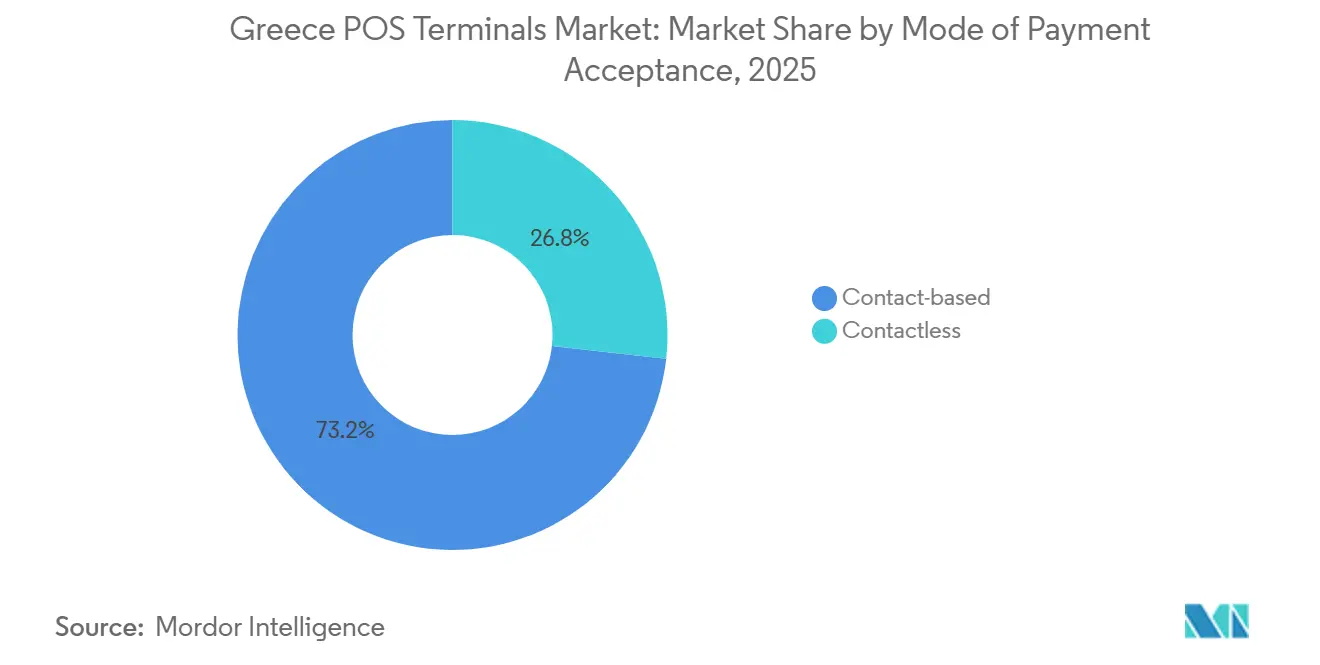
- By mode of payment acceptance, contactless held 26.77% of the installed base in 2025 and is projected to expand at an 11.64% CAGR through 2031.
- By POS type, fixed systems accounted for 53.84% of the Greece POS terminals market share in 2025, whereas mobile and portable devices are forecast to grow at an 11.77% CAGR between 2026 and 2031.
- By component, hardware captured 64.14% of the Greece POS terminals market size in 2025, while software revenues are advancing at an 11.86% CAGR to 2031.
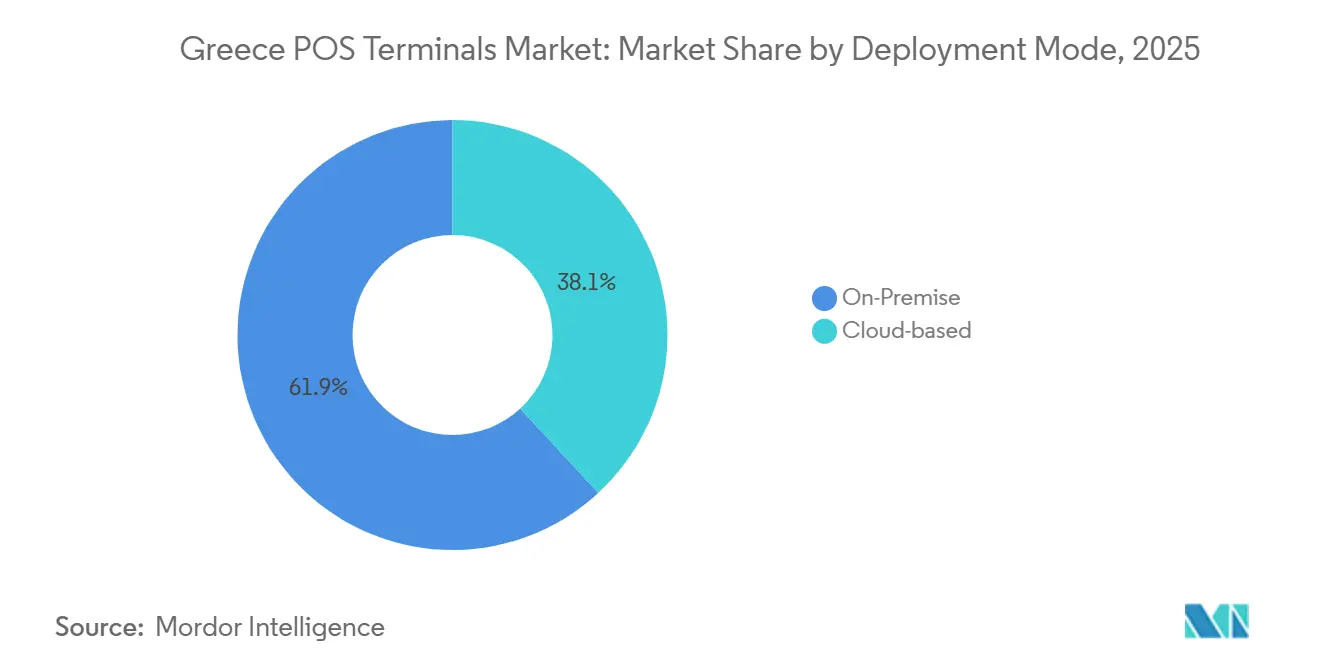
- By deployment mode, on-premise installations represented 61.86% of the base in 2025, yet cloud solutions are projected to climb at an 11.44% CAGR during the forecast period.
- By end-user industry, retail led with 35.73% revenue share in 2025, whereas healthcare is projected to register the fastest 11.52% CAGR to 2031.
Note: Market size and forecast figures in this report are generated using Mordor Intelligence’s proprietary estimation framework, updated with the latest available data and insights as of January 2026.
Greece POS Terminals Market Trends and Insights
Drivers Impact Analysis*
| Driver | (~) % Impact on CAGR Forecast | Geographic Relevance | Impact Timeline |
|---|---|---|---|
| Mandatory QR-Code Fiscalisation Rule Accelerating Terminal Upgrades | +2.1% | National, with concentrated rollout in Athens, Thessaloniki, and tourist-heavy islands | Short term (≤ 2 years) |
| Government VAT Lottery Incentives Boosting Card Usage | +1.8% | National, with higher redemption rates in urban centers and coastal tourism zones | Medium term (2-4 years) |
| Rapid Tourism Recovery Raising Contactless Acceptance Demand | +2.3% | National, with peak impact in Cyclades, Crete, Rhodes, and Santorini | Short term (≤ 2 years) |
| Surge in SoftPOS Tap-to-Phone Deployments among Micro-SMEs | +1.9% | National, with early adoption in Athens metropolitan area and secondary cities | Medium term (2-4 years) |
| EU Digital Euro Readiness Investments in POS Infrastructure | +1.2% | National, aligned with European Central Bank pilot timelines | Long term (≥ 4 years) |
| Multiservice POS Bundling (Loyalty, BNPL, Bill-Payment) Driving Replacement Cycles | +1.5% | National, with stronger uptake in retail and hospitality verticals | Medium term (2-4 years) |
| Source: Mordor Intelligence | |||
Mandatory QR-Code Fiscalisation Rule Accelerating Terminal Upgrades
The phased enforcement of QR-code receipts, which link every sale to the tax authority, sparked urgent hardware replacements beginning late 2024. Penalties for non-compliance pushed micro-retailers to replace legacy devices, with Athens, Thessaloniki, and major islands recording the sharpest refresh peaks. Eurobank Merchant Services disclosed that 30% of its 123,000 merchants needed new equipment, a surge that favored Android terminals supporting over-the-air updates.[1]Worldline, “Worldline Completes Acquisition of 80% Stake in Eurobank's Merchant Acquiring Business,” worldline.com Multifunction models such as PAX A920 Pro became popular because integrated printers and scanners simplify fiscal data flows.[2]PAX Global Technology, “PAX A920 Pro Product Specifications,” pax.com.cn This regulation alone is adding about 2.1 percentage points to the growth trajectory over the next two years.
Government VAT Lottery Incentives Boosting Card Usage
Greece’s VAT-receipt lottery pays monthly cash prizes to shoppers who request digital receipts, nudging cash transactions toward electronic payment streams. Card volumes grew 14% year-over-year in H1 2025, with official surveys naming the lottery a prime motivation. Participation skews toward small-ticket purchases, so acquirers lowered rental fees on lightweight readers and introduced zero-commission thresholds below EUR 10, a move synchronized with lottery mechanics. With uptake highest in urban and tourist coasts, this incentive framework is lifting the forecast growth rate by 1.8 percentage points.
Rapid Tourism Recovery Raising Contactless Acceptance Demand
International arrivals rebounded to 33 million in 2024, surpassing pre-pandemic highs and pushing hospitality operators to offer tap-to-pay favored by Northern European and North American visitors. Contactless usage exceeded 70% of total card volume at peak season across Cycladic destinations. Acquirers deployed battery-powered 4G devices to beach clubs and yacht charters, segments that historically relied on cash. Worldline’s enlarged merchant base of 190,000 following its Eurobank deal positioned it to furnish NFC-enabled hardware rapidly. Tourism activity is contributing 2.3 percentage points to growth through 2027.
Surge in SoftPOS Tap-to-Phone Deployments among Micro-SMEs
Zero-hardware SoftPOS apps allow sole proprietors and seasonal vendors to accept contactless payments on existing smartphones for as little as EUR 4 per month. National Bank of Greece’s Tap On Mobile and similar launches from Worldline, Nexi, and Ingenico accelerated uptake in 2025. Updated PCI guidelines published in 2024 improved security confidence by mandating device attestation and encryption. Early adoption clusters in Athens and secondary cities suggest a 1.9 percentage-point uplift to the market’s CAGR, although connectivity gaps still temper rural expansion.
Restraints Impact Analysis*
| Restraint | (~) % Impact on CAGR Forecast | Geographic Relevance | Impact Timeline |
|---|---|---|---|
| Persistent High Merchant Service Charges for Micro-Merchants | -1.3% | National, with acute pressure in rural areas and low-margin sectors | Medium term (2-4 years) |
| Island and Mountainous Area Connectivity Gaps | -0.9% | Concentrated in Aegean and Ionian islands, Epirus, and Peloponnese highlands | Long term (≥ 4 years) |
| Multi-Acquiring Double Counting Inflating Device Base and Costs | -0.7% | National, with higher incidence in urban retail and hospitality clusters | Short term (≤ 2 years) |
| Cyber-Fraud Migration to SoftPOS Channels | -0.6% | National, with elevated risk in Athens and Thessaloniki metro areas | Medium term (2-4 years) |
| Source: Mordor Intelligence | |||
Persistent High Merchant Service Charges for Micro-Merchants
Despite 2024 legislation aimed at trimming card fees below EUR 20, micro-merchants still pay all-in discount rates of 1.5-2.5%, eroding already thin margins. Eurobank lists monthly rentals from EUR 10.50 to EUR 17 plus per-transaction add-ons that overwhelm small vendors. Many rural kiosks and street sellers therefore defer adoption or revert to cash during enforcement lulls, subtracting 1.3 percentage points from overall growth expectations.
Island and Mountainous Area Connectivity Gaps
More than 200 inhabited islands and rugged mainland topography leave parts of Greece on 3G networks with spotty reliability. Merchants on secondary islands report authorization failures above 5% in summer peaks, compelling fallback to cash or manual imprinters.[3]European Commission, “Digital Transformation of SMEs – Greece Allocation,” ec.europa.eu Hybrid offline-buffer terminals exist but cost more and require periodic sync. Until 5G reaches nationwide coverage, this hurdle is shaving 0.9 percentage points from the long-term growth outlook.
*Our forecasts treat driver/restraint impacts as directional, not additive. The impact forecasts reflect baseline growth, mix effects, and variable interactions.
Segment Analysis
By Mode of Payment Acceptance: Contactless Momentum Redefines Upgrade Cycles
Contactless transactions rose from a 26.77% base in 2025 and are forecast to advance at an 11.64% CAGR, outstripping overall Greece POS terminals market growth. The IRIS instant-payment rule that became mandatory in November 2025 accelerated NFC reader upgrades across more than 430,000 devices within Worldline’s network. Dual-interface hardware now dominates new installations, while chip-and-PIN remains prevalent for high-value purchases. The forthcoming digital-euro protocol adds offline NFC transactions, reinforcing the need for firmware-upgradable Android models. PAX A920 Pro deployments by Euronet illustrate how acquirers future-proof assets without full hardware swaps.
Contactless acceptance is also propelled by digital-wallet penetration: 40% of Greek consumers use Apple Pay, Google Pay, or Viva Wallet weekly. Acquirers leverage this preference to upsell loyalty and installments, reinforcing stickiness. Although contact-based readers still process luxury sales in jewelry and automotive showrooms, planned ECB standards will dilute the functional gap. Consequently, contactless share will keep eroding chip-centric installations, cementing its role as the growth engine of the Greece POS terminals market.


By POS Type: Portable Devices Capitalize on Tourism-Driven Mobility
Fixed countertop units retained 53.84% of Greece POS terminals market share in 2025 thanks to supermarkets and pharmacies that integrate devices with back-office software. However, mobile and portable terminals are projected to grow at an 11.77% CAGR as restaurants, beach clubs, and pop-up retailers favor tableside payment that cuts wait times and mitigates cash loss. Worldline’s 4G Android portfolio gained rapid adoption on Crete and the Cyclades after tourism surpassed pre-pandemic footfall. National Bank of Greece and EVO Payments further tilted economics by pricing PAX A80 hardware at EUR 169, lowering the break-even point for micro-SMEs.
SoftPOS apps threaten to cannibalize entry-level portable hardware, yet many merchants maintain dedicated devices for QR-fiscalisation printing and longer battery life. Large chains still prefer fixed terminals for barcode scanning and customer displays. Funding from the EU’s SME digital-transformation program favored portable submissions, emphasizing flexibility. As NFC tap-to-phone matures, competitive lines will blur, but portable hardware is expected to preserve a sizable premium where all-in-one receipt and inventory features are indispensable.
By Component: Software Subscriptions Propel Recurring Revenue Models
Hardware dominated 64.14% of Greece POS terminals market size in 2025, yet software revenues are set to rise at 11.86% annually as acquirers pivot toward cloud subscriptions. Nexi’s XPay platform upgrade in August 2025 enabled Apple Pay and Google Pay without extra hardware, highlighting the flexibility of configuration-based rollouts. Cloud POS vendors such as SoftOne GO RETAIL and LS Central synchronize inventory, loyalty, and payments across chains, enticing merchants that lack IT staff. Services revenue sits between the two, enriched by maintenance contracts but squeezed by self-onboarding portals.
The mandatory 2026 e-invoicing regulation accelerates software demand because real-time tax reporting is impossible on firmware-only devices. PCI’s 2024 SoftPOS security updates raise development costs yet erect barriers that favor incumbents. As acquirers bundle analytics dashboards and installment financing, software’s share will steadily cannibalize hardware margins, transforming value capture across the Greece POS terminals market.
By Deployment Mode: Cloud Adoption Gains Momentum Among Multi-Site Operators
On-premise systems commanded 61.86% in 2025, but cloud deployments are forecast to climb at an 11.44% CAGR. Retailers with 10 plus outlets choose cloud for unified inventory and simplified upgrades, evidenced by SoftOne’s 35% jump in merchant sign-ups during 2025. Oracle Simphony Cloud gives restaurants kitchen-display and dynamic-pricing tools that benefit from centralized analytics. Nevertheless, concerns over internet downtime persist in islands and mountains, prompting hybrid models that process payments locally while storing data in the cloud.
EU grants subsidize up to 50% of first-year cloud fees, tilting total cost of ownership in favor of subscription models. GDPR compliance adds complexity but also standardizes security, making cloud platforms more palatable to large enterprises. As 5G coverage expands, cloud solutions will erode on-premise share, particularly among growth-oriented SMEs that value remote administration and seamless scaling within the Greece POS terminals market.
By End-User Industry: Healthcare Surges on Reimbursement Digitization
Retail retained 35.73% of spending in 2025, but healthcare is forecast to rise at an 11.52% CAGR through 2031. Pharmacies now require electronic proof of purchase for reimbursement submission to EOPYY, forcing upgrades from manual imprinters to integrated terminals. Private clinics adopt POS devices with installment-plan features to ease patient out-of-pocket costs via buy-now-pay-later. Hospitality continues to expand thanks to tourism but experiences seasonal revenue swings, while transportation gains incremental volume as taxis and parking operators adopt contactless acceptance.
Healthcare’s momentum will spike again in October 2026 when e-invoicing extends to all providers. Acquirers are already packaging compliance-ready bundles that combine hardware, cloud software, and service support to tap this high-growth vertical. Beyond healthcare, niche gains in education and municipal services remain localized but point to broadening acceptance across Greece POS terminals market segments.
Geography Analysis
Athens and Thessaloniki accounted for roughly 60% of terminal installations in 2025, underscoring how population density, superior telecom infrastructure, and multinational chains concentrate electronic payments. Rural mainland and island merchants trail in both penetration and upgrade cadence, constrained by higher fees and patchy 3G connectivity. EU infrastructure funds are financing 5G base stations across the Aegean and Ionian archipelagos, expected to cut transaction failures below 2% by 2028.
Tourism hotspots in the Cyclades, Crete, Rhodes, and Santorini posted contactless shares above 70% during 2025 summers, prompting acquirers to roll out portable 4G devices that operate in beach clubs and yacht marinas. Seasonal demand spikes have driven flexible rental models where merchants pay only for active months.
The ECB’s digital-euro plan, set for pilot in 2027, will add offline NFC capability that alleviates connectivity barriers in islands and mountainous zones. International manufacturers such as Ingenico and Verifone, already certifying firmware, are positioned to win contracts in regions where no domestic vendor exceeds 10% share. As subsidies and digital-wallet familiarity spread beyond urban centers, geographic disparities in the Greece POS terminals market are expected to narrow gradually.
Regulatory Landscape
The POS acceptance regulatory framework in Greece is built on EU payment rules (PSD2) and domestic oversight. The Bank of Greece oversees payment systems and payment instruments under the Eurosystem PISA framework, with risk, resilience, and governance expectations for participants supporting merchant acceptance defined in Monetary Policy Council Act No. 50/31 July 2002.
On the tax-compliance side, the Independent Authority for Public Revenue (AADE/IAPR) has strengthened visibility over the acceptance estate through a centralized Means of Payment Registry on the myAADE portal. Decision A. 1137/2023 requires automated reporting of active EFT/POS terminals by acquirers and network service providers (NSPs), reinforcing device traceability alongside QR-linked fiscalisation and e-invoicing requirements referenced across the report context.
Value Chain Analysis
The Greece POS terminals value chain begins with terminal OEMs and Android device platforms (including PAX, Ingenico, Verifone, and Android-based challengers), supplying hardware through acquirers and their field partners. It then expands into software layers (cloud POS, loyalty, analytics, and BNPL modules) and services such as installation, maintenance, security, and connectivity management.
Payment Service Providers (acquirers) manage merchant onboarding, pricing, transaction routing, and settlement, while Network Service Providers (NSPs) run deployment, terminal lifecycle, and monitoring. This split aligns with AADE reporting requirements for active terminal inventories. Worldline operates in Greece through its Eurobank-linked footprint and the earlier acquisition of Cardlink SA, supporting nationwide refresh programs, while Viva Wallet's issuer-processor model reduces reliance on third-party routing and supports faster software-led acceptance, including SoftPOS. Merchants in retail, hospitality, and healthcare ultimately pull through replacement cycles when QR fiscalisation, e-invoicing, or instant-payment readiness requires firmware upgrades, certified applications, or new devices.
Competitive Landscape
Worldline’s 46% transaction share and 53% merchant-service value give it clear scale advantages after absorbing Cardlink and Eurobank Merchant Services. Nexi Payments Greece, owned with Alpha Bank, focuses on omnichannel merchants and e-commerce, integrating Apple Pay and Google Pay via its August 2025 XPay upgrade. Viva Wallet, reinforced by JPMorgan’s 49% stake, plays in micro-SME SoftPOS, onboarding sole traders within minutes through smartphone apps.
National Bank of Greece’s NBG Pay, partnered with EVO Payments, undercuts incumbent rental fees by offering PAX A80 terminals at EUR 169 and Tap On Mobile at EUR 4 per month, sacrificing margin for reach. Android-based suppliers such as Sunmi and Nayax challenge hardware incumbents by bundling loyalty and telemetry. EU QR-fiscalisation and digital-euro readiness favor certified players PAX, Ingenico, and Verifone, who can roll out firmware updates at scale.
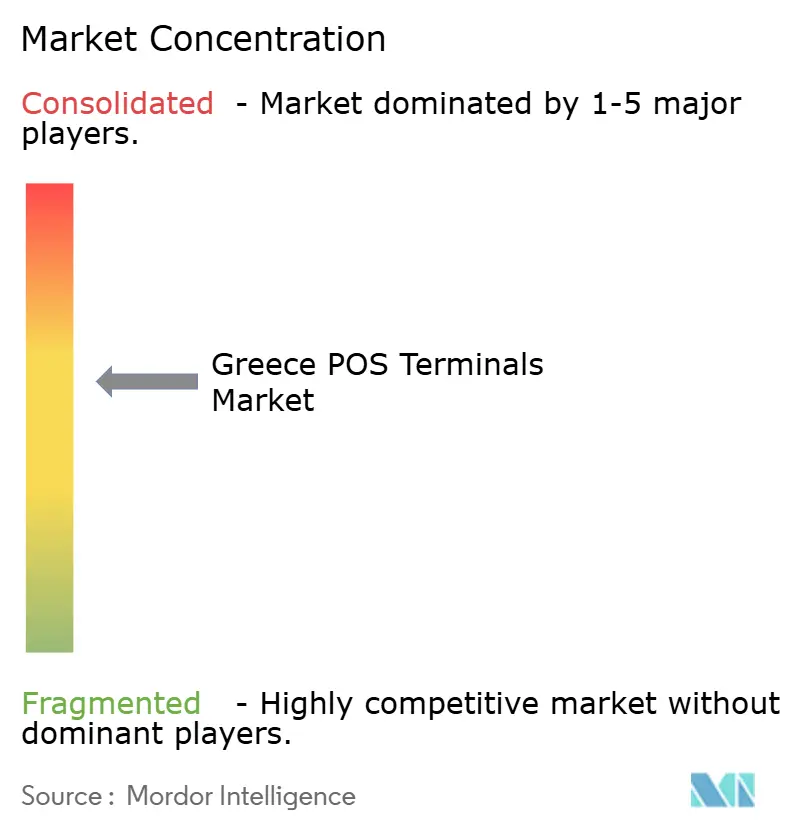
Healthcare remains lightly penetrated, presenting white-space for acquirers that can tailor reimbursement workflows. PCI’s 2024 SoftPOS requirements elevate entry barriers and thus benefit established brands willing to shoulder compliance costs. The Greece POS terminals market therefore shows moderated concentration with active disruptor pressure and regulatory catalysts reshaping share dynamics.
Greece POS Terminals Industry Leaders
Nexi Payments Greece Société Anonyme
Cardlink SA
Worldline SA
Viva Wallet Holdings
Piraeus Bank epay
- *Disclaimer: Major Players sorted in no particular order

Market Opportunities and Future Outlook
Public-sector digitization programs add acceptance and orchestration needs beyond traditional retail and hospitality deployments. The Digital Payments Gateway project (MIS 5225587), implemented under the Ministry of Digital Governance ecosystem (via Society for the Information, KtP M.A.E.), centralizes public sector payments to improve visibility and collection efficiency, creating workflow demand for compliant acceptance, reconciliation, and reporting capabilities that POS vendors and acquirers can package for municipalities and public-facing services.
Broader national and EU-aligned digital transition initiatives support demand for compliance-ready, upgradable terminals and software-led acceptance. The European Commission Digital Decade Country Report 2026 and the Digital Transformation Bible (2026-2030) outline a roadmap with 125 measures and EUR 6.1 billion in public funding for SME and public administration modernization. In parallel, AADE Means of Payment Registry requirements and the market shift toward instant payments (IRIS readiness referenced in the report context) favor vendors that can run managed device estates, deliver remote updates, and integrate tax-reporting workflows for micro-merchants and multi-site operators.
Recent Industry Developments
- July 2026: Inbank/Eurobank announced a 50/50 joint venture to launch an embedded finance business in Greece, with commercial launch targeted for Q1 2027. The initiative advances embedded finance in the Greek merchant and SME ecosystem. PDV integration of banking and payments expands merchant services and cross-sell finance products within POS networks.
- May 2026: Worldline SA completed acquisition of the remaining 20% stake in Worldline Greece from Eurobank, becoming sole owner. This marks consolidation of merchant acquiring and POS services in Greece. It strengthens Worldline’s distribution and integration with Eurobank network to scale merchant services and IRIS adoption.
- January 2026: Euronet Worldwide entered definitive agreement to acquire the merchant acquiring business of CrediaBank S.A. in Greece. This expands merchant acquiring capacity in Greece. It increases Euronet’s footprint in Greek POS acquiring and accelerates competition in the local market.


Research Methodology Framework and Report Scope
Market Definition and Coverage
For this report, the market covers the spending in Greece on POS terminals and closely related enablement, counted across the device, its embedded software, and supporting services that help merchants accept in-person electronic payments.
Scope exclusions: Online-only payment gateways and pure ecommerce checkout tools are excluded from this market sizing.
Segmentation Overview
- By Mode of Payment Acceptance
- Contact-based
- Contactless
- By POS Type
- Fixed Point-of-Sale Systems
- Mobile / Portable Point-of-Sale Systems
- By Component
- Hardware
- Software
- Services
- By Deployment Mode
- Cloud-based
- On-Premise
- By End-User Industry
- Retail
- Hospitality
- Healthcare
- Transportation and Logistics
- Other End-User Industries
Data Sources, Market Sizing, and Validation
Desk Research
Desk research helped set the baseline for Greece, mainly by pinning down the size of the merchant base, shifts in payment behavior, and compliance drivers that trigger terminal replacements. We relied on public sources such as the Bank of Greece for payment statistics, the Hellenic Statistical Authority (ELSTAT) for business counts and sector activity, and Eurostat for comparable indicators across EU markets.
To translate those signals into a workable model, we also reviewed guidance and publications from bodies such as the European Central Bank and the European Commission on payments, digitalization, and related programs. On the supply side, we used company filings, investor presentations, and trusted press coverage to understand product positioning and service attachment trends, then cross-checked select points using paid subscriptions for company financials and news intelligence, and for shipment-level import and export checks where relevant. The sources listed here are illustrative, and many additional public and paid references were used to collect data, validate assumptions, and clarify open questions.
Primary Interviews and Surveys
Our expert interviews and surveys in Greece cover payment service professionals, terminal distributors, merchant technology users, and financial decision-makers. Their feedback helps test secondary data, close gaps on replacement timing and average selling prices, and triangulate the final market model.
Distribution of primary research fieldwork respondents
| Company type | Respondent position | Region |
|---|---|---|
| Top tier: 30% | CXOs: 15% | |
| Mid tier: 50% | Functional/Unit leaders: 30% | |
| Smaller Players: 20% | Managers: 55% |
Market-Sizing & Forecasting
The sizing starts with a top-down build that reconstructs the in-person acceptance demand pool in Greece using merchant counts by category, estimated POS penetration, and refresh timing, which are then converted into annual device and enablement spending. To keep the totals realistic, we corroborated the results with selective bottom-up approximations, such as sampled average selling prices by terminal type, channel feedback on shipment and install volumes, and rough supplier and acquirer rollups where data was available.
A few inputs that mattered in this market included the pace of contactless adoption, the share of merchants in high-throughput sectors like hospitality, the installed base aging profile that drives replacements, service and software attach rates tied to cloud deployment, and pricing differences between fixed and mobile terminals. Where direct volumes were not visible, gaps were handled using proxy ratios from adjacent EU markets and then adjusted back to Greece using merchant density and sector mix checks.
For forecasting, we used scenario analysis supported by a light multivariate regression layer, so demand is linked to drivers like merchant growth, tourism activity proxy indicators, and the timing of compliance related upgrades. Final year growth was not pushed mechanically, and assumptions were softened or tightened based on what primary respondents expected for renewal cycles and service bundling over the forecast window.
Data Validation & Update Cycle
Validation was done through multiple passes, where model outputs were compared against independent signals like device replacement intensity implied by install base estimates, sector level merchant activity, and observed pricing bands from channel feedback. When a number looked off, the drivers behind it were rechecked, and follow-up calls were triggered to confirm whether the change was real or caused by timing, accounting, or double counting.
Before sign-off, the work is reviewed by another analyst to catch inconsistencies, and key assumptions are checked for internal alignment across inputs and outputs. Reports are refreshed annually, with interim updates when material events occur, and a final pre-delivery review is completed so clients receive the latest updated view.
Mordor Intelligence's Greece Pos Terminals Market Size Versus Other Published Estimates
Published market sizes for Greece POS terminals can look different across sources because the scope is not always the same, and the same year can be expressed using different price timing, service inclusions, and replacement assumptions. Differences also show up when one publisher sizes units and another sizes value, or when the model leans heavily on a single demand proxy without enough cross-checks.
Online-only payment gateways are kept outside Mordor Intelligence's scope here, which can pull the total down versus estimates that blend ecommerce acceptance tools with card-present terminals, especially when services are bundled. The spread also comes from how software and managed services are treated, since some figures count only hardware shipments, and others apply aggressive price uplift without validating local channel discounting and timing of regulatory refresh waves.
Benchmark comparison
| Source | Market Size | Gaps in Research Methodology |
|---|---|---|
| Mordor Intelligence | USD 1.11 B (2026) | |
| Industry Association A | USD 0.92 B (2026) | Often closer to a hardware-first view, where value is tied mainly to terminal shipments and replacements, with limited inclusion of software subscriptions and ongoing managed services tied to the installed base. |
| Global Consultancy B | USD 1.46 B (2026) | Tends to expand the addressable pool by mixing adjacent acceptance solutions, and it may use standardized ASP escalation across countries, which can overstate Greece pricing when channel promotions are common. |
Across the three figures, the key takeaway is that totals move mainly based on what is counted as POS terminal related spend, and how recurring software and services are attached to the device base. By keeping the steps traceable to merchant demand, install base behavior, and realistic pricing bands, the estimate stays repeatable even when individual assumptions are updated.


Key Questions Answered in the Report
How large is the Greece POS terminals market in 2026 and what growth is expected by 2031?
The market is valued at USD 1.11 billion in 2026 and is forecast to reach USD 1.83 billion by 2031, registering a 10.44% CAGR.
Which payment acceptance type is expanding the fastest in Greece?
Contactless transactions are projected to grow at an 11.64% CAGR, outpacing contact-based methods and driving most new terminal upgrades.
What is fueling software revenue growth for POS terminals in Greece?
Demand for cloud subscriptions that bundle loyalty, buy-now-pay-later, and analytics is pushing software to an 11.86% CAGR, the highest among component segments.
How will the ECB’s digital-euro project affect Greek merchants?
Merchants will need to upgrade terminals at an estimated EUR 40-75 per device to support offline NFC and QR-code digital-euro payments starting with pilot programs in 2027.
Which vertical shows the fastest growth rate for POS adoption?
Healthcare is advancing at an 11.52% CAGR as pharmacies and clinics digitize payments to meet e-invoicing and reimbursement requirements.
Who is the leading acquirer in the Greek POS market?
Worldline, after acquiring Cardlink and Eurobank Merchant Services, controls about 46% of transaction share and 53% of merchant-service value.
Page last updated on:






