Graphite Market Size and Share
Market Overview
| Study Period | 2021 - 2031 |
|---|---|
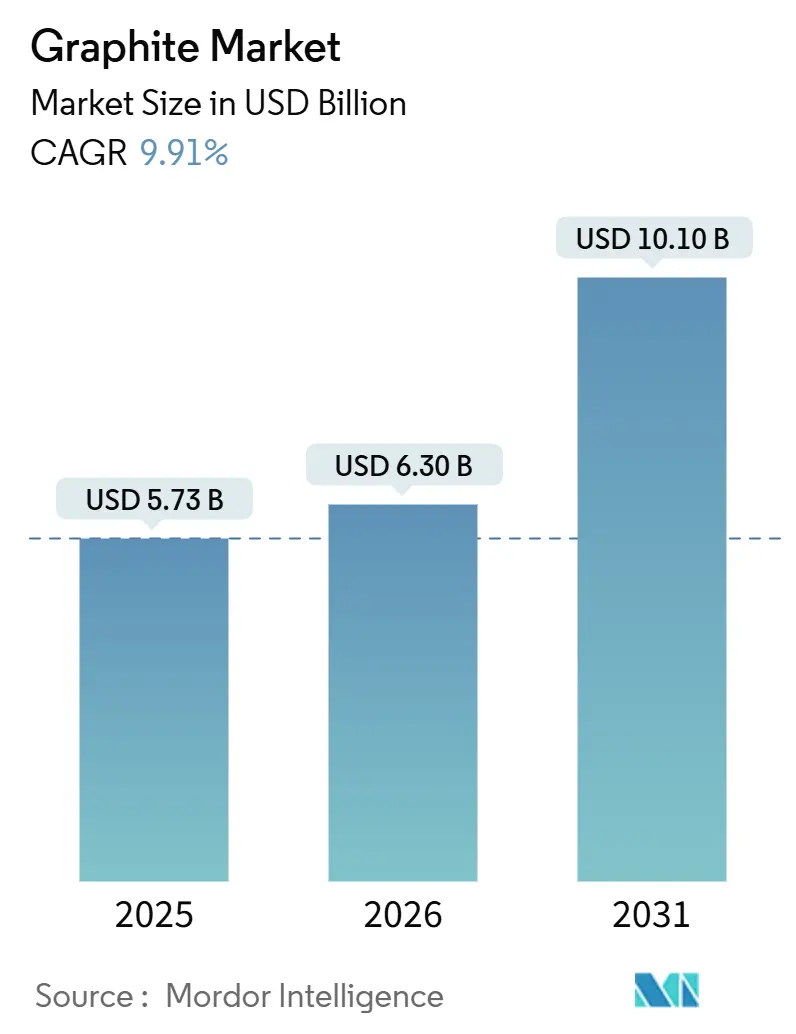
| Market Size (2026) | USD 6.30 Billion |
| Market Size (2031) | USD 10.10 Billion |
| Growth Rate (2026 - 2031) | 9.91% CAGR |
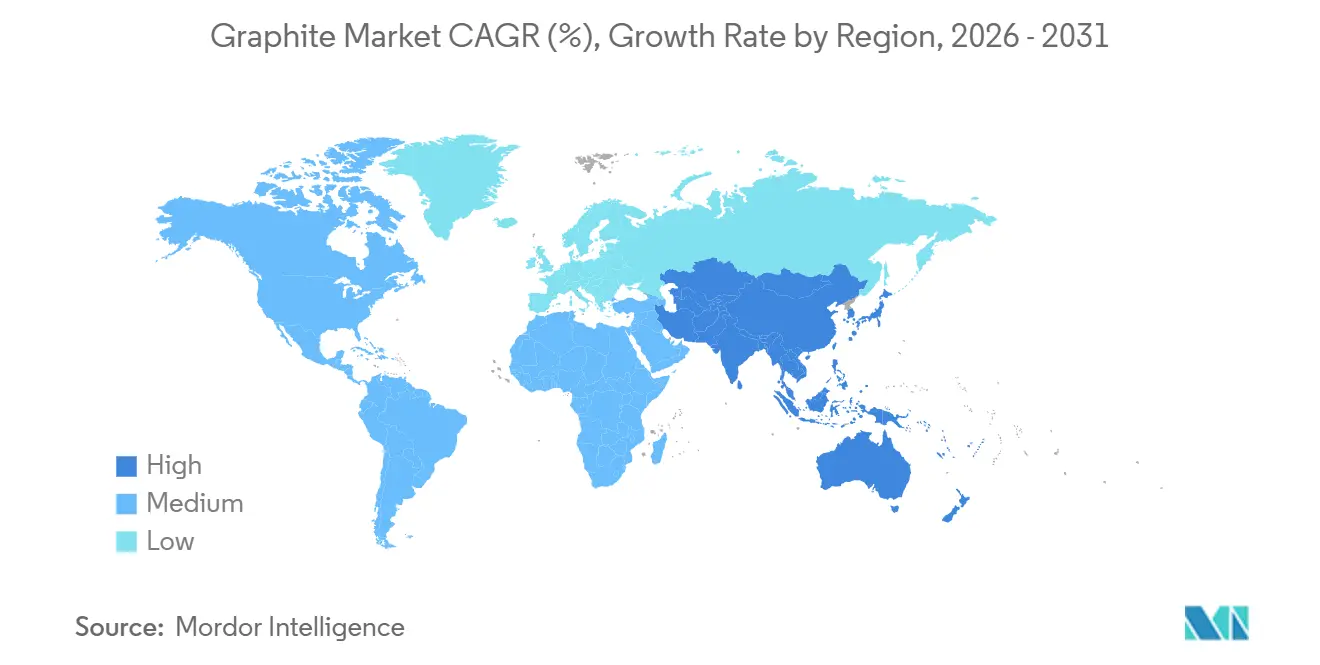
| Fastest Growing Market | Asia Pacific |
| Largest Market | Asia Pacific |
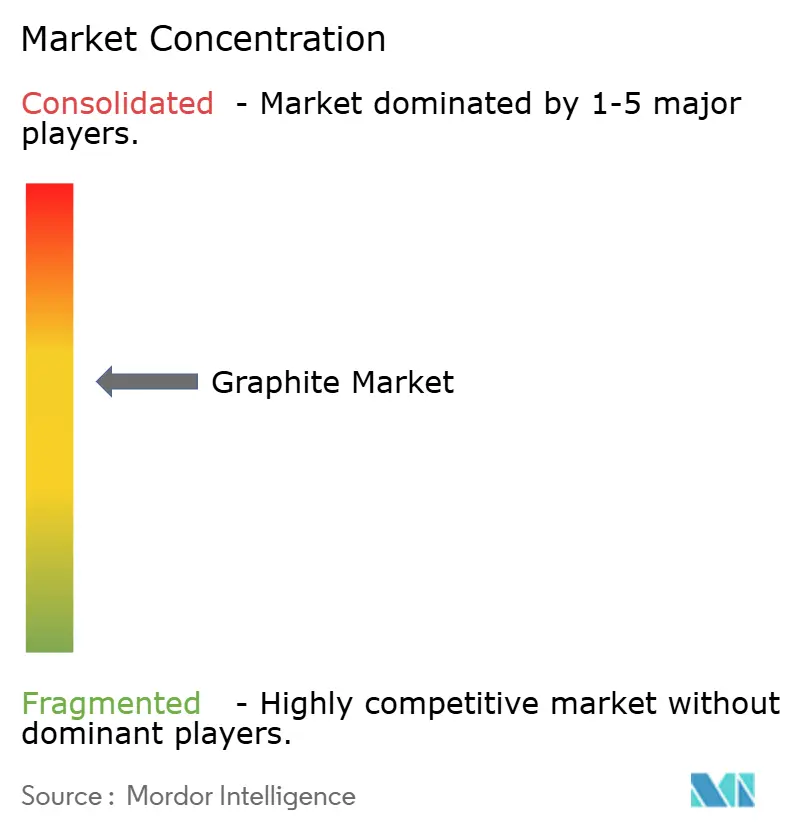
| Market Concentration | Medium |
Major Players *Disclaimer: Major Players sorted in no particular order Image © Mordor Intelligence. Reuse requires attribution under CC BY 4.0. | |
Graphite Market Analysis by Mordor Intelligence
The Graphite Market size is projected to be USD 5.73 billion in 2025, USD 6.30 billion in 2026, and reach USD 10.10 billion by 2031, growing at a CAGR of 9.91% from 2026 to 2031. This momentum is fueled by record capital spending on lithium-ion battery gigafactories, the shift toward electric-arc-furnace (EAF) steelmaking, and rising semiconductor demand for ultra-high-purity synthetic grades. Battery anode producers accelerated mine-to-anode integration to secure feedstock, while steelmakers locked in long-term electrode contracts to insulate against needle-coke shortages. Supply-chain re-routing after China’s 2023 export-licence regime triggered USD 1.8 billion of North American and European capacity announcements in 2025, underscoring a geographic rebalancing of the graphite market. Silicon-enhanced anodes threaten to trim graphite intensity in premium electric vehicles (EVs), yet the proliferation of cost-sensitive lithium-iron-phosphate (LFP) chemistries and the emergence of carbon-negative, bio-based synthetic routes keep long-term demand on an expansion trajectory.
Key Report Takeaways
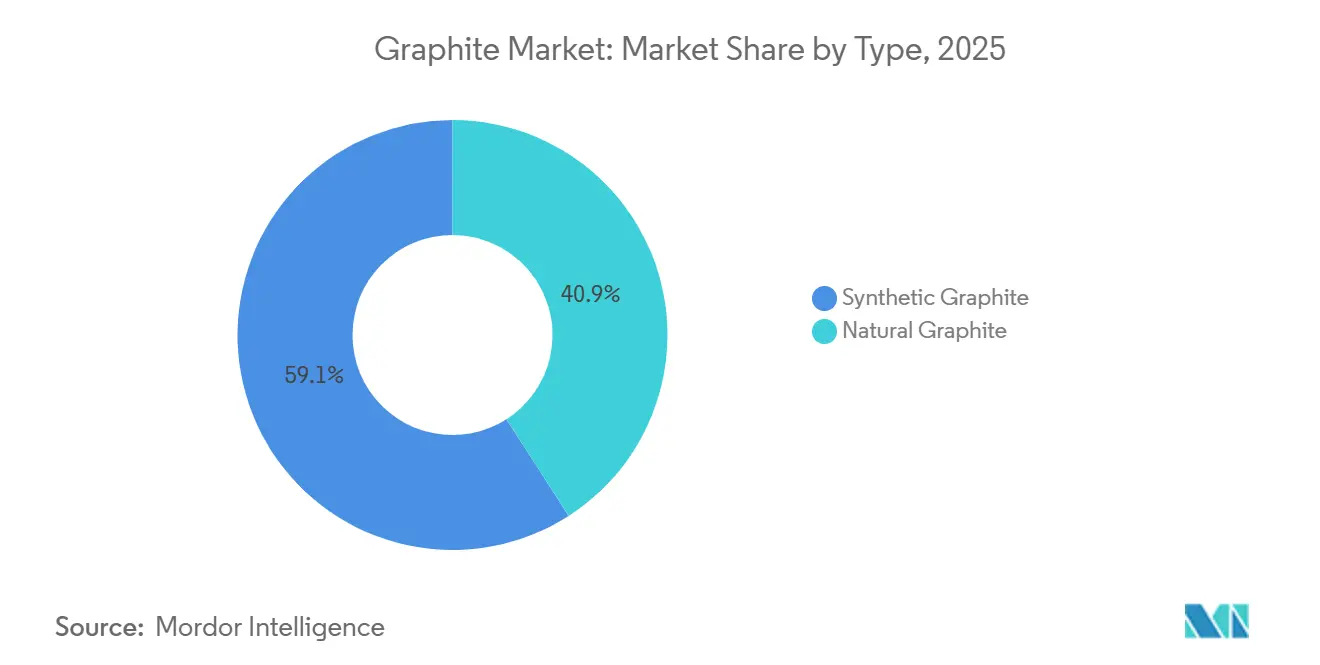
- By type, synthetic graphite led with 59.09% of the graphite market share in 2025. Natural graphite's market share is expected to grow with a CAGR of 12.29% during the forecast period (2026-2031).
- By application, batteries accounted for 40.98% of the graphite market size in 2025 and are advancing at a 17.94% CAGR through 2031.
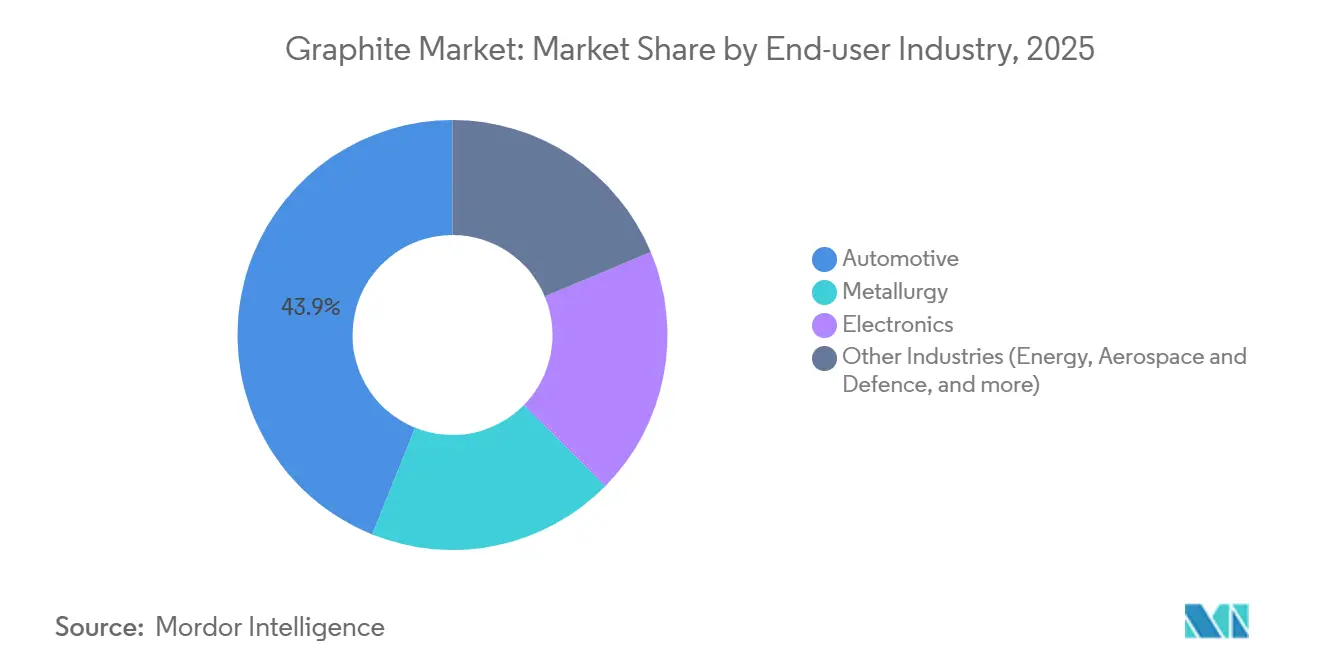
- By end-user industry, automotive held 43.91% share of the graphite market size in 2025, and is projected to expand at a 16.99% CAGR to 2031.
- By region, Asia-Pacific controlled 55.72% of 2025 revenue; the region is also forecast to grow at an 11.34% CAGR through 2031.
Note: Market size and forecast figures in this report are generated using Mordor Intelligence’s proprietary estimation framework, updated with the latest available data and insights as of January 2026.
Global Graphite Market Trends and Insights
Driver Impact Analysis
| Driver | (~) % Impact on CAGR Forecast | Geographic Relevance | Impact Timeline |
|---|---|---|---|
| Soaring Li-ion battery gigafactory build-outs | +3.80% | Global, with APAC core and North America spill-over | Medium term (2-4 years) |
| Expansion of electric-arc-furnace (EAF) steel capacity | +2.10% | APAC, Europe, North America | Long term (≥ 4 years) |
| Rising demand for ultra-high-purity synthetic graphite in the semiconductor industry | +1.40% | APAC (Japan, South Korea, Taiwan), North America | Medium term (2-4 years) |
| China's export-licence regime accelerating ex-China supply investments | +1.90% | North America, Europe, Australia | Short term (≤ 2 years) |
| Emergence of bio-based "green" synthetic graphite routes | +0.80% | Europe, North America | Long term (≥ 4 years) |
| Source: Mordor Intelligence | |||
Soaring Li-Ion Battery Gigafactory Build-Outs
Battery-grade graphite demand is set to triple from 900,000 t in 2024 to 2.7 million t by 2030 as new gigafactories add roughly 150 GWh of cell capacity each year[1]International Energy Agency, “Battery and Minerals Outlook 2025,” iea.org. BTR New Material added 120,000 t pa of anode output in 2025 to secure contracts with CATL and BYD. Vianode commissioned a 10,000 t pa synthetic-graphite plant in Norway, backed by EUR 150 million equity, targeting European buyers seeking non-Chinese supply. In the United States, Syrah Resources’ Vidalia facility reached 11,250 t pa by mid-2025 after winning a USD 220 million Department of Energy loan guarantee. LFP chemistries raise anode loading by 15%, offsetting silicon substitution risk in high-end cells.
Expansion of Electric-Arc-Furnace Steel Capacity
EAF steel will require 1.1 million t of graphite electrodes annually by 2030, up from 850,000 t in 2024, as decarbonization policies spur blast-furnace conversions. HEG Limited lifted capacity utilization to 72% in FY2025 to meet India’s infrastructure‐led steel demand. Graphite India added a 20,000 t pa ultra-high-power electrode line aimed at Southeast Asia and Middle East customers. Germany’s Salzgitter AG plans an EAF conversion that will add 8,000 t pa of electrode demand by 2029. Ultra-high-power electrodes carry a 30% price premium yet cut furnace energy use by 15%, improving steel-mill economics.
Rising Demand for Ultra-High-Purity Synthetic Graphite in Semiconductors
Advanced chip packaging needs thermal-interface materials exceeding 1,500 W/m-K, a specification met by ultra-high-purity synthetic graphite thinner than 50 µm. Tokai Carbon and Nippon Kokuen supplied 65% of this niche in 2025 by reducing ash below 5 ppm. TSMC’s Arizona fab consumes 120 t pa of high-purity graphite for CVD crucibles, while Intel’s Ohio complex will require about 200 t pa from 2027 onward. SGL Carbon’s SIGRAFLEX sheets captured 40% of the heat-spreader segment by dissipating 500 W TDP in sub-50 µm stacks. Despite volumes of only 15,000 t pa, price premiums of 5–8× battery-grade material create attractive margins for qualified suppliers.
China’s Export-Licence Regime Accelerating Ex-China Supply Investments
Beijing’s 2023 export-licensing requirements initially froze one-fifth of global graphite trade, but the selective suspension of permits in November 2025 spurred USD 1.8 billion of Western capacity announcements that year. Syrah Resources expanded Vidalia with U.S. federal backing to bypass Chinese processing. Northern Graphite restarted Ontario’s Bissett Creek mine to deliver 25,000 t pa of concentrate to Canadian anode lines. Vianode’s Norwegian facility pledges a 90% lower carbon footprint and a 10% cost advantage over Chinese producers. Although the controls temporarily boosted Chinese synthetic-graphite prices by 12% in Q1 2025, new Western supply moderated the spike by year-end.
Restraints Impact Analysis
| Restraint | (~) % Impact on CAGR Forecast | Geographic Relevance | Impact Timeline |
|---|---|---|---|
| Needle-coke feedstock bottlenecks for synthetic graphite | -1.20% | Global, acute in North America and Europe | Short term (≤ 2 years) |
| Stringent HF-emission regulations on purification lines | -0.90% | Europe, China, North America | Medium term (2-4 years) |
| Battery-anode silicon substitution eroding graphite intensity per kWh | -1.00% | North America, Europe, premium EV segments | Medium term (2-4 years) |
| Source: Mordor Intelligence | |||
Needle-Coke Feedstock Bottlenecks for Synthetic Graphite
Phillips 66 exited petroleum needle-coke production in 2024, erasing 180,000 t pa of capacity and tightening global supply by 15%. GrafTech’s Q1 2025 electrode shipments fell 22% as it struggled to source low-sulfur coke. Spot buyers saw an 18% price jump in H1 2025, while Japanese and Chinese majors secured multi-year coal-tar-pitch deals at a USD 500/t premium. Only a dozen refineries worldwide produce needle coke suitable for ultra-high-power electrodes, and none announced expansions after 2022. Blended feedstocks reduce electrode life by 10%, limiting their uptake in premium furnaces.
Battery-Anode Silicon Substitution Eroding Graphite Intensity per kWh
Sila Nanotechnologies’ Titan Silicon anode, first deployed in Mercedes-Benz EQG cells in 2025, replaced 20% of graphite while lifting volumetric energy density to 800 Wh/L[2]Sila Nanotechnologies Inc., “Titan Silicon performance brief,” silanano.com. Group14 Technologies scaled 2,000 t pa of SCC55 silicon-carbon composite capable of 30% silicon loading without swelling failures. IEA models show silicon blends reaching 35% of EV battery capacity by 2030, trimming graphite use from 0.9 kg/kWh to 0.7 kg/kWh fleet-wide. Yet cost-sensitive LFP packs remain graphite-heavy, and only 12% of 2025 EV models adopted silicon anodes. The substitution is therefore a moderating rather than destructive force.
Segment Analysis
By Type: Synthetic Dominance Faces Natural’s Resurgence
Synthetic graphite retained 59.09% of the graphite market share in 2025, thanks to its purity advantage in battery anodes and ultra-high-power electrodes. Natural grades, however, are forecast to expand at a 12.29% CAGR to 2031, lifted by lower costs in refractories, lubricants, and expandable-graphite products. Natural concentrate averaged USD 800–1,200/t in 2025 versus USD 4,500–6,500/t for battery-grade synthetic, a spread that encourages cost-conscious buyers. The graphite market size for natural graphite applications is therefore set to widen faster than synthetic, even if the latter keeps higher absolute revenues.
Production footprints are diverging. China, Japan, and South Korea still host 78% of synthetic capacity, yet North America and Europe added 60,000 t pa in 2025, improving supply security. Natural graphite draws strength from geographic diversity across Mozambique, Tanzania, Madagascar, and Brazil, whose combined reserves exceed 100 million t. Energy-intensive graphitization subjects synthetic producers to carbon-pricing risk, whereas natural processing consumes one-fifth of the electricity per tonne and increasingly benefits from renewable-powered beneficiation plants.
Note: Segment shares of all individual segments available upon report purchase
By Application: Batteries Outpace Electrodes and Refractories
Batteries absorbed 40.98% of 2025 demand and will grow at a robust 17.94% CAGR through 2031 as EV output targets 30 million units and stationary storage reaches 500 GWh. The graphite market size for batteries alone is expected to top USD 6 billion by the end of the decade, more than doubling 2026 levels. Electrodes for EAF steel will expand, reflecting both steel-market cyclicality and advances in electrode reuse technologies.
Refractory bricks, casting facings, and foundry applications will advance as aluminum and magnesium smelters adopt graphite-bonded linings resistant to 1,800°C melts. Lubricants and friction modifiers’ progress will be fueled by aerospace and heavy-machinery demand. Thermal-management materials, though a smaller volume segment, will surge on the back of data-center processors and high-power EV inverters that dissipate over 300 W/cm². Collectively, non-battery uses remain vital for market balance, cushioning suppliers when EV sales fluctuate.
By End-User Industry: Automotive Leads, Electronics Accelerates
Automotive accounted for 43.91% of 2025 demand, the largest graphite market share among end users, and is projected to expand at a 16.99% CAGR through 2031 as larger 75 kWh battery packs and silicon-carbide inverters become standard equipment. Electronic, spanning semiconductors, consumer devices, and data-center hardware, is set for growth, propelled by AI accelerators that require graphite heat spreaders able to manage 500 W thermal design powers. The segment’s center of gravity lies in Japan, South Korea, and Taiwan, which together host 70% of global semiconductor packaging capacity and consume about 15,000 t pa of ultra-high-purity synthetic graphite.
Metallurgy will grow at a more measured CAGR, as EAF steel and aluminum smelting expand but face competition from faster-growing automotive and electronics uses. Energy applications, including grid batteries, fuel cells, and nuclear reactors, are forecast to advance with the support of 200 GWh of stationary storage additions that require graphite felt electrodes at 99.9% purity. Aerospace and defense will post a substantial CAGR because satellite thermal-control panels and hypersonic-vehicle nose cones exploit graphite’s >1,500 W/m-K conductivity and ablation resistance. These specialized grades command prices 10–15 × commodity levels, drawing specialty suppliers such as SGL Carbon and Mersen into the segment. The combined pull of electrified transport, AI-driven compute, and renewable-energy storage is therefore steering demand toward high-purity synthetic grades and raising the technical entry bar for newcomers lacking purification expertise.
Note: Segment shares of all individual segments available upon report purchase
Geography Analysis
Asia-Pacific controlled 55.72% of 2025 revenue and is forecast to grow at an 11.34% CAGR through 2031. China commissioned 1.2 million t pa of new synthetic capacity between 2024 and 2025 to serve CATL and BYD. Japan and South Korea account for 65% of semiconductor-grade output, exporting 12,000 t pa of ultra-high-purity material to TSMC, Samsung, and Intel fabs. India’s electrode producers raised utilization to 72% in FY2025 to meet domestic EAF steel growth. The graphite market size in Asia-Pacific, therefore, remains anchored by integrated supply chains spanning mines, anode plants, and downstream gigafactories.
North America’s market share is projected to expand, propelled by USD 1.2 billion of 2025 investments aimed at domestic anode independence. Syrah’s Vidalia plant hit 11,250 t pa in 2025 and targets 40,000 t pa by 2028. NOVONIX secured a USD 150 million Department of Energy grant to build a 30,000 t pa synthetic facility in Tennessee that will come online in 2027. Canada’s Bissett Creek mine restarted in 2024 to supply 25,000 t pa of concentrate, and Tesla’s upcoming Monterrey gigafactory in Mexico will need 8,000 t pa of anode material by 2027. Needle-coke scarcity remains the region’s largest constraint since Phillips 66’s 2024 exit removed a local feedstock source.
Europe will register growth, led by Norway’s Vianode plant, which raised EUR 150 million in March 2025 to scale from 10,000 t pa to 50,000 t pa by 2030. Sweden’s Talga Group secured a EUR 150 million European Investment Bank loan to expand its Vittangi natural-graphite project to 19,500 t pa by 2027, achieving a 1.2 kg CO₂/kg footprint using hydropower. Germany’s SGL Carbon and France’s Mersen added a combined 5,000 t pa of specialty-graphite capacity for semiconductors and aerospace. The EU’s Carbon Border Adjustment Mechanism, phased in from 2026, tilts demand toward low-emission graphite and EAF steel. Nordic suppliers leverage cheap renewables and proximity to European gigafactories to carve a green niche in the graphite market.
Competitive Landscape
The graphite market is moderately consolidated. In natural graphite, more than 40 miners and processors vie for contracts, with Syrah Resources, Northern Graphite, and Talga Group among the leaders. Vertical integration is the dominant strategy: BTR’s 2024 purchase of Mozambique flake operations cut its raw-material costs by 18%, while Vianode’s low-temperature synthesis aims to underprice Chinese output by 10% once fully scaled. Smaller players like Mason Graphite and Triton Minerals target expandable graphite and refractory niches where scale advantages are less decisive.
Graphite Industry Leaders
GrafTech International
SGL Carbon
BTR New Material Group Co., Ltd.
Shanghai Shanshan Technology Co., Ltd.
Syrah Resources Limited
- *Disclaimer: Major Players sorted in no particular order
Recent Industry Developments
- April 2025: Imerys introduced SU-NERGY, an industrial-scale graphite solution that cuts CO₂ emissions by up to 60% versus conventional grades. The launch illustrates how process innovation directly improves customers’ Scope 3 emissions disclosure while widening Imerys’ specialty-materials portfolio.
- July 2024: Graphit Kropfmühl partnered with BASF to access renewable-energy certificates for its Hauzenberg plant in Germany. The agreement lowers the site’s graphite carbon footprint by at least 25%, enabling customers to meet EU battery passport requirements ahead of schedule.
Research Methodology Framework and Report Scope
Market Definitions and Key Coverage
Our analysis treats the graphite market as the value generated from natural and synthetic graphite sold in bulk or processed forms for batteries, refractories, electrodes, foundry additives, lubricants, and other industrial uses across all end-user industries in 2025.
Specialty downstream products such as carbon fibers, graphene, and diamond-like carbon coatings are not included, as their supply chains, pricing logic, and demand pools differ materially from bulk graphite.
Segmentation Overview
- By Type
- Natural Graphite
- Synthetic Graphite
- By Application
- Electrodes
- Refractories, Casting and Foundries
- Batteries
- Lubricants
- Other Applications (Thermal Management Materials, Friction Products and Brake Linings,etc.)
- By End-user Industry
- Metallurgy
- Electronics
- Automotive
- Other Industries (Energy, Aerospace and Defence, etc.)
- By Geography
- Asia-Pacific
- China
- India
- Japan
- South Korea
- ASEAN Countries
- Rest of Asia-Pacific
- North America
- United States
- Canada
- Mexico
- Europe
- Germany
- United Kingdom
- France
- Italy
- Spain
- NORDIC Countries
- Rest of Europe
- South America
- Brazil
- Argentina
- Rest of South America
- Middle-East and Africa
- Saudi Arabia
- United Srab Emirates
- Egypt
- South Africa
- Rest of Middle-East and Africa
- Asia-Pacific
Detailed Research Methodology and Data Validation
Primary Research
Mordor analysts interviewed graphite miners, anode material processors, EAF operators, battery cell makers, and regional distributors across Asia-Pacific, North America, and Europe. These conversations clarified purity premia, contract tenure, and end-use splits, filling data gaps and confirming desk-research assumptions before we finalized the model.
Desk Research
We compiled baseline demand and trade clues from tier-one, public sources such as the US Geological Survey (mine output), UN Comtrade (HS 2504, 3801 flows), the World Steel Association (EAF steel tonnage), and the International Energy Agency (EV battery uptake). Company 10-Ks, patent filings retrieved through Questel, and statistics from the China Non-Metallic Minerals Industry Association added context on capacity shifts and technology routes. Subscription databases, including D&B Hoovers for producer revenues and Dow Jones Factiva for price news, helped us cross-check volumes and average selling prices. The above list is illustrative; many additional open datasets were reviewed to validate numbers and trends.
Market-Sizing & Forecasting
We start with a top-down build that reconstructs apparent consumption by aligning mined output, synthetic production, and net trade, followed by sampled ASP × volume checks for electrodes and battery anodes to sense-check totals. Key variables include EV battery gigawatt-hour additions, EAF steel share, needle-coke price shifts, flake-to-spherical conversion yields, and regional capacity additions. A multivariate regression, supplemented by scenario analysis for EV adoption rates, projects these drivers through 2030. Bottom-up supplier roll-ups adjust country-level anomalies.
Data Validation & Update Cycle
Before release, two senior reviewers audit variance flags and triangulate our totals with independent price indices; any outlier triggers re-contact with sources. Reports refresh annually, and interim updates occur when material events, such as export curbs or demand shocks, emerge.
Why Mordor's Graphite Baseline Commands Reliability
Published estimates vary because firms choose different product mixes, purity thresholds, and battery adoption scenarios.
Key gap drivers include some publishers folding graphite electrodes into the wider carbon products universe, others applying aggressive EV penetration or using list prices rather than transaction averages, and refresh cadences differing, leading to currency-conversion drift.
Benchmark comparison
| Market Size | Anonymized source | Primary gap driver |
|---|---|---|
| USD 5.73 B (2025) | Mordor Intelligence | - |
| USD 15.67 B (2024) | Global Consultancy A | Includes carbon fibers, applies list prices |
| USD 20.85 B (2023) | Trade Journal B | Combines graphite with refractory ceramics; older FX rates |
These comparisons show that Mordor's clear scope boundaries, annual refresh, and mixed-method validation deliver a transparent, repeatable baseline that decision-makers can trust.
Key Questions Answered in the Report
How fast is demand for graphite in EV batteries growing?
Battery anodes are forecast to rise at a 17.94% CAGR during 2026-2031 as global EV output targets 30 million units.
Which region leads graphite production and consumption?
Asia-Pacific holds 55.72% of 2025 revenue, keeping it the dominant node for both supply and demand.
How will silicon impact future graphite usage in batteries?
Silicon-blended anodes could lower graphite intensity from 0.9 kg/kWh to 0.7 kg/kWh by 2030, but graphite remains dominant in cost-sensitive LFP cells.
Which companies are pioneering low-carbon graphite production?
Vianode, Talga Group, and Levidian are scaling processes that cut cradle-to-gate emissions by 40%–100% versus conventional synthetic routes.
What is current market size of Graphite market?
What is the current market size of the graphite market?


