
Tanzania Grains Market Analysis by Mordor Intelligence
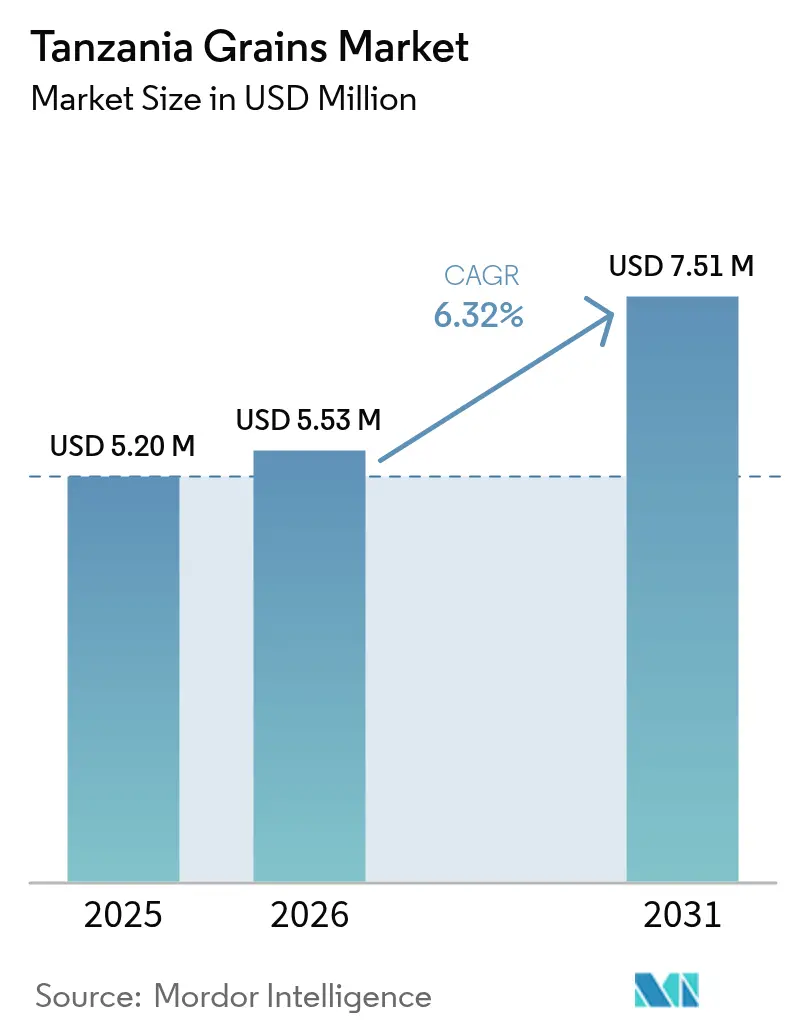
Tanzania grains market size in 2026 is estimated at USD 5.53 million, growing from 2025 value of USD 5.20 million with 2031 projections showing USD 7.51 million, growing at 6.32% CAGR over 2026-2031. Robust public buying programs, expanded fertilizer subsidies, and widening contract-farming models position the market for sustained expansion, even as storage gaps and credit constraints temper price realization. Brewer-led contract farming now absorbs 17,000 metric tons of barley and sorghum each year, embedding quality standards and predictable pricing into formerly fragmented chains. Warehouse-receipt financing is unlocking working capital for smallholders, although climate volatility remains a headwind, with the United States Department of Agriculture (USDA) indicating a dip in 2025/26 maize output.
Key Report Takeaways
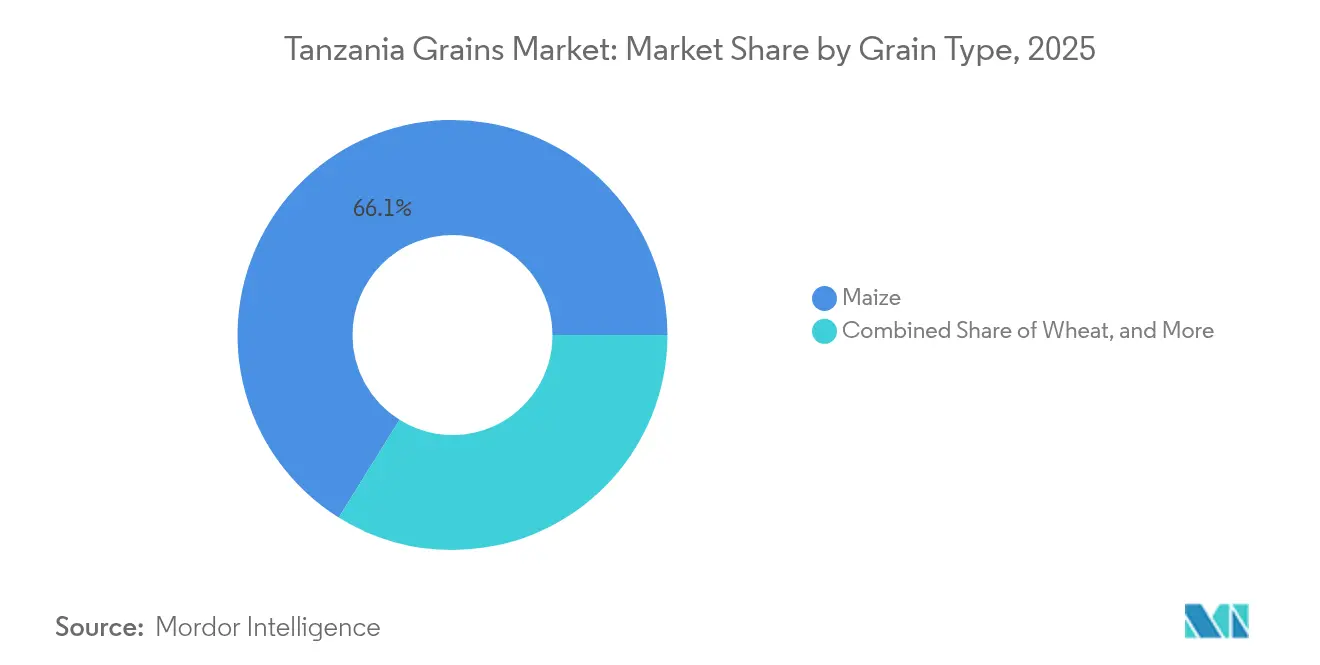
- By grain type, maize led with 66.12% of the Tanzania grains market share in 2025. Wheat is forecast to expand at a 7.78% CAGR from 2026 to 2031, the fastest among all grain categories.
Note: Market size and forecast figures in this report are generated using Mordor Intelligence’s proprietary estimation framework, updated with the latest available data and insights as of 2026.
Tanzania Grains Market Trends and Insights
Drivers Impact Analysis*
| Driver | (~) % Impact on CAGR Forecast | Geographic Relevance | Impact Timeline |
|---|---|---|---|
| Rising consumption of cereal-based foods | +1.2% | National, concentrated in Dar es Salaam, Mwanza, and Arusha | Medium term (2-4 years) |
| Government initiatives for staple-crop self-sufficiency | +1.4% | National, emphasis on the Southern Highlands and Lake Zone | Long term (≥ 4 years) |
| Growing demand for animal feed | +0.9% | National, strongest in peri-urban dairy and poultry clusters | Medium term (2-4 years) |
| Expanding adoption of warehouse-receipt financing | +0.6% | National, early gains in Dodoma, Singida, and Iringa | Long term (≥ 4 years) |
| Contract farming by beverage companies | +0.5% | Northern Highlands (Manyara, Karatu, and Monduli) | Short term (≤ 2 years) |
| Climate-resilient seed varieties uptake | +0.8% | National priority in semi-arid zones | Medium term (2-4 years) |
| Source: Mordor Intelligence | |||
Rising Consumption of Cereal-Based Foods
Urban population growth and dietary changes are lifting per-capita cereal intake. A 66% increase in national cereal output between the 2022/23 and 2023/24 seasons was largely absorbed domestically, resulting in smaller exportable surpluses [1]. The mandatory fortification of maize and wheat flour, effective March 2025, addresses micronutrient deficiencies that affect 33% of children under five and 37% of women of reproductive age, thereby anchoring fortified products in school feeding programs [2]. Rice prices in Dar es Salaam increased from USD 0.82 per kilogram in April 2022 to USD 0.86 per kilogram in February 2025, underscoring steady urban demand. The alignment of nutrition policy, urbanization, and income gains keeps processed grains in consumer baskets.
Government Initiatives For Staple-Crop Self-Sufficiency
The maize procurement target of 700,000 metric tons for the fiscal year 2024/25 aims to stabilize prices and support smallholder farmers' incomes. In January 2025, the National Food Reserve Agency procured 72,000 metric tons, utilizing regional aggregators to distribute funds. The fertilizer subsidies amounting to TZS 151 billion (USD 58 million) in 2024 contributed to increased yields in the Southern Highlands and Lake Zone. Additionally, the agriculture budget has tripled over four years, reaching TZS 1.379 trillion (USD 530 million). The Food Self-Sufficiency Ratio stood at 128 in 2023/24, and the storage capacity remains limited to 360,000 metric tons, significantly below the target of 3 million metric tons. This shortfall leads to local surpluses, exerting downward pressure on prices and encouraging unrecorded exports.
Growing Demand For Animal Feed
Livestock intensification reshapes grain demand. The World Bank estimates that USD 546 million is needed to modernize Tanzania’s cattle, poultry, and dairy value chains, which support 36.6 million heads of cattle. Commercial fish-feed output jumped from 1,182 metric tons in 2021 to 6,211 metric tons in 2023, although 74% of raw materials are still imported, exposing feed millers to currency swings. Breweries source 17,000 metric tons of local grains annually under fixed-price contracts, signaling structured off-take that ripples upstream. Demand from dairy, poultry, and aquaculture clusters in Dar es Salaam, Mwanza, and Arusha is set to grow.
Expanding Adoption of Warehouse-Receipt Financing
The Tanzania Mercantile Exchange now accepts maize and rice warehouse receipts, allowing stored grain to secure short-term loans. A Memorandum of Understanding (MoU) signed in 2024 with Zambia, Malawi, and Zimbabwe harmonizes standards and lowers lender risk. The United States Agency for International Development (USAID) and the Eastern Africa Grain Council launched a three-year program that positions Tanzania as a surplus supplier to Kenya using the same instrument. The World Bank’s USD 95 million Financial Sector Transformation and Growth Project channels lines of credit through local banks, and digital reverse-factoring tools aim to reach 1,000 agribusinesses.
Restraints Impact Analysis*
| Restraint | (~) % Impact on CAGR Forecast | Geographic Relevance | Impact Timeline |
|---|---|---|---|
| Incidence of pests and diseases | -0.7% | National, acute in maize belt and rice-growing zones | Short term (≤ 2 years) |
| Limited access to affordable credit | -0.5% | National, pronounced in smallholder regions | Medium term (2-4 years) |
| Post-harvest storage losses | -0.6% | National, the highest in remote districts | Medium term (2-4 years) |
| Weather-induced production volatility | -0.4% | National, concentrated in semi-arid and rain-fed areas | Short term (≤ 2 years) |
| Source: Mordor Intelligence | |||
Incidence of Pests and Diseases
The Fall Armyworm reduces maize yields by up to 54%, while aflatoxin levels have spiked to 162.40 µg/kg in some districts, exceeding the 10 µg/kg East African ceiling [3]. Tanzania lies within the maize lethal necrosis belt, where dual infections drain USD 291-339 million from East African output annually. The Larger Grain Borer consumes 20-50% of grain in traditional stores, although hermetic bags curb losses and are scaling up under donor funding. Resistant hybrids and biocontrol agents such as Telenomus remus are spreading, yet adoption is incomplete, shaving 0.7% points off growth in the short term.
Limited Access to Affordable Credit
Morogoro research suggests credit could raise yields by 15.09%, but 17% interest rates under the Small Industries Development Organization (SIDO) Credit Guarantee Scheme still deter uptake. The African Development Bank’s USD 129.71 million youth agribusiness loan and the United States Agency for International Development (USAID) are USD 83 million corporate support skew toward established players, leaving smallholders underserved. VisionFund enrolled 7,000 farmers in bundled credit-insurance pilots covering 21,000 hectares, but has not reached scale. This funding gap reduces growth until digital lending and receipt-based finance expand their outreach.
*Our forecasts treat driver/restraint impacts as directional, not additive. The impact forecasts reflect baseline growth, mix effects, and variable interactions.
Segment Analysis
By Grain Type: Maize Dominance Masks Wheat’s Import-Substitution Surge
Maize anchors demand with 66.12% of the Tanzania grains market share in 2025. The Ministry of Agriculture logged a large volume of maize in the 2023/24 season, driven by subsidies and favorable rainfall. The government’s 700,000 metric ton procurement target signals ongoing policy support, even as spot prices remain the lowest in East Africa. Drought-tolerant hybrids sustain yields and raise export competitiveness, strengthening the Tanzania grains market.
A faster-growing wheat segment posts an 7.78% CAGR forecast through 2031, although current output is only 80,000 metric tons. A USD 40 million Moshi malting plant now demands 25,000 metric tons of local barley each year, a seven-fold jump on historic volumes. Excise incentives and heat-tolerant varieties that mature in 90 days help shorten the import gap and underscore wheat’s role in future Tanzania grain market size expansion. Rice output remains steady at 2.51 million metric tons milled, backed by Direct-Seeded Rice, while sorghum and millet occupy drought-resilient niches and anchor regional exports.

Geography Analysis
Production clusters in the Southern Highlands, specifically Iringa, Mbeya, and Rukwa, supply maize and wheat to the domestic market. The Lake Zone, Mwanza, Shinyanga, and Kagera regions add maize and rice, while Morogoro and Kilombero in the coastal plains focus on rice cultivation. A Food Self-Sufficiency Ratio of 128 in 2023/24 confirms net-export status within the East African Community. Kenya’s maize imports from Tanzania decreased in 2022/23 following export curbs, illustrating the policy swings that shape the Tanzanian grains market.
In 2024, the Tanzania Mercantile Exchange integrated its warehouse-receipt systems with those of Zambia, Malawi, and Zimbabwe, enabling cross-border settlements that mitigate lender risk and enhance liquidity. The Northern Highlands districts, including Manyara, Karatu, and Monduli, are becoming key centers for barley production through contract farming, promoting regional specialization. Urban centers such as Dar es Salaam, Mwanza, and Arusha drive demand, with rice prices remaining at USD 0.86 per kg in 2025, indicating a stable value chain that supports the growth of the Tanzania grains market.
Remote districts still lose up to 50% of stored grain to pests and moisture. Hermetic bags and metal silos are gaining popularity, supported by donor distributions. Uneven adoption continues to keep post-harvest losses high. Government plans to hit 3 million metric tons of storage by 2030 aim to reduce volatility and promote formal trading, stabilizing the Tanzania grains market size.
Regulatory Landscape
Tanzania's grains market is governed under the Cereals and Other Produce Act, 2009, which established the Cereals and Other Produce Board (CPB) to regulate and promote cereals and other produce trade, alongside oversight from the Ministry of Agriculture and implementing agencies including the Tanzania Bureau of Standards (TBS) and the Tanzania Plant Health and Pesticides Authority (TPHPA). For processed staples, mandatory fortification of maize and wheat flour took effect in March 2025, increasing compliance requirements for millers and tightening quality control in formal channels.
Trade administration also shapes how grains move across borders and into formal domestic markets through import and export controls, grading requirements, and food safety standards. The Standards (Imports Registration and Batch Certification) (Amendment) Regulations, 2025 tightened import documentation stringency, including pre-shipment submission timelines and non-compliance penalties, while Tanzania applies the EAC common external tariff framework for grains sourced outside the bloc. Public market interventions remain central, with the National Food Reserve Agency (NFRA) using procurement-based price stabilization and, in February 2025, communicating coordination initiatives with other crop regulatory bodies to support exports and compliance.
Value Chain Analysis
The grains value chain in Tanzania runs from inputs (seed, fertilizer, and crop protection) and smallholder-dominant production through aggregation, storage, trading, milling and processing, and distribution into retail, institutional buyers, feed millers, and industrial off-takers such as breweries. Public and parastatal actors influence the chain through structured buying and storage, notably NFRA procurement and the CPB's market-access mandate, while large private millers and traders connect producing zones including the Southern Highlands and the Lake Zone with urban demand centers such as Dar es Salaam, Mwanza, and Arusha.
Storage and trade formalization are key inflection points. Post-harvest losses remain material, commonly cited at 30-40% for cereals, which limits value realization where drying, handling, and pest control are weak. Warehouse-receipt systems and the Tanzania Mercantile Exchange's acceptance of maize and rice receipts support working-capital access and price discovery. At the same time, regulatory digitization is changing trade workflows, as COPRA transitioned mandatory processing of grain import and export permits to the Tanzania Revenue Authority's TANCIS Single Window System effective 21 December 2025. Capacity additions, including NFRA's silo complex inaugurated in Babati District (Manyara) in August 2024 and private-sector silo investments, directly affect aggregation and storage bottlenecks that determine throughput to mills and export channels.
Competitive Landscape
The Tanzania grains market exhibits moderate concentration. Thousands of community mills still supply local zones, but March 2025 fortification rules threaten to halve their number by December 2025, channeling volume toward capitalized incumbents that can finance dosifier upgrades. Bakhresa budgeted USD 500 million for a new Dar es Salaam soft-drinks and malt line, set to be operational in 2026, signaling revenue diversification and capacity expansion. Mohamed Enterprises added rail-linked grain silos in Dodoma in 2024, increasing storage capacity to 120,000 metric tons and reducing inland freight by 18%. National Milling, meanwhile, automated its Dar es Salaam plant in mid-2025, lifting wheat-flour output by 15% without expanding floor space.
Opportunities for growth are focused on warehouse-receipt financing and contract farming. In 2024, the Tanzania Mercantile Exchange signed a memorandum of understanding with regional platforms in Zambia, Malawi, and Zimbabwe to harmonize standards and facilitate cross-border trading. This initiative aims to reduce counterparty risk for lenders and improve liquidity for smallholders. Tanzania Breweries and Serengeti Breweries collectively procure 17,000 metric tonnes of grains annually through contract-farming arrangements, incorporating quality specifications that influence upstream seed and agrochemical markets. Additionally, in April 2024, the International Finance Corporation approved a contract-farming framework designed to mitigate risks for smallholder participation.
Digital matchmaking platforms such as the Micro, Small, and Medium Enterprises (MSME) Financing Gateway enlisted 40 lenders and 20 advisers in November 2024, creating a pipeline for millers that need working capital to meet fortification and storage norms. Serengeti Breweries mirrored the model in 2025 by scaling sorghum purchases under floor-price agreements, providing revenue certainty that shores up upstream seed and fertilizer demand. These strategic moves, plus tightening regulation and fintech innovation, are gradually raising entry barriers and nudging the sector toward a moderately consolidated structure.
Market Opportunities and Future Outlook
Opportunities are concentrated in expanding formal storage, structured trading, and compliant processing as public procurement and standards tighten. NFRA's continued role as a major buyer and buffer-stock operator, including a publicly stated plan to procure 1.2 million tonnes of cereals for the 2026/27 fiscal year, creates clearer off-take signals for aggregators, warehouse operators, and logistics providers. This also increases the addressable need for drying, grading, and quality-assured storage. In parallel, the government's storage ambition to reach 3 million tonnes of reserve capacity by 2030 leaves room for commercial silo projects, warehouse-receipt service providers, and collateral-management operators that can reduce distress sales and improve bankability.
Upstream and midstream upgrading also creates actionable whitespace. The Agriculture budget focus around the Building a Better Tomorrow (BBT) programme, with the 2026/27 allocation cited at Sh1.1 trillion, supports demand for inputs, mechanization services, and extension-linked delivery models that connect farmers to predictable markets. Contracting models that already anchor beverage off-take and the ACCELERATE program (2023-2026), which uses grain traders as seed-system anchors, provide evidence of demand-pull approaches that can be applied for sorghum and other cereals. On the processing side, March 2025 fortification requirements keep investment focused on dosifier upgrades, quality labs, and compliant packaging and traceability, favoring operators that can integrate procurement, testing, and branded distribution at scale.
Recent Industry Developments
- July 2026: Mohammed Enterprises Tanzania Limited (MeTL) finalized a procurement and construction agreement with AGI EMEA to install modern grain storage silos and handling equipment at its Bandari facility. The upgrade strengthens MeTL's ability to aggregate grain more consistently and reduces handling losses, supporting higher-throughput supply into domestic processing and trading channels.
- June 2026: The National Food Reserve Agency (NFRA) unveiled a plan to procure 1.2 million tonnes of cereals during the 2026/27 fiscal year, with the purchasing season communicated to open in mid-July 2026. The larger public buying program increases market liquidity during harvest periods and reinforces demand for compliant storage, grading, and coordinated aggregation.
- April 2024: Tanzania Breweries Limited (TBL) partnered with the International Finance Corporation (IFC) and the Cereals and Other Produce Regulatory Authority (COPRA) to advance a contract-farming framework linked to agricultural financing. The initiative strengthens structured off-take and compliance-led sourcing, encouraging upstream investment in quality specifications and more reliable smallholder participation.
Research Methodology Framework and Report Scope
Market Definition and Coverage
This market covers the value generated from cereal grains traded and consumed in Tanzania, tracked through domestic supply and demand and adjusted for imports, exports, and observed price movements across the year.
Scope exclusions: Excludes oilseeds and pulses, and it also excludes downstream processed foods where grains are only an ingredient.
Segmentation Overview
- By Grain Type
- Maize
- Production Analysis (Volume)
- Consumption Analysis (Value and Volume)
- Import Analysis (Value and Volume)
- Export Analysis (Value and Volume)
- Price Trend Analysis
- Rice
- Production Analysis (Volume)
- Consumption Analysis (Value and Volume)
- Import Analysis (Value and Volume)
- Export Analysis (Value and Volume)
- Price Trend Analysis
- Sorghum
- Production Analysis (Volume)
- Consumption Analysis (Value and Volume)
- Import Analysis (Value and Volume)
- Export Analysis (Value and Volume)
- Price Trend Analysis
- Wheat
- Production Analysis (Volume)
- Consumption Analysis (Value and Volume)
- Import Analysis (Value and Volume)
- Export Analysis (Value and Volume)
- Price Trend Analysis
- Other Cereals
- Production Analysis (Volume)
- Consumption Analysis (Value and Volume)
- Import Analysis (Value and Volume)
- Export Analysis (Value and Volume)
- Price Trend Analysis
- Maize
Data Sources, Market Sizing, and Validation
Desk Research
Desk work starts with building a clean fact base on production, trade, and consumption indicators for major cereals. We typically refer to public sources such as FAOSTAT, UN Comtrade, the Tanzania National Bureau of Statistics, the Bank of Tanzania, and ministry level agriculture publications that provide area, yield, output, and price context.
From there, time series are aligned to the study years so price and volume are not mixed across different harvest cycles. Company annual reports, importer and exporter disclosures, association updates, and trusted news coverage are also reviewed to understand procurement patterns, storage constraints, and policy changes. In a few spots, paid subscriptions for company financials and shipment level import export data are used to sanity check trade flows and participant scale. This list is illustrative only, and many other public references were also used for data collection, cross checks, and clarification.
Primary Interviews and Surveys
Interviews and surveys with Tanzanian farmers, traders, millers, importers, distributors, and food-industry managers clarify production costs, local buying prices, stock movement, import timing, and changes in demand within Tanzania. Respondent input is used to fill gaps in public production and trade data. Analysts compare conflicting answers with observed Tanzanian price and trade series before finalizing assumptions.
Distribution of primary research fieldwork respondents
| Company type | Respondent position |
|---|---|
| Top tier: 25% | CXOs: 15% |
| Mid tier: 55% | Functional/Unit leaders: 35% |
| Smaller Players: 20% | Managers: 50% |
Market-Sizing & Forecasting
Sizing is built using a top-down approach where national production and trade data are reconstructed into an apparent consumption pool, and then converted into value using observed price series by crop. We keep the logic practical by focusing on measurable items, such as planted area and yield trends, post-harvest loss ranges, import dependence for wheat and rice, exportable surplus for maize in stronger seasons, and seasonal price spreads between harvest and lean months.
Selective bottom-up approximations are used as a check, based on sampled trader and aggregator throughput, channel checks on warehouse and transport capacity utilization, and indicative price per ton ranges shared by market participants. When gaps exist, like incomplete reporting from informal trade, we apply conservative adjustment factors that are validated through multiple interviews and then stress tested against total food demand signals.
Forecasts are produced using scenario analysis tied to rainfall and yield expectations, policy and tariff direction, currency movement that affects import parity, and expected changes in storage and market access. The final forecast path is only accepted after the key variables look consistent with what interviewees expect to see on the ground over the next few seasons.
Data Validation & Update Cycle
Validation is done by triangulating the value output against independent indicators, including volume plausibility checks, price range checks, and consistency with trade balances. If a year shows an unusual jump, the drivers are unpacked, and the relevant assumptions are reworked before the model is signed off through internal analyst review steps.
The dataset and model are refreshed annually so the base year rolls forward with the latest available official statistics. Interim updates are triggered when material events occur, such as major policy moves on grain trade, abnormal weather seasons, or clear price shocks, and a fresh pre-delivery review is completed so clients receive the most current view.
Mordor Intelligence's Tanzania Grains Market Estimate Compared With Other Published Estimates
Published market sizes for grains in Tanzania can look far apart because the underlying definitions do not match, even when the titles sound similar. The biggest swings usually come from what products are counted, what price point is used, and whether the value is treated as a food supply market or a narrower cereals demand pool.
Some sources expand the scope to include pulses or wider distribution channel value capture, and they may also apply consumer price levels that inflate the value. For Mordor Intelligence, only cereal grains are counted and the value is reconciled to production, imports, exports, and crop level price series so the market total stays linked to measurable grain flows.
Benchmark comparison
| Source | Market Size | Gaps in Research Methodology |
|---|---|---|
| Mordor Intelligence | USD 5.53 M (2026) | |
| Global Consultancy A | USD 6.70 B (2024) | Uses a broader framing that mixes multiple end uses and channels and reports value closer to the full food supply market, which can push the total far above a cereals-only, flow-validated calculation. |
| Regional Consultancy B | USD 6.70 B (2024) | Includes additional crop groups such as pulses and leans on a generalized current valuation statement, with limited visible linkage to annual production and trade balancing for cereals in Tanzania. |
The comparison shows that the spread is mainly created by scope and price point choices, not just growth assumptions. By keeping the model tied to crop level volume signals and price series, the estimate remains easier to audit, and the steps can be repeated when new production and trade data gets released.
Key Questions Answered in the Report
What is the 2026 value of the Tanzania grains market?
The market stands at USD 5.53 million in 2026 and is projected to reach USD 7.51 million by 2031.
Which grain holds the largest share?
Maize accounts for 66.12% of Tanzania grains market share in 2025.
What growth rate is projected for wheat?
Wheat is forecast to post an 7.78% CAGR between 2026 and 2031.
How will the fortification rule affect small mills?
More than 3,000 small mills must install micronutrient dosifiers by December 2025 or exit, pushing volume toward compliant operators.
Why is warehouse-receipt financing important?
It lets farmers pledge stored grain for loans, improving cash flow and reducing the need for distress sales.
What climate-smart seeds are available?
DroughtTEGO maize hybrids and heat-tolerant wheat lines yield better under stress and are scaling through public-private trials.