GPU As A Service Market Size and Share
Market Overview
| Study Period | 2020 - 2031 |
|---|---|
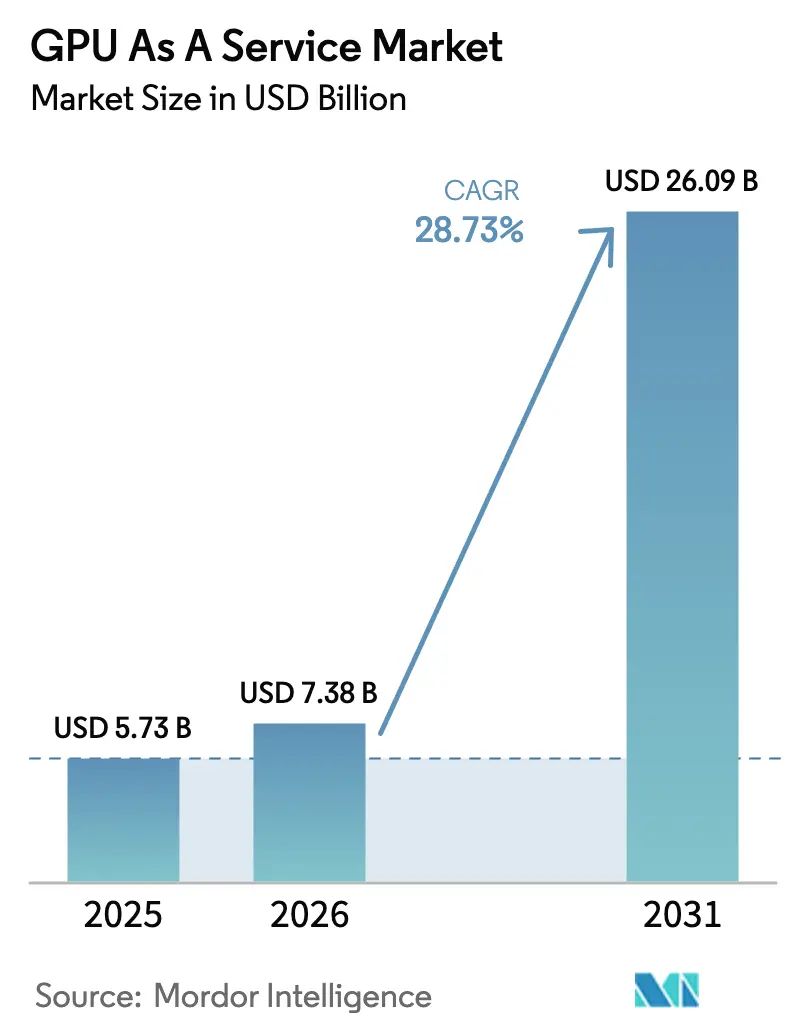
| Market Size (2026) | USD 7.38 Billion |
| Market Size (2031) | USD 26.09 Billion |
| Growth Rate (2026 - 2031) | 28.73% CAGR |
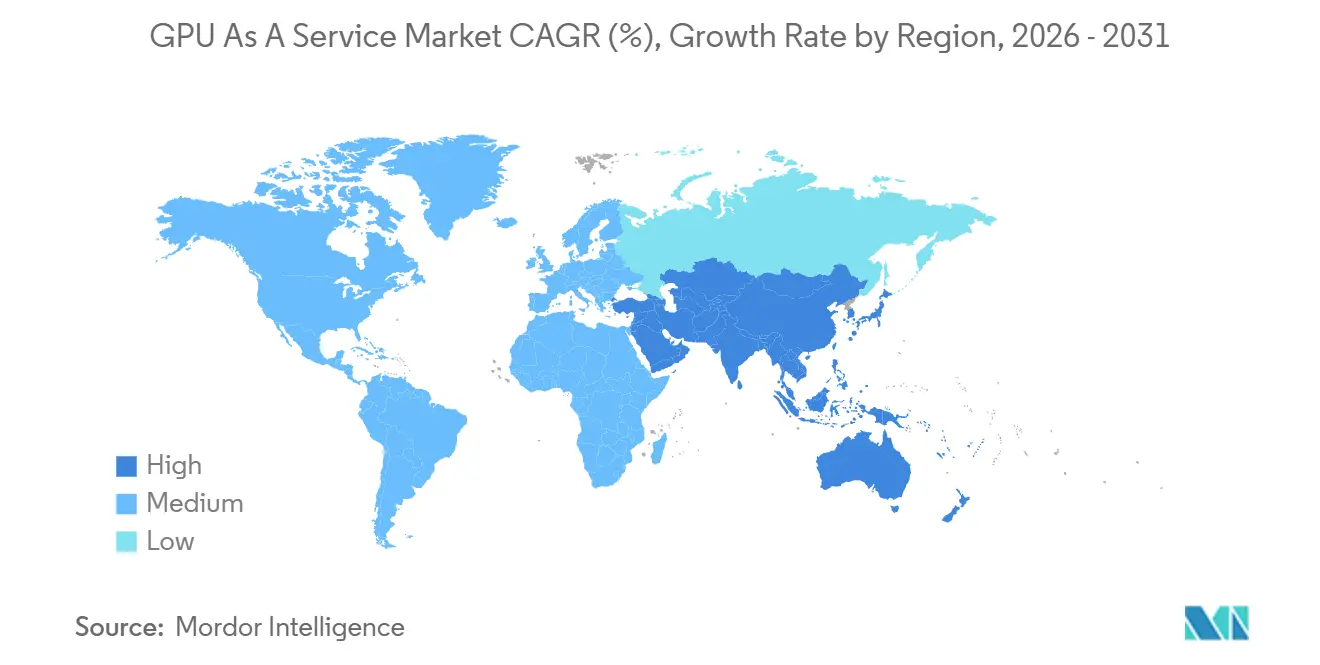
| Fastest Growing Market | Asia Pacific |
| Largest Market | North America |
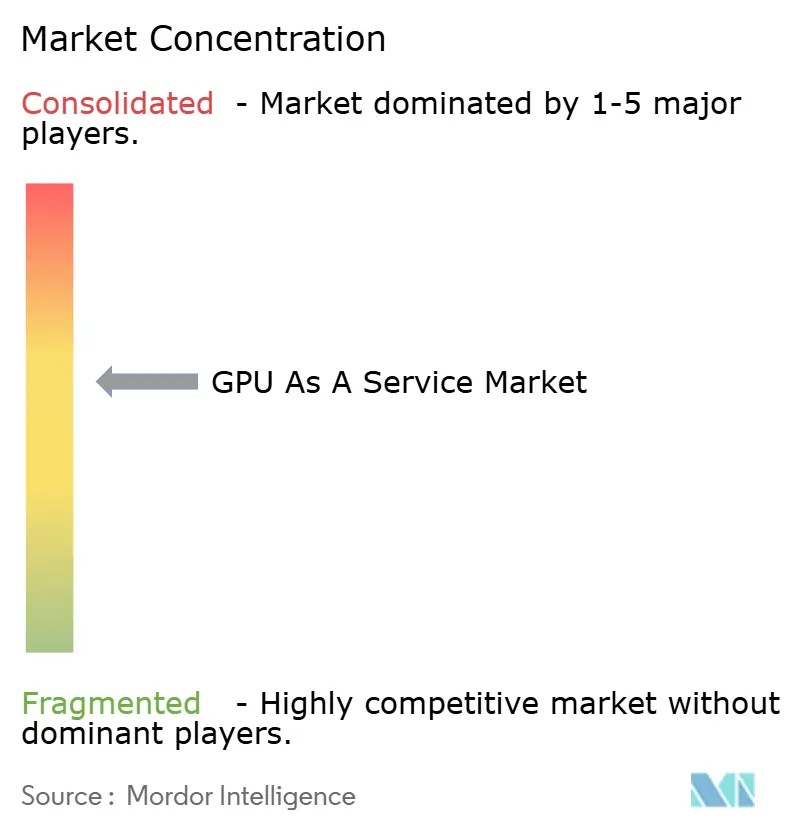
| Market Concentration | Medium |
Major Players *Disclaimer: Major Players sorted in no particular order Image © Mordor Intelligence. Reuse requires attribution under CC BY 4.0. | |
GPU As A Service Market Analysis by Mordor Intelligence
The GPU as a service market size is expected to increase from USD 5.73 billion in 2025 to USD 7.38 billion in 2026 and reach USD 26.09 billion by 2031, growing at a CAGR of 28.73% over 2026-2031. Massive demand for large-language-model training, the push for sovereign compute mandates, and pay-per-use pricing that removes up-front capital barriers are reshaping how enterprises source accelerated compute. The GPU as a service market is also benefiting from broader cloud-first strategies that shift spending from hardware procurement to operating expenditure, encouraging continuous experimentation with generative-AI projects. Competition is intensifying as specialist providers position differentiated, sustainability-focused capacity close to end-users, while hyperscalers defend scale advantages with bundled software and enterprise-grade security offerings. Headline risks include high-bandwidth-memory supply constraints, spot-market price swings, and tightening data-sovereignty rules that fragment regional capacity, yet each challenge is also spawning new revenue pools for providers able to tailor hybrid or sovereign cloud designs.
Key Report Takeaways
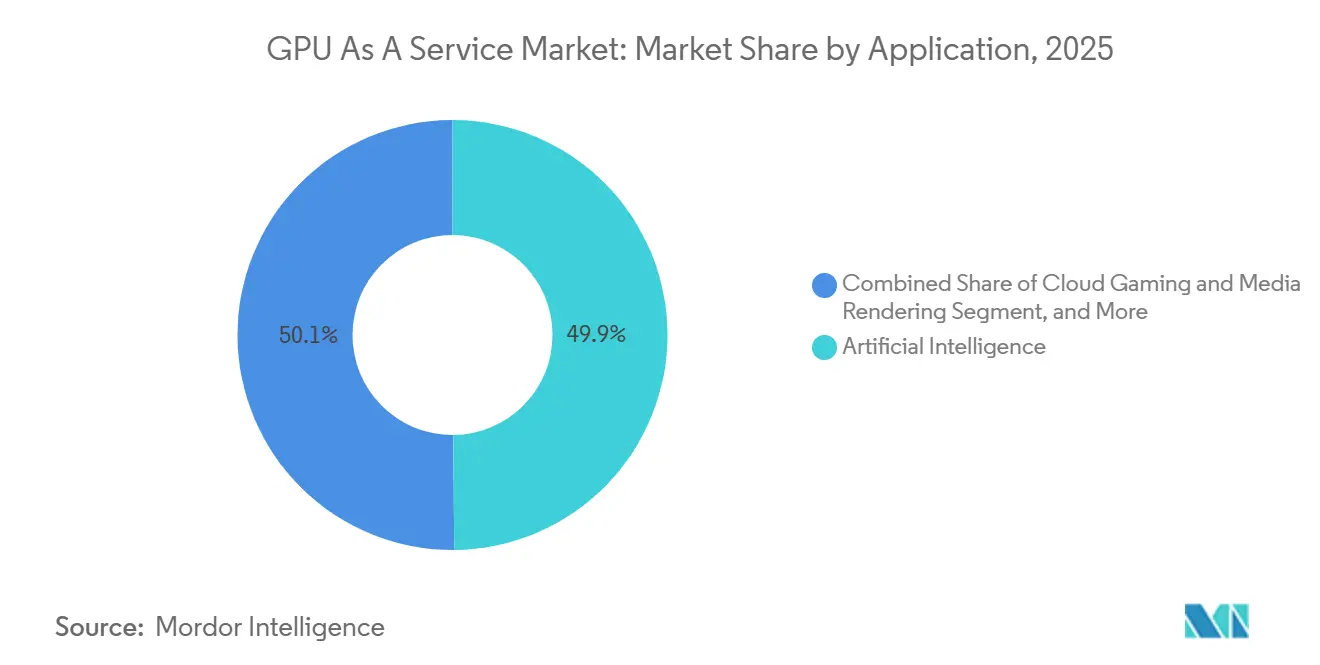
- By application, artificial intelligence led with 49.87% of GPU as a service market share in 2025, whereas cloud gaming and media rendering are expanding at a 29.54% CAGR through 2031.
- By enterprise size, large enterprises accounted for 62.34% share of the GPU as a service market size in 2025, but small and medium enterprises are forecast to grow at 29.11% CAGR to 2031.
- By end-user industry, information technology and communications captured 27.89% revenue share in 2025, while media and entertainment is set to post the fastest 29.93% CAGR to 2031.
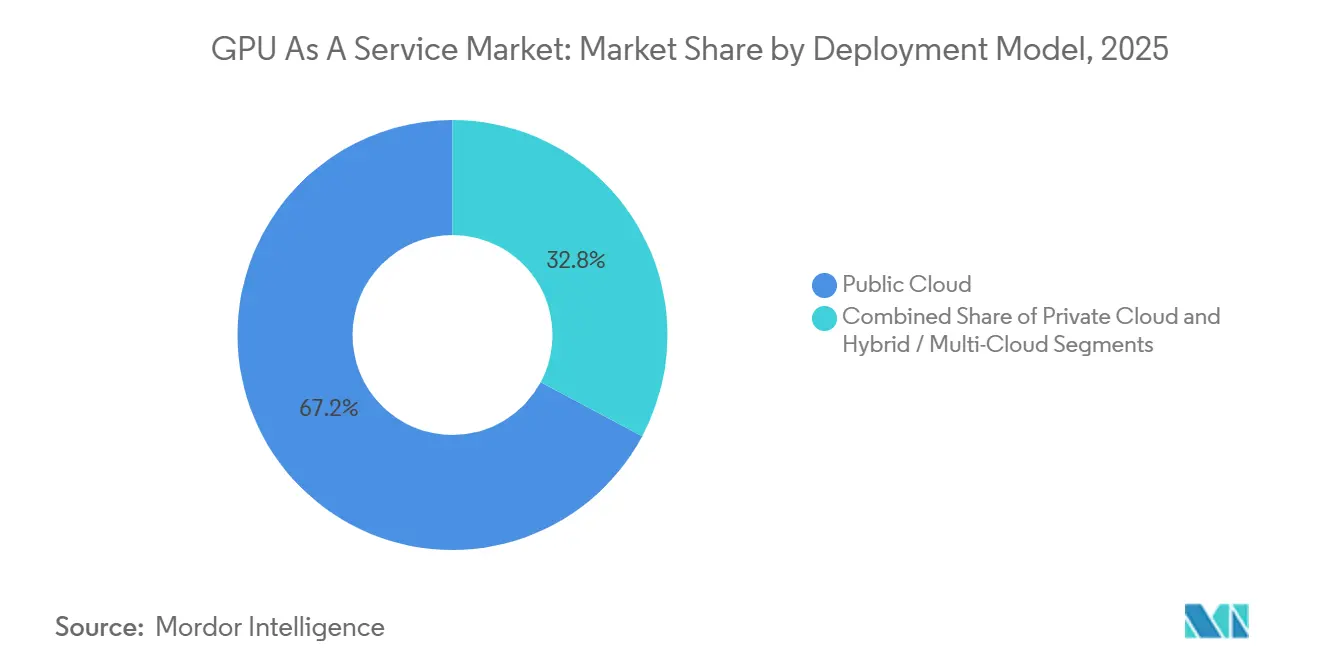
- By deployment model, public cloud held 67.19% revenue share in 2025, while hybrid and multi-cloud are advancing at a 29.36% CAGR through 2031.
- By service model, infrastructure-as-a-service controlled 58.73% of the 2025 value pool, whereas platform-as-a-service is projected to grow at 29.31% CAGR over 2026-2031.
- By geography, North America led with 42.36% GPU as a service market share in 2025, while Asia-Pacific is the fastest growing geography at a 29.76% CAGR to 2031.
Note: Market size and forecast figures in this report are generated using Mordor Intelligence’s proprietary estimation framework, updated with the latest available data and insights as of 2026.
Global GPU As A Service Market Trends and Insights
Drivers Impact Analysis*
| Driver | (~) % Impact on CAGR Forecast | Geographic Relevance | Impact Timeline |
|---|---|---|---|
| Rising Usage of Generative-AI and LLM Workloads | +8.2% | Global, concentrated in North America and Asia-Pacific | Medium term (2-4 years) |
| Surge in AR, VR and Real-Time Rendering Needs | +5.1% | North America, Europe, Asia-Pacific core markets | Medium term (2-4 years) |
| Cloud-Gaming Service Expansion | +4.7% | North America, Europe, emerging in Asia-Pacific | Short term (≤ 2 years) |
| Pay-Per-Use Pricing Models Gaining Traction | +3.9% | Global, accelerated adoption in SME segments | Short term (≤ 2 years) |
| Sovereign AI Clouds Emerging in Regulated Economies | +4.3% | Europe, Middle East, Asia-Pacific | Long term (≥ 4 years) |
| Composable GPU Fabrics Enabling Fractional Rental | +2.5% | North America, early adoption in Europe | Long term (≥ 4 years) |
| Source: Mordor Intelligence | |||
Rising Usage of Generative-AI and LLM Workloads
Generative artificial intelligence and large language model training now consume the majority of GPU-as-a-service capacity, with NVIDIA reporting that its DGX Cloud platform delivered 3.2 times faster time-to-solution for Llama 3.1 405B fine-tuning compared to prior-generation architectures.[1] NVIDIA Developer, “DGX Cloud Now Available on Oracle Cloud Infrastructure,” developer.nvidia.com Providers offering H100 and H200 clusters with NVLink and high-bandwidth memory secure premium pricing because they cut training cycles and reduce inference latency, two factors that directly lower total cost of ownership for large language models. Financial-services institutions are leading adopters, applying GPU acceleration to fraud-detection pipelines that demand sub-100-millisecond response times, while healthcare firms use similar infrastructure for medical-image analysis. Demand spikes coincide with major model releases, creating capacity crunches that reward suppliers holding forward silicon allocations. Consequently, the GPU as a service market records elastic price surges during each new model wave, yet overall volume keeps rising as smaller models proliferate across business units.
Surge in AR, VR and Real-Time Rendering Needs
Commercial augmented-reality field-service tools, virtual-production film stages, and enterprise collaboration suites require steady 90-frames-per-second 4K rendering, a performance target seldom achievable on local devices. Cloud-offloaded rendering pipelines therefore route the heaviest shading tasks to edge-proximate GPU clusters, where latency stability, rather than peak bandwidth, determines the user experience. Providers with distributed metropolitan points of presence command 30-50% pricing premiums over centralized hyperscale regions because they meet stringent jitter tolerances. The proliferation of consumer mixed-reality hardware is widening the addressable workload pool beyond entertainment into design, training, and healthcare visualization, further widening the GPU as a service market opportunity.
Cloud-Gaming Service Expansion
Subscription-based game streaming surpassed 50 million active users by late 2025, converting casual gamers who favor click-to-play convenience over console ownership. Competitive esports titles need RTX 4080-class performance at 120 frames per second, yet narrative games run comfortably on mid-range GPUs. Service operators arbitrage idle capacity by leasing cards to overnight AI-training jobs, boosting overall utilization from 60% toward 85% and compressing cost-per-frame delivered. These multi-tenant allocation strategies illustrate how the GPU as a service market continues to diversify beyond pure AI, smoothing revenue seasonality for providers.
Pay-Per-Use Pricing Models Gaining Traction
Consumption-based pricing unlocks cutting-edge accelerators for start-ups that lack the cash to purchase USD 250,000 on-premises servers. Hourly H100 rates between USD 2 and USD 4 have democratized experimentation across industries that once relied on slow CPU clusters. Volatility still exists, with peak-period pricing spiking to USD 5.50 in capacity-constrained regions, yet multi-cloud broker platforms now automate workload placement to the lowest-cost zone. These advances are steering the GPU as a service market toward commodity-like trading dynamics, even as performance differentials remain an upsell lever for providers.Regulatory influence remains limited, though the European Union's Digital Markets Act mandates interoperability for cloud workloads, reducing lock-in risks that previously deterred enterprises from adopting consumption-based models.[2]European Commission, “NIS2 Directive,” digital-strategy.ec.europa.eu
Restraints Impact Analysis*
| Restraint | (~) % Impact on CAGR Forecast | Geographic Relevance | Impact Timeline |
|---|---|---|---|
| Cyber-Security and Data-Sovereignty Concerns | -3.8% | Europe, Middle East, regulated sectors globally | Medium term (2-4 years) |
| Global Shortage of AI-Skilled DevOps Talent | -2.9% | Global, acute in Asia-Pacific and Europe | Long term (≥ 4 years) |
| HBM Memory and Advanced Packaging Supply Constraints | -4.2% | Global, supply concentrated in South Korea and Taiwan | Short term (≤ 2 years) |
| GPU Spot-Market Price Volatility and Capacity Hoarding | -2.4% | North America, Europe | Short term (≤ 2 years) |
| Source: Mordor Intelligence | |||
Cyber-Security and Data-Sovereignty Concerns
Financial-services, healthcare, and public-sector organizations must keep sensitive data within national borders, yet top-tier GPUs are still clustered in multinational hyperscale regions. New regulations require 24-hour breach reporting and impose steep fines for non-compliance, forcing enterprises to split workloads across sovereign clouds and private data centers, a choice that elevates per-GPU costs by up to 35%. Providers unable to certify local residency or attain ISO-aligned security attestations risk exclusion from procurement shortlists. Compliance frameworks such as ISO/IEC 27017 for cloud security and NIST SP 800-145 for cloud computing definitions provide governance structures, but they do not resolve the fundamental tension between GPU economies of scale and jurisdictional data silos.[3]ISO/IEC 27017, “Information Security Controls for Cloud Services,” iso.org These compliance hurdles temporarily cool demand, yet they also create a protected runway for regional GPU as a service market entrants that embed security and residency guarantees into their base offerings.
HBM Memory and Advanced Packaging Supply Constraints
Advanced high-bandwidth memory and CoWoS packaging remain bottlenecks because a handful of Asian suppliers control production. Lead times can stretch to nine months, prompting well-capitalized providers to pre-pay for inventory while smaller resellers are relegated to volatile spot markets. Temporary shortages inflate hourly rental prices and delay capacity on-boarding schedules, diminishing near-term revenue realization. Although supply is forecast to improve post-2027 as new fabs come online, current constraints continue to moderate otherwise break-neck growth in the GPU as a service market.
*Our forecasts treat driver/restraint impacts as directional, not additive. The impact forecasts reflect baseline growth, mix effects, and variable interactions.
Segment Analysis
By Application: Artificial Intelligence Anchors Revenue While Gaming Accelerates
The artificial-intelligence segment contributed 49.87% GPU as a service market share in 2025, reflecting its dominance in language-model training, computer-vision inference, and recommendation workloads. Sustained demand is evident in retail personalization pipelines and conversational agents that spin up GPU hours intermittently yet persist across the software life-cycle. Meanwhile, cloud gaming and media rendering delivered under 20% combined revenue in 2025 but are on track for a 29.54% CAGR, outpacing the overall GPU as a service market size trajectory through cloud-native rendering studios and subscription gaming services. Providers that carve out low-latency regions within 10 milliseconds of end-users win share as frame-rate stability outweighs raw teraFLOPS. High-performance-computing jobs, such as seismic processing and molecular dynamics, maintain double-digit growth, yet data-gravity issues and entrenched on-premises clusters temper cloud migration. Smaller niches, from academic research to cryptocurrency mining, generate ad-hoc demand that soaks up spare capacity, stabilizing daytime pricing windows.
A second tailwind for the artificial-intelligence cohort is the proliferation of open-model fine-tuning, which prefers distributed, moderately sized GPU clusters over monolithic super-nodes, allowing mid-tier providers to compete on cost per completed epoch. Conversely, gaming workloads create diurnal peaks that align with consumer behavior, encouraging capacity-sharing agreements with enterprise AI customers that operate in off-peak hours, a symbiosis that raises utilization and boosts margins across the GPU as a service market.


By Enterprise Size: SMEs Surge on Managed Platforms
Large enterprises absorbed 62.34% of 2025 revenue because multi-year cloud agreements bundle GPUs with analytics and security tooling. Yet the small and medium enterprise cohort is slated for a 29.11% CAGR, marginally ahead of the broader GPU as a service market size growth, as managed platforms obviate the need for six-figure DevOps hires. SMEs often begin with burst credit allocations, then scale to reserved capacity as workloads mature, producing a land-and-expand revenue pattern that specialist providers nurture through flexible contract terms. Churn is higher, approaching 35% annually, but acquisition costs stay moderate due to community-driven word-of-mouth marketing.
Large enterprises continue to favor infrastructure-as-a-service for procurement leverage, yet compliance reviews and internal risk committees slow deployment timelines by up to 18 months, letting agile SMEs steal early mover benefits in vertical-specific AI applications. Hybrid procurement strategies that mix hyperscaler bulk capacity with niche provider burst nodes are becoming common across both enterprise tiers, reinforcing multi-cloud normalization within the GPU as a service market.
By End-User Industry: ICT Leads, Media Ramps Up
Information technology and communications firms generated 27.89% of total value in 2025 as SaaS vendors and hosting companies resold GPU minutes to downstream developers. Media and entertainment is projected to clock the fastest 29.93% CAGR through 2031 as virtual production pipelines swap local render farms for elastic GPU swarms that scale 10-fold during peak editing sprints. Banking, financial services, and insurance workloads post robust 28.6% expansion driven by low-latency fraud detection, while healthcare and life sciences enjoy 28.9% gains from imaging analytics and protein-folding simulations, albeit under strict data-protection rules that often push them into sovereign or private clouds.
Automotive simulation for advanced-driver-assistance systems grows in step with vehicle electrification programs, relying heavily on digital-twin GPU clusters that validate sensor fusion algorithms. Remaining verticals such as energy exploration and retail analytics round out demand, each contributing single-digit market shares yet ensuring workload diversity that dilutes provider concentration risk in the GPU as a service market.
By Deployment Model: Public Cloud Dominates, Hybrid Grows Faster
Public cloud remained the preferred route in 2025, holding 67.19% share thanks to blended IaaS discounts that lower cost per GPU-hour for customers operating under 5,000 hours annually. However, hybrid and multi-cloud architectures are pacing ahead at 29.36% CAGR through 2031. Enterprises segment data-sensitive workloads to private clusters for compliance yet burst large-scale training jobs into public regions, achieving a cost-trade-off that becomes sensible after crossing 10,000 GPU-hours per month. Implementation overhead includes orchestration software, network egress, and duplicated licensing, adding 25-40% cost premium versus single-cloud setups, but governance committees increasingly favor this approach to balance resilience and sovereignty aims.
Defense, healthcare, and critical-infrastructure operators, wary of exporting personally identifiable information, anchor the market share of private-cloud deployments. These entities frequently partner with regional providers to establish sovereign AI clouds. This collaboration not only injects fresh capacity into local GPU-as-a-service ecosystems but also reduces dependence on North American hyperscalers. The growing emphasis on data sovereignty and compliance with regional regulations has further driven the adoption of private-cloud deployments. Additionally, the increasing demand for secure and scalable AI solutions tailored to specific industries continues to bolster the development of sovereign AI clouds.
By Service Model: IaaS Commands Volume, PaaS Accelerates
Infrastructure-as-a-service kept 58.73% share in 2025 as enterprises valued configuration control for networking topologies and CUDA driver stacks. Platform-as-a-service, however, is forecast to capture outsized incremental gains with a 29.31% CAGR, as it compresses provisioning cycles from weeks to hours and shields developers from low-level performance tuning. Hourly platform premiums of 15-25% are offset by faster time-to-market, especially appealing to SMEs lacking in-house GPU specialists. Software-as-a-service overlays, including GPU-accelerated CAD and video-editing suites, represent roughly 12% share and sustain a respectable 28.4% CAGR, constrained mainly by data egress fees that can double total cost for high-resolution media exports.
Large enterprises are turning to infrastructure-as-a-service, seeking both negotiation leverage and portability. In contrast, SMEs are opting for managed platforms to simplify operations and reduce overhead costs. Infrastructure suppliers are now bundling reference deployment scripts to streamline implementation processes, and platforms are offering advanced tuning hooks to enhance customization and performance. This trend is blurring the lines between categories, yet expanding choices for customers by providing more tailored solutions to meet diverse business needs.
Geography Analysis
North America accounted for 42.36% GPU as a service market share in 2025, leveraging dense data-center corridors in Virginia, Oregon, and Texas that offer low-cost renewable energy and robust fiber backbones. Hyperscalers rolled out H200 instances across multiple availability zones, and specialist providers secured venture financing to build metropolitan-edge clusters that optimize for sub-10-millisecond response targets. Investor appetite remains strong, with several nine-figure fund-raises underwriting expansion into Chicago, Phoenix, and Dallas. Network effects are compounding because model developers fine-tune workflows around proprietary APIs, indirectly intensifying vendor lock-in and sustaining premium pricing power for incumbents.
Asia-Pacific is projected to be the fastest-growing region at 29.76% CAGR through 2031 as India’s multibillion-rupee AI mission orders 10,000-plus GPUs for federal and state data centers. Southeast-Asian governments, including Indonesia and Malaysia, are also mandating domestic processing of citizen data, creating captive demand for regional GPU clusters. Chinese cloud providers diversify the silicon stack with domestic accelerators, yet software-tooling fragmentation limits cross-border workload portability. Australia and Japan maintain steady growth through research-institution demand, moderated by higher electricity rates and stricter data-protection laws.
Europe held roughly 22% share in 2025 but grows slower due to stringent GDPR, NIS2, and national sovereignty clauses that splinter capacity across borders. French and German sovereign clouds price 30-50% above hyperscale equivalents because of smaller scale and higher capital costs, though new EU funding lines are underwriting regional GPU clusters to reduce foreign dependence. The Middle East and Africa cluster represents around 8% share, buoyed by sovereign AI programs in Saudi Arabia and United Arab Emirates, whereas South America remains under 6% owing to currency volatility and comparatively thin network infrastructure. Altogether, geographic fragmentation introduces pricing arbitrage opportunities, yet it also compels providers to invest in compliance tooling, influencing long-term margin structures in the GPU as a service market.

Competitive Landscape
Market leadership remains moderately concentrated, with the top five providers accounting for about 65% of 2025 revenue. Amazon Web Services, Microsoft Azure, and Google Cloud defend their volume advantage with global data center footprints, proprietary developer ecosystems, and pre-negotiated enterprise discounts. Their scale lets them bundle GPUs with analytics, storage, and security add-ons that deepen customer lock-in, keeping churn rates among Fortune 500 clients in low single digits. Each hyperscaler also increased capital spending on H100 and H200 clusters, preserving availability headroom during demand spikes triggered by new language model releases.
Specialist challengers such as CoreWeave, Lambda Labs, and Crusoe Energy are capturing share in workloads that value flexibility, cost transparency, or sustainability. CoreWeave attracts AI start-ups through hourly rates that sit 20% below hyperscaler on-demand pricing and through willingness to sign three-month rather than multiyear commitments. Lambda Labs differentiates with rapid lead times, often spinning up reserved nodes within 24 hours, a speed edge appealing to research teams on tight grant deadlines. Crusoe Energy converts flare gas into electricity for mobile data centers, an approach that reduces Scope 2 emissions and appeals to clients participating in environmental disclosure programs. Smaller aggregators such as Vast.ai and RunPod fill a secondary role by brokering idle GPUs from miners and universities, satisfying burst demand at steep discounts but with lower service-level guarantees.
Competitive focus is shifting from raw capacity to supply-chain control and compliance readiness. Providers holding forward purchase contracts for high-bandwidth memory and advanced packaging secure preferential silicon allocations, allowing them to quote firm delivery dates even during industry shortages. Sustainability credentials are now weighted in procurement scoring because several jurisdictions link tax incentives to carbon-intensity targets, motivating operators to sign renewable power-purchase agreements or locate facilities near hydro and wind resources. Enterprise buyers also demand internationally recognized attestations such as SOC 2 Type II, FedRAMP, or Germany’s C5, and the associated audit costs create natural barriers for lightly financed entrants. As a result, the landscape balances scale economics with niche specialization, allowing both hyperscale incumbents and agile newcomers to thrive.
GPU As A Service Industry Leaders
Amazon Web Services Inc.
Microsoft Corporation
Google LLC
NVIDIA Corporation
IBM Corporation
- *Disclaimer: Major Players sorted in no particular order

Recent Industry Developments
- December 2025: Amazon Web Services opened three additional GPU-optimized availability zones in Madrid, Osaka and Toronto, adding 45,000 NVIDIA H200 GPUs and committing USD 1.2 billion in regional renewable-energy power-purchase agreements to support the expansion.
- October 2025: Microsoft Azure completed rollout of ND H100 v5 virtual machines across all 21 public-cloud regions, integrating 400 Gbps Ethernet fabric and reducing average LLM training times by 35% for enterprise customers holding reserved-instance contracts.
- August 2025: CoreWeave finalized a USD 275 million equipment-lease arrangement with NVIDIA Finance to accelerate deployment of 30,000 additional H200 GPUs in its Chicago and Phoenix data centers, targeting late-2025 capacity go-live for generative-AI workloads.
- May 2025: Alibaba Cloud introduced gn7i-pro GPU instances powered by eight NVIDIA H100 accelerators in Jakarta and Mumbai regions, enabling regional customers to cut cloud-rendering costs by 22% versus previous A100-based offerings.


Global GPU As A Service Market Report Scope
GPU as a Service (GPUaaS) is a cloud computing service that lets users rent powerful Graphics Processing Units (GPUs) online instead of buying physical hardware, With GPUaaS, these GPUs are hosted in remote data centers, and users access them through the internet on demand.
The GPU As A Service Market Report is Segmented by Application (Artificial Intelligence, High-Performance Computing, Cloud Gaming and Media Rendering, Other Applications), Enterprise Size (Small and Medium Enterprises, Large Enterprises), End-User Industry (BFSI, Automotive and Mobility, Healthcare and Life Sciences, IT and Communications, Media and Entertainment, Other End-User Industries), Deployment Model (Public Cloud, Private Cloud, Hybrid Multi-Cloud), Service Model (IaaS, PaaS, SaaS GPU-Accelerated), and Geography (North America, South America, Europe, Asia-Pacific, Middle East and Africa). The Market Forecasts are Provided in Terms of Value (USD).
| Artificial Intelligence |
| High-Performance Computing |
| Cloud Gaming and Media Rendering |
| Other Applications |
| Small and Medium Enterprises |
| Large Enterprises |
| BFSI |
| Automotive and Mobility |
| Healthcare and Life Sciences |
| IT and Communications |
| Media and Entertainment |
| Other End-User Industries |
| Public Cloud |
| Private Cloud |
| Hybrid / Multi-Cloud |
| IaaS |
| PaaS |
| SaaS (GPU-Accelerated) |
| North America | United States | |
| Canada | ||
| Mexico | ||
| South America | Brazil | |
| Argentina | ||
| Rest of South America | ||
| Europe | United Kingdom | |
| Germany | ||
| France | ||
| Italy | ||
| Rest of Europe | ||
| Asia-Pacific | China | |
| Japan | ||
| India | ||
| South Korea | ||
| Rest of Asia-Pacific | ||
| Middle East and Africa | Middle East | United Arab Emirates |
| Saudi Arabia | ||
| Rest of Middle East | ||
| Africa | South Africa | |
| Egypt | ||
| Rest of Africa | ||
| By Application | Artificial Intelligence | ||
| High-Performance Computing | |||
| Cloud Gaming and Media Rendering | |||
| Other Applications | |||
| By Enterprise Size | Small and Medium Enterprises | ||
| Large Enterprises | |||
| By End-User Industry | BFSI | ||
| Automotive and Mobility | |||
| Healthcare and Life Sciences | |||
| IT and Communications | |||
| Media and Entertainment | |||
| Other End-User Industries | |||
| By Deployment Model | Public Cloud | ||
| Private Cloud | |||
| Hybrid / Multi-Cloud | |||
| By Service Model | IaaS | ||
| PaaS | |||
| SaaS (GPU-Accelerated) | |||
| By Geography | North America | United States | |
| Canada | |||
| Mexico | |||
| South America | Brazil | ||
| Argentina | |||
| Rest of South America | |||
| Europe | United Kingdom | ||
| Germany | |||
| France | |||
| Italy | |||
| Rest of Europe | |||
| Asia-Pacific | China | ||
| Japan | |||
| India | |||
| South Korea | |||
| Rest of Asia-Pacific | |||
| Middle East and Africa | Middle East | United Arab Emirates | |
| Saudi Arabia | |||
| Rest of Middle East | |||
| Africa | South Africa | ||
| Egypt | |||
| Rest of Africa | |||


Key Questions Answered in the Report
What is the projected value of the GPU as a service market by 2031?
The market is forecast to reach USD 26.09 billion by 2031.
How fast is the GPU as a service market expected to grow?
It is projected to expand at a 28.73% CAGR during 2026-2031.
Which application currently generates the largest share of spending?
Artificial-intelligence workloads held 49.87% of 2025 revenue.
Why are hybrid and multi-cloud deployments gaining traction?
Enterprises balance latency and data-sovereignty requirements while optimizing cost across private and public GPU clouds.
Which region is expected to record the fastest growth?
Asia-Pacific is projected to grow at a 29.76% CAGR through 2031, led by sovereign AI initiatives.
What is driving platform-as-a-service adoption?
Managed orchestration layers reduce deployment time and eliminate the need for specialized CUDA optimization skills, attracting SMEs in particular.
Page last updated on:


