
Golf Cart Market Size and Share
Market Overview
| Study Period | 2019 - 2031 |
|---|---|
| Market Size (2026) | USD 2.44 Billion |
| Market Size (2031) | USD 3.24 Billion |
| Growth Rate (2026 - 2031) | 5.81 % |
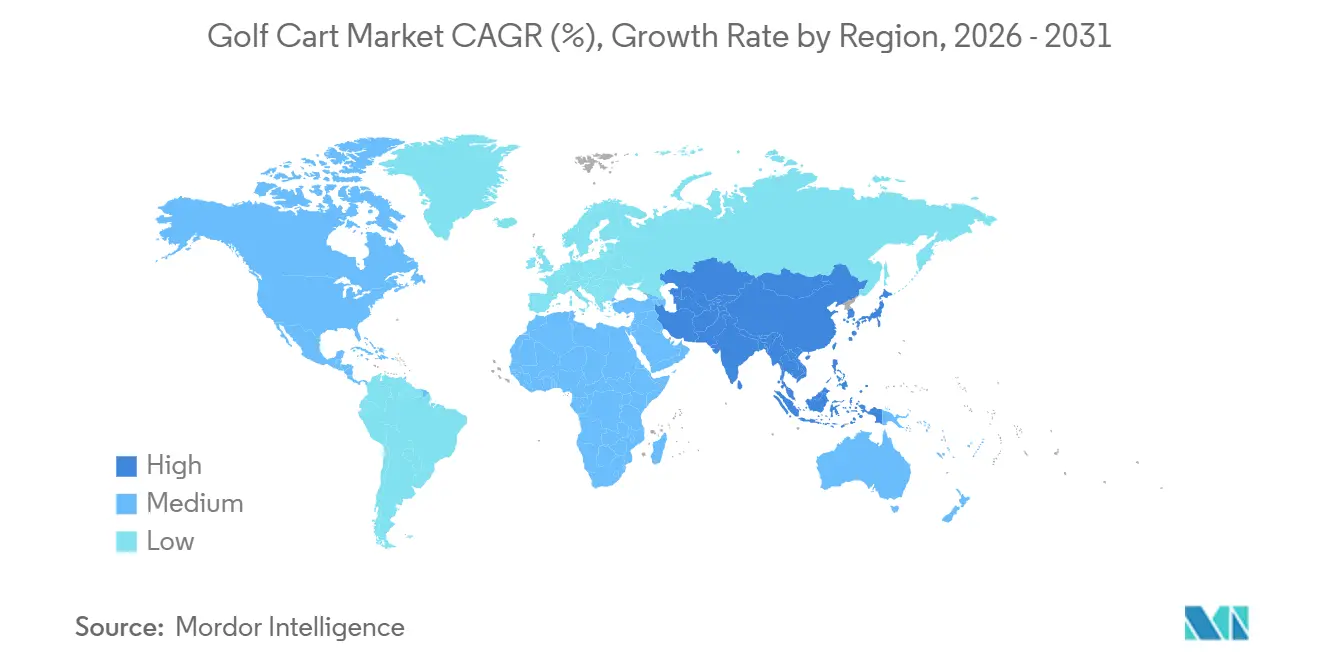
| Fastest Growing Market | Asia Pacific |
| Largest Market | North America |
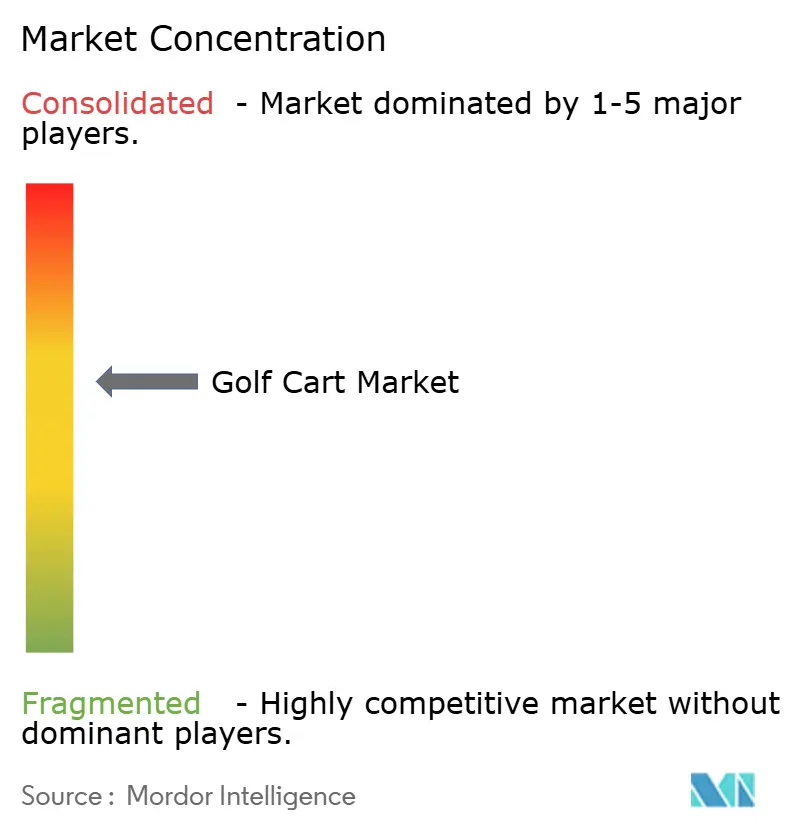
| Market Concentration | Medium |
Major Players *Disclaimer: Major Players sorted in no particular order Image © Mordor Intelligence. Reuse requires attribution under CC BY 4.0. | |
Golf Cart Market Analysis by Mordor Intelligence
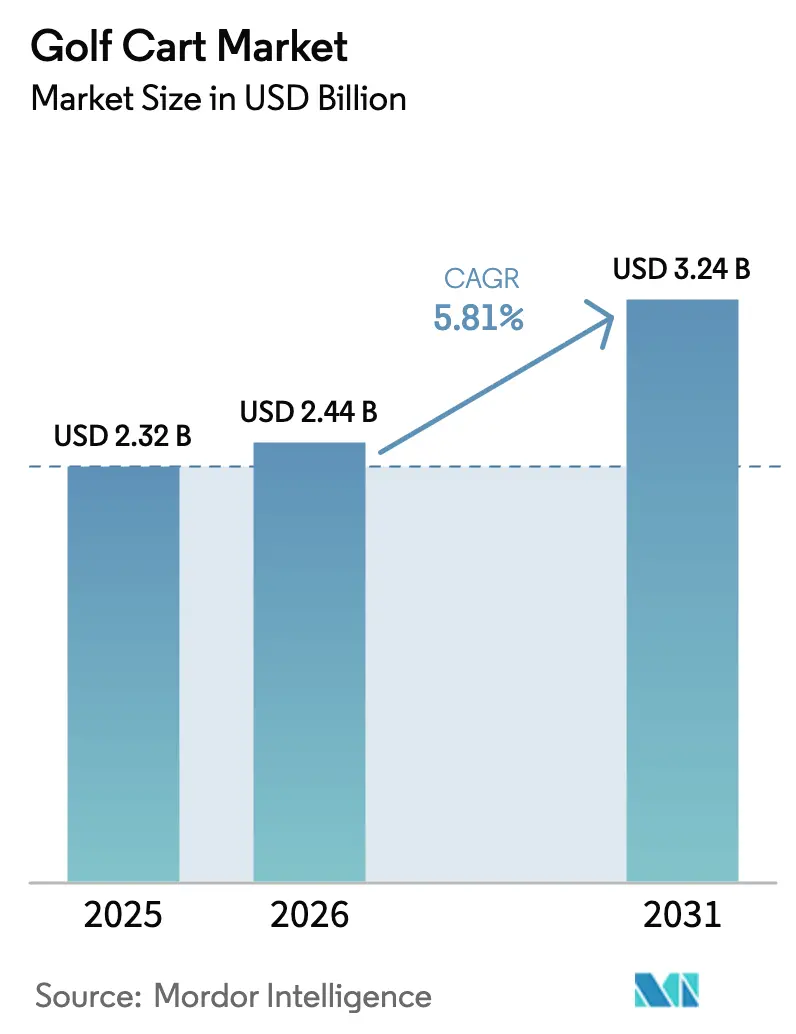
The golf cart market size was valued at USD 2.32 billion in 2025 and estimated to grow from USD 2.44 billion in 2026 to reach USD 3.24 billion by 2031, at a CAGR of 5.81% during the forecast period (2026-2031). Robust growth stems from expanding resort micro-mobility schemes, electrification mandates at golf courses, and the steady shift toward family-oriented four-seater formats. Electric propulsion holds the lion’s share today, but solar-hybrid carts are scaling quickly where grid access is scarce. Original equipment manufacturer investments in lithium iron phosphate (LFP) batteries, bundled financing, and online build-to-order portals are reshaping sales strategies, while regulatory attention on safety standards and recalls drives product redesign. Competitive pressure remains moderate as Western incumbents defend pricing power against lower-cost Chinese entrants through premium features and direct-to-consumer platforms.
Key Report Takeaways
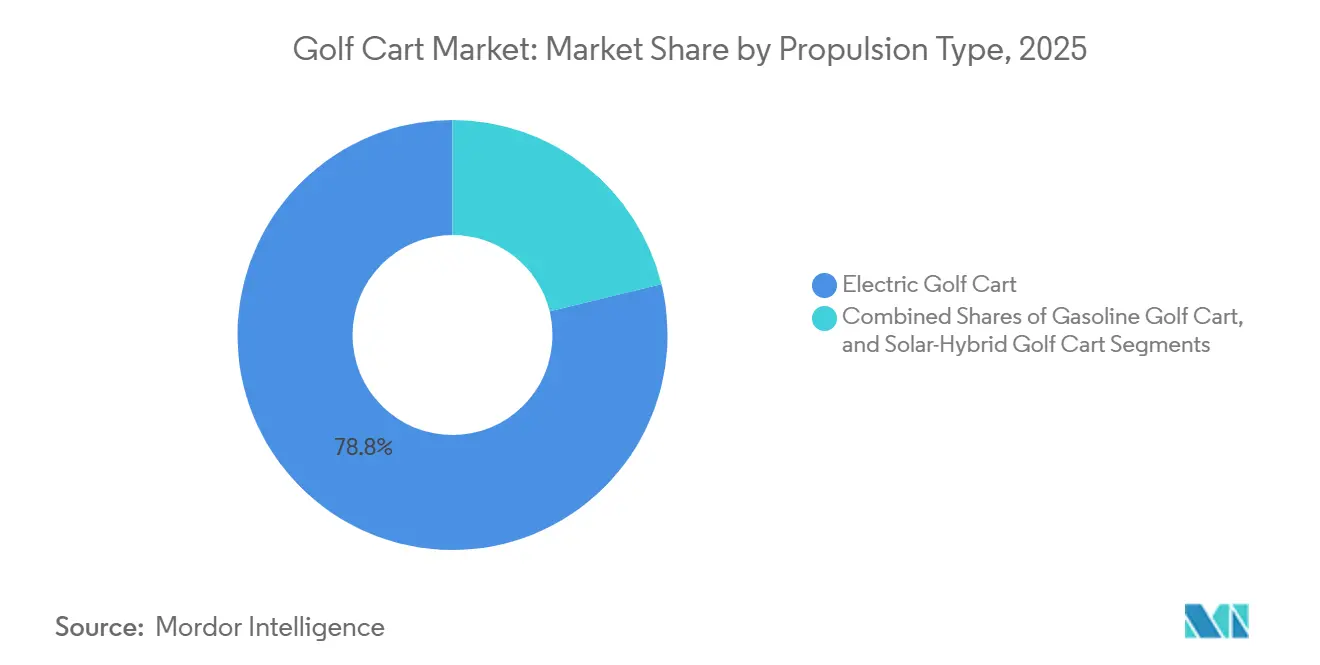
- By propulsion, electric carts led with 78.81% revenue share in 2025, while solar-hybrid variants are advancing at a 5.83% CAGR through 2031.
- By seating capacity, two-seater models accounted for 47.63% of the golf cart market share in 2025, whereas four-seaters are forecast to grow at a 5.88% CAGR.
- By vehicle format, open-top designs led with 77.71% of the golf cart market share in 2025, while enclosed weather-proof carts are forecast to grow at a 5.93% CAGR through 2031.
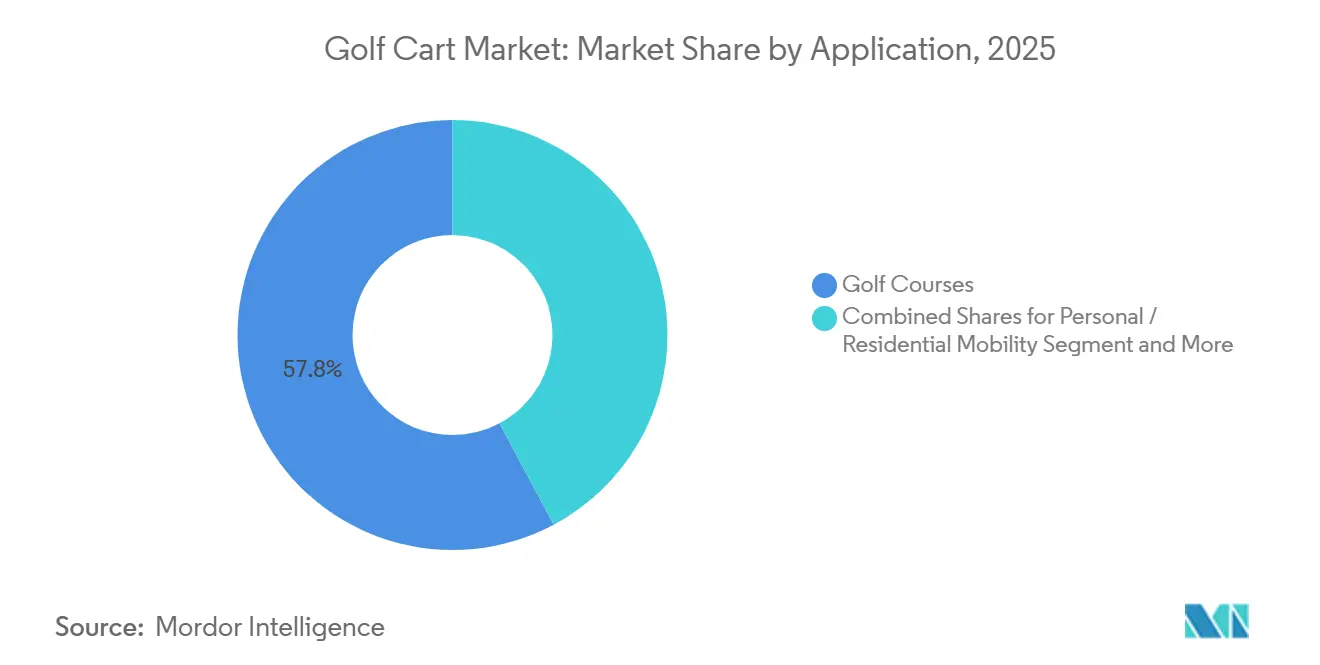
- By application, golf courses generated 57.78% of demand in 2025, and commercial services are expanding at a 5.85% CAGR to 2031.
- By sales channel, offline dealer and distributor networks held 73.46% of the golf cart market share in 2025, whereas online direct-to-consumer platforms are projected to advance at a 5.91% CAGR to 2031.
- By geography, North America captured 38.71% of 2025 revenue, and Asia Pacific is slated to climb at a 5.87% CAGR over the same horizon.
Note: Market size and forecast figures in this report are generated using Mordor Intelligence’s proprietary estimation framework, updated with the latest available data and insights as of January 2026.
Market Trends and Insights
Drivers Impact Analysis of Golf Cart Market*
| Driver | (~) % Impact on CAGR | Geographic Relevance | Impact Timeline |
|---|---|---|---|
| United States Retirement Communities | +1.2% | North America, concentrated in Florida, Arizona, South Carolina | Medium term (2-4 years) |
| European Golf Courses and Country Clubs Mandated to Electrify Operations | +0.9% | EU-27, United Kingdom, Norway, Switzerland | Short term (≤ 2 years) |
| Southeast Asian Islands Integrating Micro-mobility Programs | +0.8% | Asia Pacific core (Thailand, Indonesia, Malaysia), spill-over to Vietnam, Philippines | Medium term (2-4 years) |
| Planned Golf Townships Emerging as Part of Mega-projects | +0.6% | Saudi Arabia (NEOM, Qiddiya, Diriyah), United Arab Emirates (Red Sea islands) | Long term (≥ 4 years) |
| OEM Bundled-financing for Community Transport Fleets | +0.5% | India, urban and peri-urban townships, gated communities | Medium term (2-4 years) |
| Caribbean Resorts with Low Grid Access Piloting Solar-hybrid Carts | +0.3% | Eastern Caribbean islands, Barbados, Jamaica, Dominican Republic | Long term (≥ 4 years) |
| Source: Mordor Intelligence | |||


United States Retirement Communities Rapidly Adopting New Trends
In Florida, Arizona, and South Carolina, retirement communities have made carts a staple mode of transport. The Villages, a prominent player, operates a substantial number of units and boasts significant annual growth. In recent years, Florida dealers have experienced a considerable increase in cart sales. This growth is largely driven by younger retirees who are customizing their carts with features like lifted suspensions, LED lighting, and Bluetooth audio, ensuring they're street-legal. In Dunedin and Panama City, city ordinances have expanded low-speed vehicle zones, linking homes directly to retail areas and healthcare facilities. As a result, there's an increasing demand for four-seater carts, reflecting the needs of multigenerational households. Recently, the National Highway Traffic Safety Administration introduced updated safety standards, requiring the integration of seat belts, windshields, and turn signals in carts over the coming years, especially for those on public roads [1]“FMVSS 305a Final Rule,” National Highway Traffic Safety Administration, nhtsa.gov.
Planned Golf Townships Emerging in GCC Mega-Projects
Saudi Arabia's NEOM's Gidori and Qiddiya, along with the United Arab Emirates' Red Sea courses, are introducing enclosed, air-conditioned carts with varying seating capacities, designed to combat the sweltering desert heat. Qiddiya, aiming to attract a significant number of annual visitors in the coming years, is in dire need of high-capacity VIP fleets. These ambitious projects are fostering partnerships with suppliers, focusing on thermally managed batteries and solar-hybrid roofs, significantly reducing dependence on traditional generators [2]“Gidori Golf Development Brief,” NEOM Company, neom.com .
OEM Bundled Financing for Community Fleets in India
In a move mirroring India's expansive electric three-wheeler initiatives, townships in proximity to major metropolitan areas such as Delhi, Bengaluru, and Pune are trialing low-interest loans. These loans are designed to provide a comprehensive package that includes carts, chargers, and service contracts. The initial positive response indicates significant potential for sales growth, particularly as gated communities increasingly adopt zero-emission shuttles, expanding their use beyond traditional applications like golf courses.
Caribbean Resorts Piloting Solar-Hybrid Carts
In a recent workshop held in Barbados, a notable number of used electric vehicle batteries were successfully transformed into cart packs. This initiative not only extends the batteries' lifespan but also diminishes the region's reliance on imports. Buoyed by this success, resorts in Jamaica and the Dominican Republic are now eyeing the adoption of solar-hybrid fleets. These solar-hybrid carts are expected to reduce operational costs for resorts by leveraging renewable energy sources, aligning with the global push for sustainability. Additionally, the adoption of such fleets could enhance the eco-friendly image of these resorts, attracting environmentally conscious tourists. This shift is anticipated to bolster the growth of the golf cart market in the Caribbean.
Restraints Impact Analysis of Golf Cart Market*
| Restraint | (~) % Impact on CAGR | Geographic Relevance | Impact Timeline |
|---|---|---|---|
| Lithium-ion Pack Cost Volatility | -0.7% | Global, acute in import-dependent markets (Latin America, Africa, Southeast Asia) | Short term (≤ 2 years) |
| Declining Golf Membership | -0.5% | United Kingdom, Germany, France, Benelux | Medium term (2-4 years) |
| Municipal Fire-code Tightening for Cart Storage | -0.3% | North America, concentrated in California, Florida, Ontario, British Columbia | Short term (≤ 2 years) |
| Sparse Charging Infrastructure | -0.2% | Eastern Caribbean, smaller island nations with limited grid capacity | Long term (≥ 4 years) |
| Source: Mordor Intelligence | |||
Lithium-Ion Pack Cost Volatility
In recent years, battery pack prices have experienced a significant decline, reaching their lowest levels in over half a decade. Despite this reduction, the majority of cell production continues to be heavily concentrated in China, accounting for a substantial share of the global output. Import-dependent assemblers in regions such as Latin America and Africa face challenges due to disruptions in the supply chain, which have led to increased costs for imported components. According to the International Energy Agency, further cost reductions are anticipated in the coming years as advancements in lithium iron phosphate (LFP) and sodium-ion battery chemistries gain momentum and achieve greater scalability [3]“Trends in Battery Costs and Supply Chains,” International Energy Agency, iea.org . Yamaha's upcoming electric cart model, scheduled for release in the middle of the decade, features an innovative in-house battery pack utilizing LFP chemistry. This new design is expected to deliver significantly improved energy efficiency compared to earlier models that relied on lead-acid batteries, providing a more stable and reliable solution amidst market volatility.
Declining Golf Membership in Western Europe
In mid-2024, Custodian Golf issued a significant warning, highlighting that a considerable proportion of UK clubs are at risk of closure due to declining participation rates and increasing operational expenses. These challenges have negatively impacted the demand for golf carts. In the following year, Dalmuir, a municipal course in Scotland, ceased operations as local councils cited financial constraints. Furthermore, several golf clubs in England decided to sell their land for housing developments to address financial pressures. Clubs that continue to operate are now prioritizing cost-saving measures, such as extending the usage period of their golf carts instead of replacing their fleets on an annual basis.
*Our forecasts treat driver/restraint impacts as directional, not additive. The impact forecasts reflect baseline growth, mix effects, and variable interactions.
Golf Cart Market Segment Analysis
By Propulsion Type:
Solar-Hybrid Gains Traction Amid Grid ConstraintsElectric carts dominate with 78.81% share, anchored by mature charging infrastructure at most courses. The golf cart market size for solar-hybrid models, however, is projected to grow at a 5.83% CAGR, catalyzed by off-grid resorts seeking autonomy. Los Naranjos Golf Club cut electricity costs by 40% by adding rooftop panels, validating a five-year payback. LFP batteries displace lead-acid, improving energy density and cycle life, while Yamaha’s hydrogen fuel-cell concept hints at future diversification. Regulations such as EU 2023/1804 accelerate the pivot away from gasoline, narrowing long-term prospects for combustion carts.
Chinese suppliers offer CE-marked solar roofs bundled with 150 W trickle chargers priced under USD 400, making hybrids attractive for Southeast Asian and Caribbean operators. The golf cart market continues to absorb battery-reuse packs from end-of-life EVs, smoothing supply and lowering emissions footprints.


By Seating Capacity:
Four-Seater Configurations Gain in Family and Group UseTwo-seater units still hold the largest slice with 47.63% market share in 2025, yet four-seaters advance fastest on the back of Sun-belt residential adoption. The golf cart market size for four-seater models is forecast to expand 5.88% per year through 2031. Players like E-Z-GO’s Liberty and Yamaha’s five-seat G30Es bridge space efficiency with greater passenger accommodation.
Retirement communities retrofit rear-facing seats and cargo boxes, spurring aftermarket revenue. GCC mega-projects lean toward six- and eight-seater, air-conditioned carts for VIP and group play, shaping premium demand tiers.
By Vehicle Format:
Enclosed Designs Expand in Northern ClimatesOpen-top variants monopolized 77.71% of 2025 volume, but enclosed carts are climbing at a 5.93% CAGR. This trend is particularly evident in regions with colder climates, such as Canada and the northern United States, as well as in areas of Asia that experience heavy monsoon seasons.
Recent Federal Motor Vehicle Safety Standards (FMVSS) regulations are shaping the industry by encouraging the adoption of semi-enclosed designs for road-legal carts. This regulatory shift has led to a notable increase in the demand for components such as windshields, seat belts, and lighting kits. Additionally, resorts are increasingly incorporating climate-controlled cabins into their offerings. These cabins not only provide enhanced safety during extreme weather conditions, such as intense heat or heavy rainfall, but also serve as a means to elevate the overall brand value of the resorts.
By Application:
Commercial Services Accelerate Amid Labor ShortagesAlthough golf courses accounted for 57.78% of demand, commercial services post the briskest 5.85% CAGR. Theme parks, campuses, and airports adopt autonomous or dispatch-controlled carts to shrink shuttle labor costs.
Luxury hotels increasingly adopt electric carts to adhere to quiet-zone mandates, ensuring a serene environment for guests. At the same time, industrial facilities show a growing preference for utility beds, which are well-suited for transporting light cargo efficiently. In retirement hubs across the United States, personal mobility is gaining prominence as municipalities focus on expanding low-speed vehicle lanes. These lanes are designed to seamlessly connect residential areas with essential destinations, enhancing convenience for residents.
By Sales Channel:
Online Direct-to-Consumer Gains MomentumOffline dealers maintain 73.46% share, but the online channel grows 5.91% annually. E-Z-GO’s Reserve Now platform captures configurator-savvy buyers with eight-week delivery guarantees and USD 500 deposits. Yamaha's National Golf Cart Day effectively utilizes social media platforms to engage with potential customers, seamlessly guiding them toward its online shopping options as well as its network of physical retail partners.
At the same time, Chinese exporters are increasingly relying on online storefronts, such as those provided by Alibaba, and implementing pricing strategies based on purchase volumes to appeal to international fleet managers. These approaches are further intensifying the fragmentation within the golf cart market.
Geography Analysis
North America Golf Cart Market
North America, with 38.71% revenue in 2025, remains the anchor due to entrenched retirement-community culture and extensive course networks. FMVSS 305a harmonizes safety compliance, likely raising average selling prices but also spurring replacement of older fleets. Canada’s stricter fire codes add retrofit costs, while localized production by Club Car, Yamaha, and Textron ensures quick lead times and tailored service packages.
APAC Golf Cart Market
Asia Pacific is the fastest-rising region at a 5.87% CAGR. Thailand leads ASEAN adoption, supported by local manufacturers and tourism-driven cart demand. China’s market, already USD 134.47 million in 2022, could double by 2029 as applications widen to parks and industrial campuses. Japan’s preference for five-seat caddie carts pushes OEMs to integrate electromagnetic guidance for autonomous fairway loops. India’s township fleets enter pilot stage, signaling potential scale once bundled financing solidifies.
EMEA, South America and Caribbean Golf Cart Market
Europe blends opportunity and risk. Electrification mandates guarantee replacement demand, yet United Kingdom, German, and French membership attrition reduces volume upside. Clubs in Spain and Italy offset power costs through solar roofs and battery-storage pairs, breaking even within five years. South America and the Middle East trail in absolute numbers but post the steepest percentage gains, with GCC mega-projects setting premium benchmarks for enclosed, cooled carts. Caribbean islands pioneer solar-hybrid adoption as battery-reuse labs in Barbados illustrate circular-economy gains.
Mordor Intelligence provides coverage of the golf cart market across other key regional markets, including North America, each with their regulatory frameworks and demand patterns.

Regulatory Landscape
Regulation continues to split between golf-course-only vehicles and street-legal low-speed vehicles (LSVs). In the United States, LSVs that operate on public roads are governed by NHTSA under FMVSS No. 500 (49 CFR 571.500), which defines LSVs by governed top speed (more than 20 mph and not more than 25 mph) and drives requirements around road-safety equipment and certification pathways when carts are configured for neighborhood mobility.
For golf cars restricted to course use and lower speeds, compliance commonly aligns to industry standards rather than federal motor vehicle rules, notably ANSI/NGCMA Z130.1 for golf cars and ANSI/OPEI Z135-2020 for personal transport vehicles (PTVs) used on designated private roads and closed communities. In Europe, entry into on-road applications is shaped by the L-category framework (Regulation (EU) No 168/2013) and related delegated requirements (e.g., Delegated Regulation (EU) No 44/2014), which raises the bar for type-approval, documentation, and vehicle construction versus off-road, course-only deployment.
Value Chain Analysis
The value chain covers cell and pack supply (lead-acid and increasingly lithium chemistries such as LFP), power electronics, motors, chassis and body fabrication, and final assembly, then moves through distribution via dealer networks and fleet buyers in golf, resort, campus, and industrial settings. Major OEMs typically manage brand engineering, vehicle integration, and final assembly, while sourcing components globally. The supplier base includes batteries and parts from Asian manufacturing hubs as well as specialized subsystems such as GPS and telemetry modules that support fleet management and geofenced speed control, particularly in commercial services deployments.
On the manufacturing side, the market combines traditional OEM assembly models with ODM sourcing for smaller brands and regional distributors, alongside newer entrants taking more vertically integrated approaches that bring R&D, tooling, and assembly in-house to shorten iteration cycles. Trade and logistics considerations are reinforcing interest in regional production and CKD-style localization in markets building resort micro-mobility fleets or deploying carts for street-legal use cases. Aftermarket and service (charging equipment, replacement packs, tires, lighting, enclosures, and safety kits) remains a major downstream value capture point as fleets extend service life and retrofit to meet local operating rules.
Competitive Landscape
In the moderately concentrated market, Club Car, Yamaha Motor, and Textron Specialized Vehicles dominate global shipments and maintain robust dealer networks. By the end of the decade, Yamaha plans to merge its golf-car subsidiary with its parent company, consolidating its intellectual property for advancements in autonomous driving and battery technology. Club Car expanded its premium street-legal offerings with the acquisition of a luxury brand in recent years. Meanwhile, E-Z-GO is leveraging direct-to-consumer sales to protect its margins from the pressures of low-cost imports.
Chinese players like Suzhou Eagle, HDK Electric Vehicles, and Dongguan Excellence are significantly undercutting established brands by offering competitively priced models. These companies provide certified vehicles that meet international standards, appealing to cost-conscious buyers. Their agility on e-commerce platforms, combined with rapid development cycles, resonates strongly with budget-sensitive fleets in regions such as Southeast Asia and Latin America. Polaris GEM is making its mark in the street-legal low-speed segment, offering premium lithium-powered models. These vehicles are equipped with advanced features, including modern lighting systems, energy-efficient braking, and integrated smartphone connectivity.
Technological advancements are setting players apart: battery packs with enhanced efficiency promise significant energy savings, electromagnetic guidance enables routing without the need for depots, and cloud-connected fleet dashboards help reduce maintenance downtimes. Recent demonstrations of super-capacitor technology by Greentech suggest the potential for extremely fast charging, though the timeline for commercial availability remains unclear.
Golf Cart Industry Leaders
Yamaha Golf-Car Company
Textron Specialized Vehicles Inc.
Club Car LLC
Polaris Inc.
HDK Electric Vehicles
- *Disclaimer: Major Players sorted in no particular order
Golf Cart Market Companies Covered in this Report
- Club Car LLC
- Yamaha Golf-Car Company
- Textron Specialized Vehicles (E-Z-GO, Cushman)
- Columbia Vehicle Group (ParCar)
- HDK Electric Vehicles
- Suzhou Eagle EV Mfg. Co.
- JH Global Services (Star EV)
- Dongguan Excellence Golf & Sightseeing Car
- ICON EV
- Marshell Electric Vehicle
- Bintelli Electric Vehicles
- Xiamen Dalle Electric Car
- Polaris GEM (Polaris Inc.)
- Speedways Electric
- AgT Electric Cars
- CitEcar Electric Vehicles
- Kandi Technologies Group
- Tomberlin (Columbia)
- ELLWEE AB

Market Opportunities and Future Outlook
Growth whitespace is forming around regional manufacturing and distribution footprints that reduce freight exposure and improve lead times for fleet tenders. Concrete moves include Massimo Group commencing production of its 2026 MVR Golf Cart and MVR Cargo Max Electric Utility Cart through a Vietnam partnership facility (October 2025), and Kinetic Green Energy with Tonino Lamborghini forming a joint venture in Pune, India, to manufacture electric golf and lifestyle carts (July 2025), aligned to demand from gated communities, resorts, and GCC-linked premium fleets discussed in the report context. In the Caribbean, Innovative Energy Group announced plans to assemble electric golf carts in Jamaica (January 2026), reflecting efforts to serve island resorts where grid constraints and import dependency increase the appeal of local assembly, service support, and solar-hybrid configurations.
On the product side, opportunity centers on lithium adoption, fleet connectivity, and compliance-ready configurations for expanded on-road and campus use. The market is already led by electric propulsion (78.81% revenue share in 2025), and OEM roadmaps that emphasize LFP packs, smarter speed control, and telemetry align with commercial services requirements (resorts, theme parks, campuses, airports), where higher utilization makes downtime more consequential. Regulatory clarity on LSV definitions under FMVSS 500 and Europe’s L-category type-approval framework also creates room for manufacturers to standardize street-legal variants (lighting, restraints, glazing, and signaling) while managing cost targets against lower-priced import alternatives.
Recent Industry Developments in Golf Cart Market
- January 2026: E-Z-GO announced the next generation of the E-Z-GO Liberty vehicle for the 2027 model year, positioning it for both neighborhood mobility and golf course use. The update indicates continued product investment in multi-use platforms that can be configured for different duty cycles and compliance needs, supporting OEM differentiation beyond price.
- December 2025: Textron Specialized Vehicles launched enhanced Speed Control as a standard feature within its Pace Technology platform for E-Z-GO ELiTE electric golf cars and Cushman ELiTE electric utility vehicles. Standardizing this capability supports connected fleet management and geofenced operations for resorts, campuses, and industrial sites where safety governance and utilization tracking influence procurement.
- April 2024: Yamaha Motor Corporation publicly demonstrated a hydrogen-powered golf car for the first time at the Yamaha Marine Innovation Center in Kennesaw, Georgia. The prototype work expands the technology set beyond battery-electric for specialty and fleet applications, while keeping focus on energy storage and refueling pathways relevant to high-utilization operations.


Golf Cart Market Report Scope and Research Methodology
Market Definition and Coverage
The golf cart market, for this study, refers to revenues from newly manufactured, self-propelled golf carts that are mainly used to move people and gear across short, private routes such as golf courses, resorts, campuses, airports, and gated communities.
Scope exclusions: We exclude pre-owned unit resale values, aftermarket lift-kit conversions, and neighborhood electric vehicles that are designed for regular on-road use.
Segments Covered in This Report
- By Propulsion Type
- Electric Golf Carts
- Gasoline Golf Carts
- Solar-Hybrid Golf Carts
- By Seating Capacity
- 2 Seater
- 4 Seater
- 6 Seater
- 8+ Seater
- By Vehicle Format
- Open-Top
- Enclosed / Weather-proof
- By Application
- Golf Courses
- Personal / Residential Mobility
- Commercial Services (Resorts, Theme-Parks, Campuses)
- Industrial & Airport Utility
- By Sales Channel
- Offline (Dealers & Distributors)
- Online / Direct-to-Consumer
- By Geography
- North America
- United States
- Canada
- Rest of North America
- South America
- Brazil
- Argentina
- Rest of South America
- Europe
- Germany
- United Kingdom
- France
- Italy
- Spain
- Rest of Europe
- Asia Pacific
- China
- India
- Japan
- South Korea
- Rest of Asia Pacific
- Middle East and Africa
- United Arab Emirates
- Saudi Arabia
- South Africa
- Turkey
- Rest of Middle East and Africa
- North America
Data Sources, Market Sizing, and Validation
Desk Research
Desk research was used to set the base context and make sure the model inputs reflect real-world demand signals. We leaned on public sources such as US and international trade statistics for electric vehicles and parts, transportation and safety guidance for low-speed vehicles, and energy and emissions publications that influence adoption of electric carts.
To keep the market structure grounded, we also reviewed materials like company annual reports and investor presentations, golf and recreation industry association updates, relevant patent filings, and press coverage around fleet refreshes and new product launches. Select paid subscriptions were used only to speed up company financial checks and to scan patent and shipment-level trade records where available. The specific desk sources mentioned here are illustrative only, and many other public references were used for data collection, cross-checking, and clarification.
Primary Interviews and Surveys
Primary work focused on validating how carts are purchased and used across golf courses, hospitality properties, gated communities, airports, and industrial sites. We spoke with a mix of manufacturers, component suppliers, distributors, fleet operators, and large end users across APAC, EMEA, and the Americas, which helped us pressure-test adoption timing, replacement cycles, and average selling price movements.
Distribution of primary research fieldwork respondents
| Company type | Respondent position | Region |
|---|---|---|
| Top tier: 29% | CXOs: 13% | APAC: 44% |
| Mid tier: 56% | Functional/Unit leaders: 31% | EMEA: 34% |
| Smaller Players: 15% | Managers: 56% | Americas: 22% |
Market-Sizing & Forecasting
Sizing starts with a top-down reconstruction of the addressable cart demand pool by linking golf course and resort activity, fleet penetration in non-golf sites, and replacement-led buying patterns. We then translate that demand into revenue using price bands by power type and seating capacity. After that, we check results with selective bottom-up approximations, including sampled supplier and distributor roll-ups, channel checks, and sanity checks using units sold multiplied by representative ASPs, before final totals are adjusted.
Key inputs used in the model include installed fleet replacement cycles, the mix shift toward electric carts, seat capacity preferences (2 to 4 versus 6 plus), commercial fleet utilization patterns, and battery-related cost trends that influence pricing and buying timing. Forecasting uses scenario analysis supported by simple multivariate regression on variables that can be tracked consistently over time, and then is aligned with what industry participants expect for fleet refresh behavior and new site additions. Where bottom-up data is thin for smaller markets, gaps are handled using proxy indicators like site counts, tourism and hospitality capacity signals, and distributor coverage, and then reviewed again in follow-up calls.
Data Validation & Update Cycle
Each build goes through triangulation across independent signals, so a single data series does not drive the outcome. Outliers are flagged through variance checks at the region and application level, and assumptions are reviewed in more than one analyst pass before sign-off.
We also compare model outputs against practical indicators such as fleet replacement timing, price movements, and demand shifts between golf and non-golf uses, and then rework assumptions if the direction does not match what respondents are seeing. The report is refreshed annually, and interim updates are made when material events occur, including major regulation changes, pricing shocks, or sudden demand swings. Before delivery, a final update sweep is completed so clients receive the latest view available at that time.
Mordor Intelligence's Golf Cart Market Sizing Compared With Other Published Estimates
Published market sizes for golf carts can differ even when they look similar at first glance, since the scope line is not always drawn in the same place. Variations also come from the year used as the base, the way prices are converted to USD, and whether estimates are refreshed after new demand signals show up.
The main gap comes from whether street-legal neighborhood electric vehicles, pre-owned cart resale, or aftermarket conversions are counted. In Mordor Intelligence, we treat the market as revenues from newly manufactured golf carts used mainly on private, short-route sites, which keeps the totals aligned to new unit demand and realistic ASP assumptions.
Benchmark comparison
| Source | Market Size | Gaps in Research Methodology |
|---|---|---|
| Mordor Intelligence | USD 2.44 B (2026) | |
| Global Consultancy A | USD 2.12 B (2025) | Uses a 2025 base year and a longer horizon, and the stated scope language is broader around non-golf applications, which can shift unit mix and ASP assumptions versus a model anchored to new cart demand in private-site use. |
| Industry Publisher B | USD 2.06 B (2024) | Anchors estimates to 2024 and emphasizes low-speed mobility more generally, which can pull in adjacent vehicle types in practice and change the implied treatment of street-legal use and price progression. |
Overall, the spread is mainly explained by what gets included around adjacent low-speed vehicles, the chosen base year, and how prices are carried forward. By keeping the scope tied to new golf cart revenues and then cross-checking with replacement timing, site demand indicators, and practical ASP bands, our estimate stays transparent and repeatable with clear assumptions.


Key Questions Answered in the Report
How large is the golf cart market in 2026 and what annual growth is expected through 2031?
The sector is valued at USD 2.44 billion in 2026 and is projected to advance at a 5.81% CAGR, reaching USD 3.24 billion by 2031.
Which region currently generates the most golf cart revenue?
North America leads with 38.71% of 2025 revenue, supported by extensive retirement-community adoption and a dense golf-course network.
What vehicle format is gaining momentum with operators in colder or wetter climates?
Enclosed, weather-proof carts are expanding at a 5.93% CAGR as clubs and resorts in northern latitudes seek year-round operability and passenger comfort.
How quickly are online direct-to-consumer channels growing for golf cart sales?
Digital platforms, driven by initiatives such as E-Z-GO’s Reserve Now portal, are rising at a 5.91% CAGR, although traditional dealers still hold most sales today.
Which powertrain option is seeing the fastest uptake where grid access is limited?
Solar-hybrid carts, combining battery packs with rooftop panels, are scaling at a 5.83% CAGR as island resorts and off-grid courses pursue energy autonomy.
Who are the three dominant manufacturers in the sector?
Club Car, Yamaha Motor, and Textron Specialized Vehicles collectively control the largest share thanks to deep dealer networks, broad portfolios, and strong brand equity.
Page last updated on:


 Your data is secure and never sold or shared.


