
Biodegradable Packaging Solutions Market Size and Share
Market Overview
| Study Period | 2020 - 2031 |
|---|---|
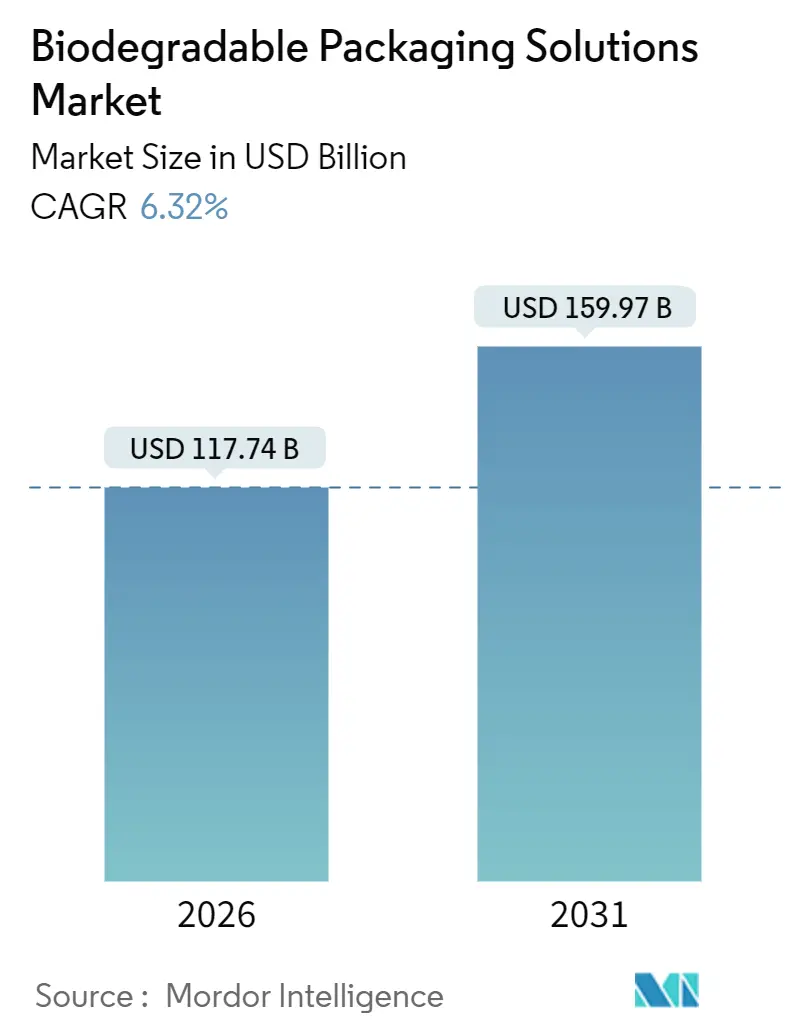
| Market Size (2026) | USD 117.74 Billion |
| Market Size (2031) | USD 159.97 Billion |
| Growth Rate (2026 - 2031) | 6.32 % |
| Fastest Growing Market | Asia Pacific |
| Largest Market | Europe |
| Market Concentration | Medium |
Major Players.webp) *Disclaimer: Major Players sorted in no particular order Image © Mordor Intelligence. Reuse requires attribution under CC BY 4.0. | |
Biodegradable Packaging Solutions Market Analysis by Mordor Intelligence
The biodegradable packaging solutions market size reached USD 117.74 billion in 2026 and is projected to advance to USD 159.97 billion by 2031, reflecting a CAGR of 6.32% over 2026-2031 and confirming the sector’s steady upward trajectory. Rising compliance costs for conventional plastics, stronger Extended Producer Responsibility (EPR) laws, and the accelerating pivot by brand owners toward end-of-life design are reinforcing demand across food, beverage, and personal-care value chains. Material innovation, particularly in polylactic acid (PLA) and polyhydroxyalkanoates (PHA), is enhancing process compatibility, while improvements in high-barrier bio-coatings are expanding shelf-stable and refrigerated applications previously reserved for aluminum-laminated or metallized films. Regional composting infrastructure additions, most notably in Europe and key urban areas of North America and the Asia-Pacific region, are alleviating a historic disposal bottleneck. Feedstock volatility remains a headline risk, yet vertically integrated players that control both agricultural inputs and polymerization assets are beginning to neutralize cost swings.
Key Report Takeaways
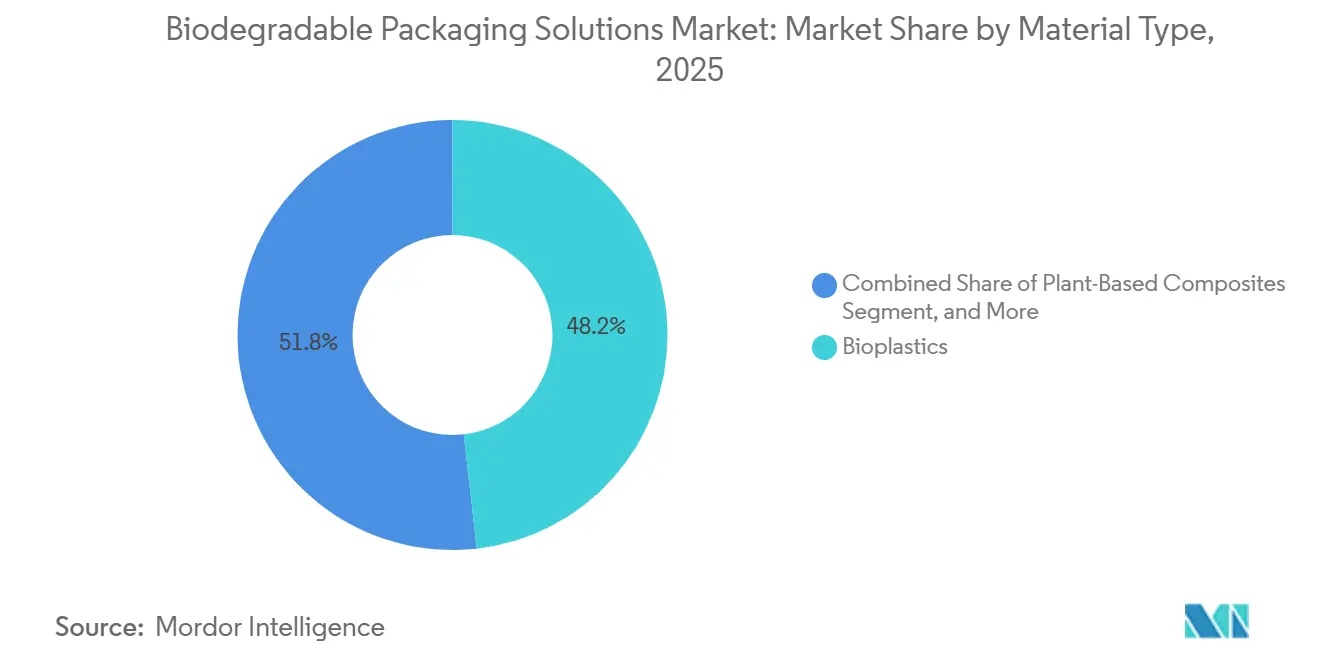
- By material type, bioplastics led with 48.21% revenue share in 2025, while plant-based composites are forecast to expand at 7.42% CAGR through 2031.
- By packaging format, flexible solutions commanded 56.32% of the revenue in 2025, whereas rigid formats are projected to post the fastest CAGR of 7.89% from 2026 to 2031.
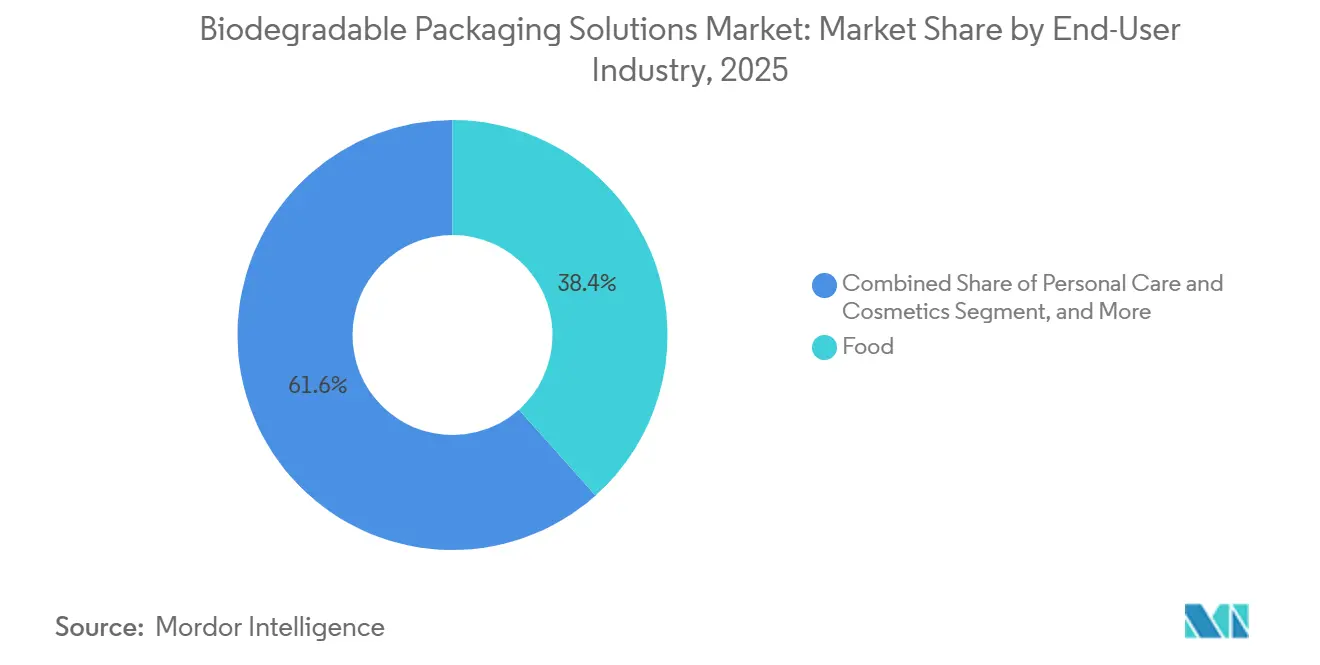
- By end-user industry, food applications accounted for a 38.42% share in 2025, while the personal care and cosmetics sector is expected to grow at an 8.23% CAGR over the forecast period.
- By distribution channel, direct sales secured a 58.31% share in 2025, while indirect channels are expected to register a 7.56% CAGR through 2031.
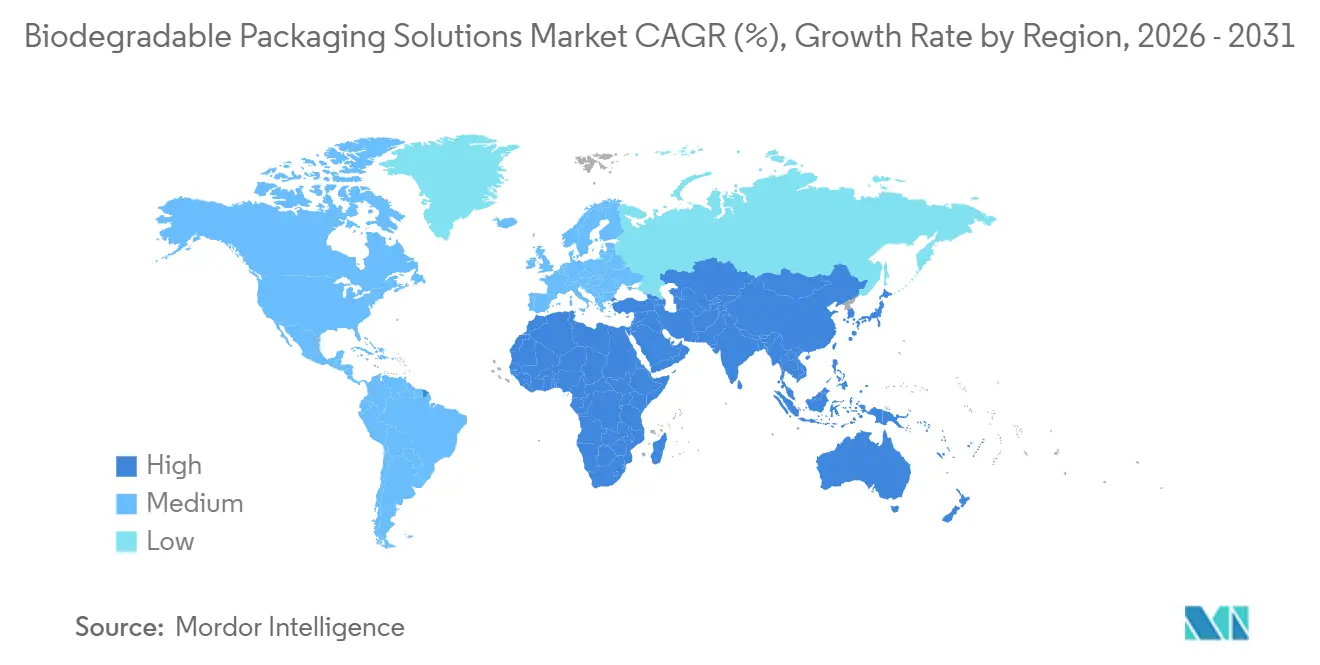
- By geography, Europe held a 40.21% revenue share in 2025, whereas the Asia-Pacific region is anticipated to record the highest 8.85% CAGR from 2026 to 2031.
Note: Market size and forecast figures in this report are generated using Mordor Intelligence’s proprietary estimation framework, updated with the latest available data and insights as of January 2026.
Global Biodegradable Packaging Solutions Market Trends and Insights
Drivers Impact Analysis*
| Driver | (~) % Impact on CAGR Forecast | Geographic Relevance | Impact Timeline |
|---|---|---|---|
| Growing Consumer Demand for Circular, Zero-Waste Packaging | +1.2% | Global, highest in North America and Europe | Medium term (2-4 years) |
| Expansion of Composting Infrastructure in Urban Centers | +0.9% | Europe core, North America and Asia-Pacific clusters | Long term (≥ 4 years) |
| Mandatory Extended Producer Responsibility Schemes Globally | +1.5% | Europe, Canada, select U.S. states, emerging Asia-Pacific | Short term (≤ 2 years) |
| Advances in High-Barrier Bio-Based Coatings Unlocking New Applications | +0.8% | Global, R&D in North America and Europe | Medium term (2-4 years) |
| Rapid Capacity Additions for PLA and PHA in Asia-Pacific | +1.1% | Asia-Pacific core, spill-over to Middle East and Africa | Short term (≤ 2 years) |
| Retailers' Private-Label Sustainability Targets Accelerating Adoption | +0.7% | Global, led by North America and Europe retail chains | Short term (≤ 2 years) |
| Source: Mordor Intelligence | |||
Growing Consumer Demand for Circular, Zero-Waste Packaging
Consumer surveys conducted in 2025 indicate that 67% of shoppers in Europe and North America now consider end-of-life disposal when making purchasing decisions, up from 52% in 2023. Millennials and Gen Z buyers, in particular, switch brands when sustainability claims appear weak, prompting quick-service restaurants to pilot compostable cutlery and clamshells that trimmed plastic waste by 15-20% in trial cities. Converters are responding by bolstering their technical-support teams, which help brands navigate certification processes and on-pack disposal messaging. Retailers use private-label lines as low-risk test beds for new materials, accelerating commercial validation cycles. This behavioral shift underpins stable price premiums that offset higher biopolymer costs and reinforces long-run demand for the biodegradable packaging solutions market.
Expansion of Composting Infrastructure in Urban Centers
The European Union allocated EUR 2.3 billion (USD 2.60 billion) from the 2024-2025 cohesion funds to build anaerobic digestion and windrow facilities across Eastern Europe, targeting a 50% organic waste diversion rate by 2030.[1]European Commission, “Packaging and Packaging Waste Regulation,” EUROPA.EU North American cities, such as San Francisco and Toronto, mandate curbside organics collection, ensuring a steady feedstock for compost operators and validating packaging performance under real-world conditions. China’s Ministry of Housing and Urban-Rural Development is piloting food-waste separation programs in 46 cities, while India’s Smart Cities Mission ties municipal grants to composting performance. Greater infrastructure density lowers reputational risk for brand owners and grants converters near composting hubs a logistics advantage through closed-loop take-back schemes.
Mandatory Extended Producer Responsibility Schemes Globally
The European Packaging and Packaging Waste Regulation, effective January 2025, imposes modulated fees that raise the cost of non-compostable plastics by 8-12%. Canada introduced a harmonized EPR framework in 2024, and four U.S. states enacted similar laws by 2025. These programs directly link material choice to producer levies, making compostable substrates a cost-avoidance strategy. Flexible films and pouches, which have historically been multilayered and non-recyclable, face the heaviest surcharges, prompting a rapid switch to certified compostable alternatives. Compliance schemes such as EN 13432 and ASTM D6400 have become de facto market-entry requirements, pushing converters to secure third-party certifications swiftly.
Advances in High-Barrier Bio-Based Coatings Unlocking New Applications
BASF’s Ecovio PS 1606 achieves oxygen transmission rates below 5 cm³/(m²·day·bar), enabling modified-atmosphere packaging for leafy greens.[2]BASF, “Ecovio PS 1606 Product Information,” BASF.COM NatureWorks’ Ingeo 3D850 withstands 110 °C, clearing hot-fill hurdles for sauces and beverages. These breakthroughs expand the addressable universe beyond dry foods to include refrigerated and shelf-stable categories, which represent roughly two-thirds of total packaging demand. The premium for bio-barrier coatings, currently USD 0.15-0.25 per kg, is still tolerable for premium personal-care and health-food brands. As production scales, cost curves are expected to decline, allowing mid-tier brand adoption by the late 2020s, thereby sustaining momentum in the biodegradable packaging solutions market.
Restraints Impact Analysis*
| Restraint | (~) % Impact on CAGR Forecast | Geographic Relevance | Impact Timeline |
|---|---|---|---|
| Volatile Availability of Agricultural Feedstocks for Biopolymers | -0.8% | Global, acute in North and South America | Short term (≤ 2 years) |
| Inadequate Sorting and Certification Standards Across Regions | -0.6% | Asia-Pacific, Middle East and Africa, Latin America | Medium term (2-4 years) |
| Performance Gaps in Moisture and Oxygen Barrier vs Conventional Plastics | -0.5% | Global | Medium term (2-4 years) |
| Risk of Greenwashing Litigations Increasing Compliance Costs | -0.4% | North America and Europe | Short term (≤ 2 years) |
| Source: Mordor Intelligence | |||
Volatile Availability of Agricultural Feedstocks for Biopolymers
Corn and sugarcane prices fluctuated 18-24% during 2024-2025, with U.S. corn yields down 12% after severe droughts.[3]U.S. Department of Agriculture, “Corn Yield Report 2024,” USDA.GOV Brazilian growers diverted acreage from sugarcane to soybeans, cutting cane output by 7% and tightening supply for PLA producers. Smaller converters lacking hedging capacity struggle to absorb these swings, sometimes delaying brand rollouts or ceding share to larger, vertically integrated rivals such as Total Corbion. Feedstock price instability can dampen substitution momentum if compostable formats exceed brand owners’ cost ceilings, potentially moderating near-term expansion of the biodegradable packaging solutions market.
Inadequate Sorting and Certification Standards Across Regions
Disparate compostability criteria, including EN 13432 in Europe, ASTM D6400 in the United States, and GreenPla in Japan, force multinational brands to maintain separate SKUs or limit geographic reach. Emerging markets often lack recognized certification bodies, creating space for unverified claims that erode consumer confidence. The Biodegradable Products Institute reported a 22% year-over-year increase in non-compliant packages submitted for testing in 2024. Waste processors also face contamination risks when uncertified films mix with mechanical-recycling streams. Without accelerated international harmonization, the resulting complexity will continue to restrain the biodegradable packaging solutions market through the mid-2020s.
*Our forecasts treat driver/restraint impacts as directional, not additive. The impact forecasts reflect baseline growth, mix effects, and variable interactions.
Segment Analysis
By Material Type: Bioplastics Anchor Share, Plant Composites Surge
Bioplastics retained a 48.21% share of the biodegradable packaging solutions market size in 2025, largely due to PLA’s compatibility with existing extrusion and thermoforming assets, which minimizes capital outlay during the transition. Starch-based polymers occupy low-performance niches such as loose-fill and agricultural mulch, while cellulose derivatives satisfy premium personal-care labels that demand transparency and printability. PHA fetches a price premium for marine biodegradability, appealing to coastal hospitality and seafood chains. PBS grades offer superior heat resistance, unlocking shelf-stable sauces and ready meals.
Plant-based composites, such as mushroom mycelium, seaweed films, and bagasse fibers, are forecast to grow at a 7.42% CAGR through 2031, the fastest among materials, as luxury electronics and cosmetics adopters seek texture-rich, story-driven substrates. Ecovative Design’s mycelium cushioning wins with electronics brands seeking plastic-free protective formats. Seaweed-based sachets that dissolve in water offer a novel user experience for condiment packets, while bagasse trays are gaining favor with quick-service restaurants seeking to eliminate expanded polystyrene. This diversity underscores how the biodegradable packaging solutions market benefits when functional performance and narrative marketing intersect.


By Packaging Format: Flexible Leads, Rigid Accelerates
Flexible formats commanded a 56.32% share in 2025, reflecting their lower mass-to-product ratio and transport efficiency, which are crucial for e-commerce mailers and quick-service wraps. Pouches for pet food and coffee gained traction as bio-barrier coatings narrowed oxygen-permeation gaps. Conversely, rigid formats are projected to track a robust 7.89% CAGR to 2031, driven by molded-pulp bottles and jars that beverage and dairy players are piloting to replace PET.
Stora Enso’s wood-fiber composite bottle demonstrates progress, pairing a fiber body with a thin bio-liner. Bottles and jars still face melt-strength hurdles with biopolymers, but active R&D is aimed at closing these gaps. The coexistence of flexible leadership and rigid acceleration reflects trade-offs between material efficiency and post-use sorting clarity within the biodegradable packaging solutions market.
By End-User Industry: Food Dominates, Personal Care Sprints
Food accounted for 38.42% of 2025 revenue, spanning the fresh produce, bakery, meat, and dairy segments, whose short shelf lives align with the performance windows of compostable films. Beverage players are trialing PLA bottles for still drinks, although carbonated variants remain PET-centric due to the retention of CO₂. Healthcare adoption remains cautious, given the need for sterility validation cycles.
Personal care and cosmetics are projected to grow at an 8.23% CAGR to 2031, as luxury brands adopt compostable packaging to reinforce natural ingredient narratives and justify premium pricing. L’Oréal’s pledge to eliminate virgin plastics from mass-market lines by 2030 exemplifies this momentum. E-commerce adopters also scale demand, catalyzed by Amazon’s commitment to transition 75% of fulfillment packaging to compostable formats by 2028, adding durable pull for the biodegradable packaging solutions market.
By Distribution Channel: Direct Sales Lead, Indirect Gains
Direct sales channels captured 58.31% share in 2025, reflecting large food-service and retail chains’ preference for bespoke formulations and volume contracts. McDonald’s and Starbucks co-develop compostable cups and cutlery directly with converters, locking in multiyear volume.
Indirect channels, projected to grow at a 7.56% CAGR through 2031, are gaining relevance as distributors build technical service capabilities for mid-tier brands that demand smaller batch sizes and faster lead times. Firms operating a dual-channel model secure revenue diversity and insulation against single account dependency, a critical strategy as the biodegradable packaging solutions market matures.
Geography Analysis
Europe contributed 40.21% of the biodegradable packaging solutions market share in 2025, driven by the Packaging and Packaging Waste Regulation, which mandates recyclability or compostability by 2030, and by well-established composting networks in Germany, France, and the Netherlands. Germany’s Verpackungsgesetz further tightened recycled-content thresholds, while France extended its ban on single-use plastics to fresh produce packaging in 2025, accelerating material substitution. The United Kingdom aligned its Plastic Packaging Tax post-Brexit, maintaining regulatory coherence with continental Europe.
Asia-Pacific is on track for the fastest 8.85% CAGR through 2031. China’s 2024 guidelines aim for a 40% reduction in single-use plastics by 2030 and spur investments in PLA and PHA capacity. India’s amended Plastic Waste Management Rules encourage the use of compostable alternatives, although enforcement varies by state. Japan’s Green Purchasing Law boosts demand in public procurement, and Australia’s 2025 packaging targets push national brands toward compostable formats. An expanding middle class and rapid e-commerce growth add consumption tailwinds, amplifying regional pull for the biodegradable packaging solutions market.
North America benefits from EPR rollouts in California, Oregon, Colorado, and Maine, yet lacks federal harmonization, creating patchwork compliance terrain. Canada’s 2024 federal EPR framework simplifies provincial divergence and elevates compostable adoption rates. Mexico’s proximity to U.S. brands positions it as a near-shoring hub for converters. South America remains nascent, with Brazil and Argentina hindered by uneven compost infrastructure and price sensitivity. The Middle East and Africa show sporadic adoption most notably in the United Arab Emirates and South Africa, where tourism and export-oriented sectors value sustainability credentials, though broader market development awaits infrastructure build-out.

Regulatory Landscape
Regulation-led material substitution is a primary demand catalyst, with the European Union providing the most prescriptive framework for compostable and biodegradable packaging. The EU Packaging and Packaging Waste Regulation, Regulation (EU) 2025/40 (PPWR), entered into force on 11 February 2025 and is scheduled to apply from 12 August 2026. It tightens requirements around packaging design, end-of-life pathways, and the conditions under which compostable packaging can be placed on the market. PPWR also references EN 13432 as a key harmonized benchmark for packaging recoverable through composting and biodegradation, which reinforces third-party certification as an operational requirement for suppliers selling into Europe.
Outside the EU, standards continue to shape how biodegradable claims are substantiated across regions and supply chains. ISO 17088:2021 remains a widely recognized specification for compostable plastics, while ISO 18606:2013 (organic recycling of packaging) was confirmed as current in 2024, supporting continuity for packaging design and conformity assessments. In 2025, ISO 15270-5:2025 added guidance for recovery and recycling of industrially compostable plastics, reflecting regulators' and waste-system operators' increasing focus on aligning compostable materials with controlled collection and treatment infrastructure, rather than unmanaged environmental biodegradation claims.
Value Chain Analysis
The biodegradable packaging solutions value chain runs from biomass sourcing (agricultural feedstocks and, in some cases, organic waste streams) to feedstock pre-processing and biorefining, resin and polymer manufacturing (PLA, PHA, PBS and other compostable polymers), conversion into packaging formats (films, pouches, trays, clamshells, cartons, and molded fiber structures), and then downstream distribution to brand owners, retailers, and foodservice operators. Brand owners and large retailers typically drive key decisions, since material choices affect product compliance, label claims, and end-of-life instructions. Converters and resin producers then translate these requirements into certified structures that can operate on existing extrusion, thermoforming, and lamination assets.
Key bottlenecks cluster around feedstock volatility, quality variability across bio-based inputs, and uneven waste-sorting and industrial composting capacity, which can constrain the usable footprint for certified compostable packaging. To address this, the chain is increasingly coordinated through cross-industry collaborations linking resin producers, converters, and end users, with the aim of closing performance gaps (barrier, heat resistance) and de-risking scale-up. Partnerships such as Walki and Lactips (November 2024) to develop biodegradable food packaging, along with broader brand-converter-material science collaborations, show that technical qualification, certification, and end-of-life fit have become shared responsibilities across the chain rather than isolated upstream or downstream tasks.
Competitive Landscape
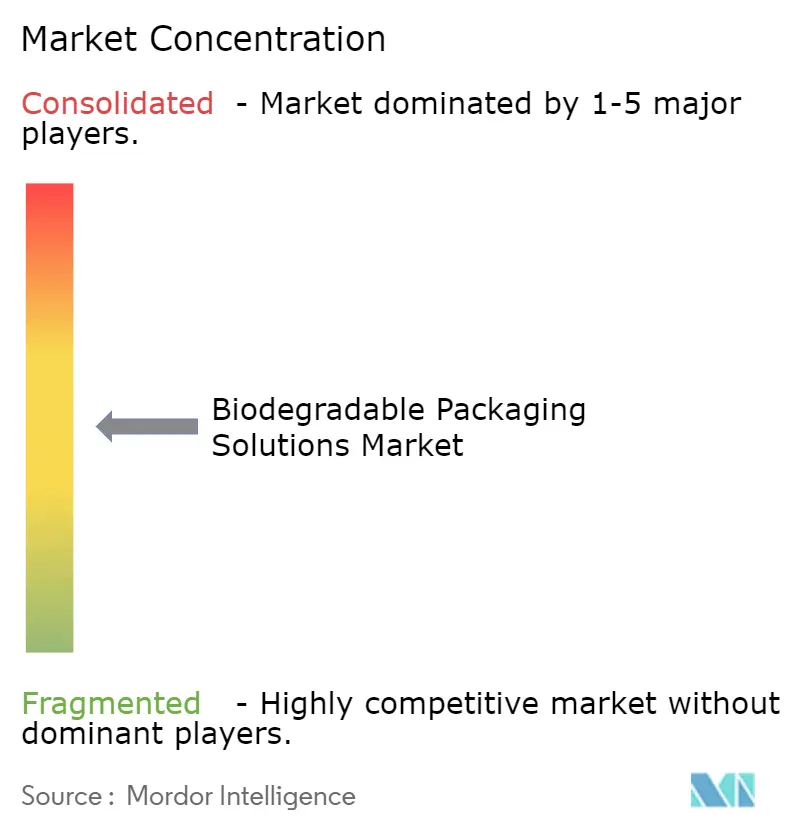
The biodegradable packaging solutions market remains moderately fragmented, as the top 10 players hold an estimated 35-40% combined share. Large, vertically integrated firms such as Amcor, Mondi, and Smurfit WestRock leverage global reach to co-design high-barrier laminates and secure multi-year supply contracts with multinationals. Polymer innovators, including BASF, NatureWorks, and Novamont, compete through performance enhancements, simultaneously acquiring or partnering with downstream converters to capture market share and margin. Regional specialists exploit niche substrates such as Ecovative’s mycelium cushioning and Notpla’s seaweed films to serve premium segments demanding brand differentiation.
Patent filings in bio-based barrier technologies increased 34% between 2024 and 2025, led by BASF, NatureWorks, and Stora Enso. White space remains in carbonated beverages and aseptic cartons, where current bio-coatings cannot yet match a 12-18-month shelf life; the first mover to crack this code could unlock a multi-billion-dollar opportunity. Closed-loop take-back programs, though logistics-intensive, offer compelling brand stories and customer lock-in for firms that can finance the infrastructure. Enzymatic depolymerization startups aiming to convert post-consumer PLA back into lactide monomers suggest future circularity pathways that could redefine competitive parameters within the biodegradable packaging solutions market.
Biodegradable Packaging Solutions Industry Leaders
Mondi Group
Tetra Pak International SA
Sealed Air Corporation
International Paper Company
Amcor plc
- *Disclaimer: Major Players sorted in no particular order

Market Opportunities and Future Outlook
One near-term opportunity is compliance-driven redesign in Europe as PPWR moves from adoption to mandatory application in August 2026. This raises the value of packaging structures that can document compostability to recognized standards and demonstrate compatibility with local collection and treatment systems. Suppliers that can support brands with certification workflows and on-pack disposal communication, while also delivering higher-barrier performance that reduces reliance on hard-to-recycle multilayer structures, are positioned to benefit. PPWR's allowance for Member States to restrict compostable packaging to specific applications also creates whitespace for companies targeting high-benefit use cases, for example where food-soiled packaging is difficult to recycle mechanically, paired with collection partnerships near established organics infrastructure.
Another opportunity area is scaling and cost normalization through new integrated capacity and regional supply creation, particularly in Asia-Pacific and India, where multiple investments point to active industrialization of compostable materials. In April 2026, NatureWorks opened an integrated Ingeo biopolymer manufacturing facility in Nakhon Sawan, Thailand, with 75,000 metric tonnes of annual capacity, supporting resin availability for converters serving flexible and rigid formats. In India, Pakka Ltd announced a Rs 750 crore expansion in April 2026 to double compostable packaging capacity to 246 metric tonnes per day at its Ayodhya facility, while Balrampur Chini Mills reported raising Rs 450 crore in May 2026 for PLA facility expansion in Uttar Pradesh, reflecting continued build-out of domestic feedstock-to-polymer supply. These projects support more localized sourcing for brand owners and converters, helping reduce lead times and increasing the feasibility of multi-country rollouts when certification and performance requirements can be met.
Recent Industry Developments
- April 2026: Tetra Pak partnered with Sterilgarda Alimenti to launch a 1-liter aseptic carton using a paper-based barrier instead of aluminum foil, raising renewable content to 90%. The launch reflects a push to decouple high-barrier packaging from conventional aluminum-layer structures and broadens the competitive set for fiber-based, lower-impact formats in shelf-stable categories. It also raises expectations for material suppliers and converters developing biodegradable and renewable barrier coatings that can operate in high-volume carton systems.
- December 2025: Tetra Pak partnered with Garcia Carrion to launch the Tetra Brik Aseptic 200 ml Slim Leaf carton featuring a paper-based barrier for juice products. This commercial launch validated paper-based barrier performance in a demanding liquid application and accelerated downstream interest in renewable barrier families beyond pilot-scale trials. It also reinforced the role of large carton platforms in pulling new barrier materials into mass-market beverage packaging.
- June 2024: Mondi and traceless teamed up to develop a coating solution derived from agricultural by-products for paper packaging applications. The collaboration targeted improved functional barriers for paper-based packaging and supported substitution away from conventional plastic coatings in formats where recyclability and compostability claims are scrutinized. It also highlighted how upstream material innovation partnerships are being used to speed qualification cycles for large packaging groups with global customer bases.


Research Methodology Framework and Report Scope
Market Definition and Coverage
This market covers packaging solutions that are designed to biodegrade after disposal and return to natural elements within a short time frame, typically within a year or less, and it is measured in revenue terms across global demand.
Scope exclusions: It does not count conventional plastic packaging that is recyclable only, and it excludes non-biodegradable barrier layers that do not meet biodegradation intent.
Segmentation Overview
- By Material Type
- Bioplastics
- Starch-Based Plastics
- Cellulose-Based Plastics
- Polylactic Acid (PLA)
- Polyhydroxyalkanoates (PHA)
- Polybutylene Succinate (PBS)
- Other Compostable Polymers
- Paper
- Molded Pulp Fiber
- Plant-Based Composites (Mushroom, Seaweed, Bagasse)
- Bioplastics
- By Packaging Format
- Rigid Packaging
- Bottles and Jars
- Trays and Clamshells
- Boxes and Cartons
- Other Rigid Packagings
- Flexible Packaging
- Films and Wraps
- Pouches and Bags
- Other Flexible Packagings
- Rigid Packaging
- By End-User Industry
- Food
- Beverage
- Healthcare and Pharmaceuticals
- Personal Care and Cosmetics
- E-Commerce and Retail
- Other End-user Industries
- By Distribution Channel
- Direct Sales
- Indirect Sales
- By Geography
- North America
- United States
- Canada
- Mexico
- South America
- Brazil
- Argentina
- Rest of South America
- Europe
- Germany
- United Kingdom
- France
- Italy
- Spain
- Rest of Europe
- Asia-Pacific
- China
- Japan
- India
- South Korea
- Australia
- Rest of Asia-Pacific
- Middle East and Africa
- Middle East
- Saudi Arabia
- United Arab Emirates
- Turkey
- Rest of Middle East
- Africa
- South Africa
- Egypt
- Nigeria
- Rest of Africa
- Middle East
- North America
Data Sources, Market Sizing, and Validation
Desk Research
Desk research was used to build the base structure of the market model and keep assumptions tied to observable packaging activity. We used public sources such as the US EPA for waste and materials context, Eurostat for packaging and trade indicators, UN Comtrade for cross-border flows of relevant material and packaging categories, and FAO for agriculture and fiber upstream signals. To keep the market boundaries practical, we also checked standards and policy references from sources such as ISO and the European Commission, since biodegradability claims and end-of-life rules can shape adoption.
Alongside this, we reviewed company filings, investor presentations, industry association pages, and reputable press to understand capacity additions, pricing direction, and product mix shifts between paper, molded fiber, and bioplastic options. Where helpful, paid subscriptions were used in limited ways for company financials and intelligence, news and financials screening, patent databases, and shipment-level trade views, which helped cross-check timelines and unit economics. These examples are not exhaustive, and other public and secondary sources were also referenced for data collection, validation, and clarification.
Primary Interviews and Surveys
Primary work focused on validating what is actually purchased as a biodegradable solution, how pricing is quoted (by weight, by piece, or by contract), and how buyers switch between flexible and rigid formats. We spoke with a mix of manufacturers, converters, distributors, and large end users, and coverage was balanced across APAC, EMEA, and the Americas so regional policy and composting infrastructure differences were reflected in the assumptions.
Distribution of primary research fieldwork respondents
| Company type | Respondent position | Region |
|---|---|---|
| Top tier: 28% | CXOs: 15% | APAC: 45% |
| Mid tier: 56% | Functional/Unit leaders: 25% | EMEA: 36% |
| Smaller Players: 16% | Managers: 60% | Americas: 19% |
Market-Sizing & Forecasting
Sizing starts with a top-down build where packaging demand is reconstructed by linking end use packaging volumes to penetration of biodegradable solutions across food, beverage, healthcare, personal care, and e-commerce. Those totals are then translated into value using format-specific pricing and mix splits across paper, molded fiber, plant-based composites, and bioplastics, since a material shift can change revenue even when units are steady.
To keep the model grounded, we corroborated the totals with selective bottom-up checks, such as sampled supplier revenue pools, channel checks on converter throughput, and price per kg and price per unit ranges shared by interviewees. A few inputs that mattered most were the share of flexible versus rigid formats, resin and fiber cost movement, average downgauging trends, regulatory push factors like EPR timing, and regional composting and collection readiness that affects usable demand. Forecasts were built using scenario analysis, where adoption rates and pricing progression were adjusted using expert consensus, and then stress tested against macro packaging consumption signals. When gaps showed up in smaller countries or niche end uses, proxy ratios from similar markets were applied and later corrected through additional calls.
Data Validation & Update Cycle
Outputs were validated by checking whether implied per capita packaging use, material mix, and price levels stayed within realistic ranges by region, and then by reviewing any sharp jumps that did not match policy or capacity timelines. When a variance looked too large, the driver was traced back to the specific assumption, and respondents were re-contacted to confirm whether the change was a real shift or a modeling artifact.
Before sign-off, the model goes through a multi-step review where another analyst checks formulas, currency conversions, and year alignment, followed by reasonableness checks against independent market signals. Reports are refreshed annually, and interim updates are made when material events occur, such as major bans, feedstock price shocks, or capacity disruptions. Right before delivery, a fresh pass is completed so clients receive the latest updated view.
Mordor Intelligence's Gobal Biodegradable Packaging Solutions Market Market Sizing Compared With Other Published Estimates
Published market sizes for biodegradable packaging often vary because the refresh timing, currency conversion month, and the way average selling prices are stepped forward can change the number even when underlying volumes look similar. Differences also come from what each publisher treats as a biodegradable solution versus an adjacent sustainable option.
In our checks, the biggest gap drivers were whether paper-based packaging is counted as fully biodegradable across all uses, how much of conventional packaging spend is included in the total, and whether prices are modeled from resin and fiber movements or kept flat over long periods. A tighter refresh cadence that re-validates price ladders and policy timing is usually what keeps the estimate consistent with the most recent buying behavior, which is how Mordor Intelligence ties the model back to realistic contract pricing and regional adoption signals.
Benchmark comparison
| Source | Market Size | Gaps in Research Methodology |
|---|---|---|
| Mordor Intelligence | USD 117.74 B (2026) | |
| Global Consultancy A | USD 527.51 B (2025) | This figure appears to use a much broader spend umbrella that can pull in wider biodegradable packaging categories and adjacent sustainable packaging types, which inflates totals relative to a solutions-only boundary. It also uses a different base year and may apply blended pricing across materials without separating flexible versus rigid price ladders. |
| Industry Publisher B | USD 501.27 B (2024) | The scope is stated at an overall biodegradable packaging market level, which likely counts a wider set of paper and paperboard packaging uses and may not filter by biodegradation intent and end-of-life conditions. The earlier base year and broad material baskets can also shift currency timing and average price assumptions versus a narrower solutions definition. |
The spread in the table mainly reflects scope and pricing treatment, not a disagreement that demand is rising. By keeping the inputs traceable to adoption by end use, format mix, and practical price progression, the market size stays easier to reproduce and to update when policy or feedstock conditions change.


Key Questions Answered in the Report
What is the projected value of the biodegradable packaging solutions market in 2031?
The market is expected to reach USD 159.97 billion by 2031.
Which material category is growing fastest within biodegradable packaging?
Plant-based composites such as mushroom mycelium, seaweed films, and bagasse products are forecast to grow at 7.42% CAGR through 2031.
Why is Asia-Pacific considered the high-growth region?
Robust policy mandates in China and India, coupled with rapid PLA and PHA capacity expansions, drive an anticipated 8.85% CAGR to 2031.
How do Extended Producer Responsibility schemes affect adoption?
EPR laws impose higher fees on non-compostable plastics, incentivizing brand owners to switch to certified biodegradable materials to lower compliance costs.
Which packaging format currently leads market share?
Flexible packaging, including films, wraps, and pouches, held 56.32% revenue share in 2025.
What major technical hurdle remains for biodegradable packaging?
Achieving moisture and oxygen barriers comparable to conventional plastics in carbonated beverage and aseptic applications continues to be a key challenge.
Page last updated on:


 Your data is secure and never sold or shared.


