
Glyphosate Herbicide Market Size and Share
Market Overview
| Study Period | 2021 - 2031 |
|---|---|
| Market Size (2026) | USD 11.48 Billion |
| Market Size (2031) | USD 15.58 Billion |
| Growth Rate (2026 - 2031) | 6.30 % |
| Fastest Growing Market | Asia Pacific |
| Largest Market | North America |
| Market Concentration | Medium |
Major Players *Disclaimer: Major Players sorted in no particular order Image © Mordor Intelligence. Reuse requires attribution under CC BY 4.0. | |
Glyphosate Herbicide Market Analysis by Mordor Intelligence
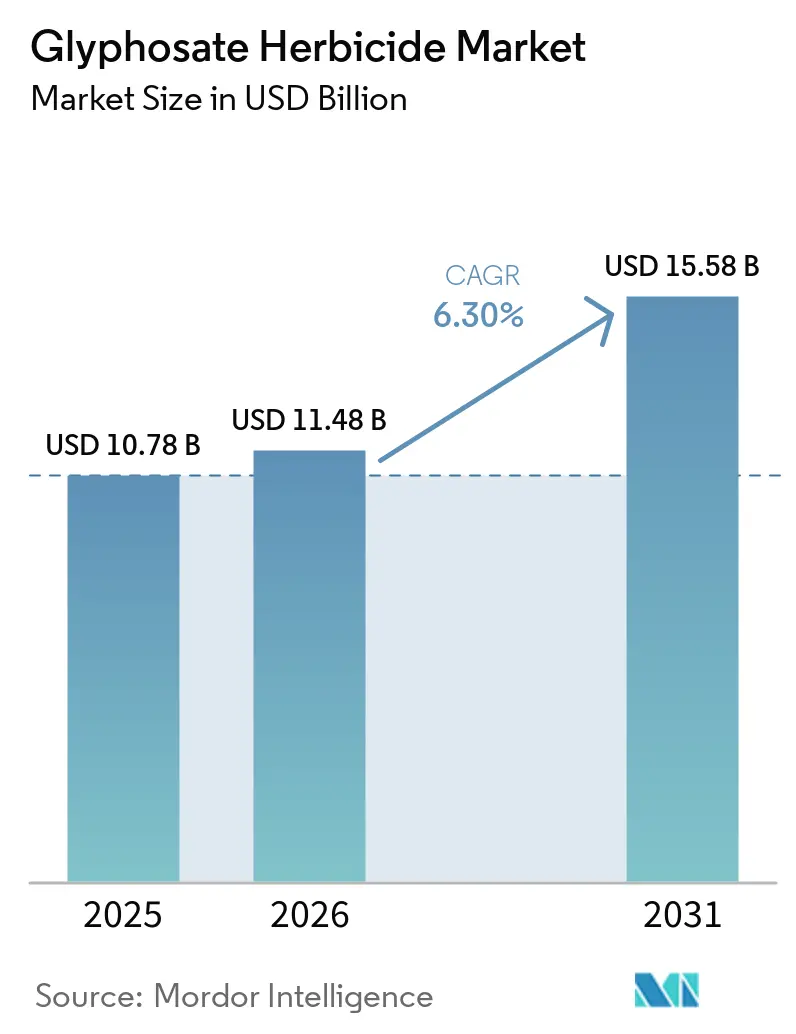
The glyphosate herbicide market size is projected to expand from USD 10.78 billion in 2025 and USD 11.48 billion in 2026 to USD 15.58 billion by 2031, registering a CAGR of 6.3% between 2026 to 2031. The outlook is underpinned by entrenched use of glyphosate-tolerant crops, capacity consolidation that steadies pricing, and gene-editing pipelines that keep the molecule relevant even as litigation and resistance pressures mount. Branded suppliers are pivoting toward over-the-top applications in the Americas, where farmers' willingness to pay a premium for consistent formulations persists. Meanwhile, stabilized technical prices offer producers margin visibility, and regenerative no-till programs supported by carbon credits reinforce baseline demand in North America and parts of Europe. In emerging regions, incremental acreage additions in Africa and the Sahel, combined with rising labor costs that favor chemical weed control, further propel market growth.
Key Report Takeaways
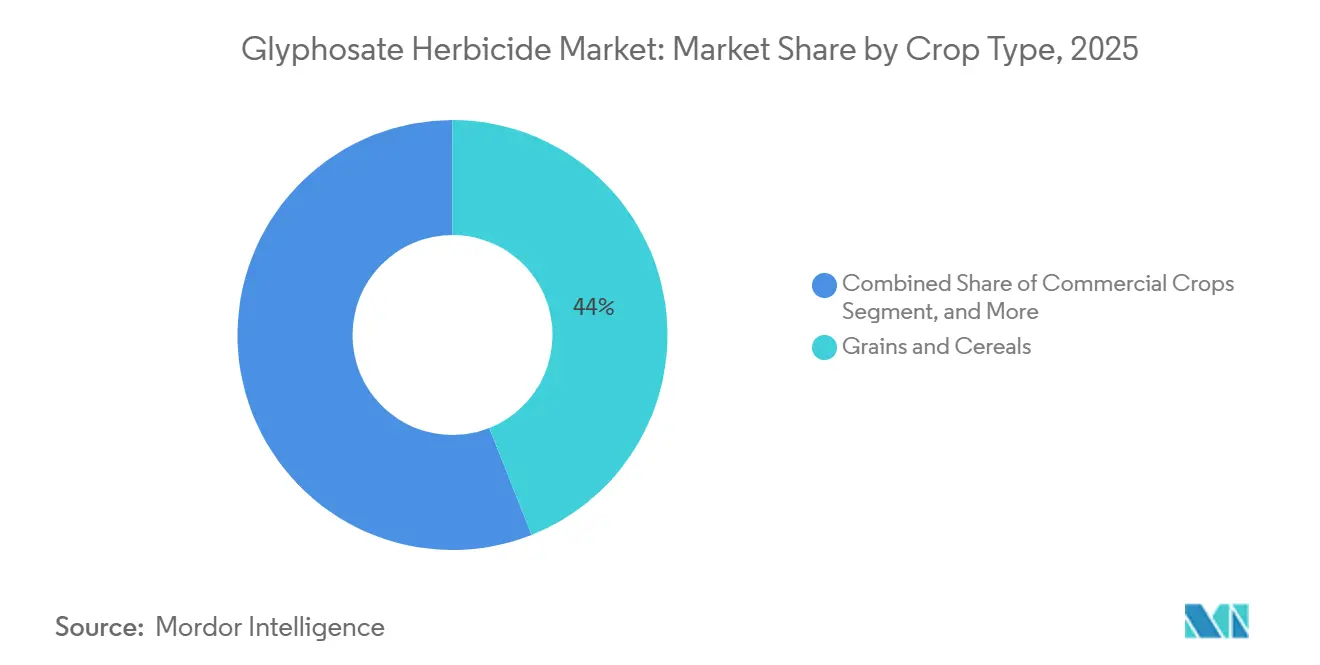
- By crop type, grains and cereals accounted for 44.0% of the glyphosate herbicide market share in 2025, while commercial crops are projected to advance at a 6.8% CAGR through 2031.
- By biotechnology adoption, genetically modified crops represented 60.0% of the glyphosate herbicide market share in 2025, and are projected to grow at a 6.5% CAGR through 2031.
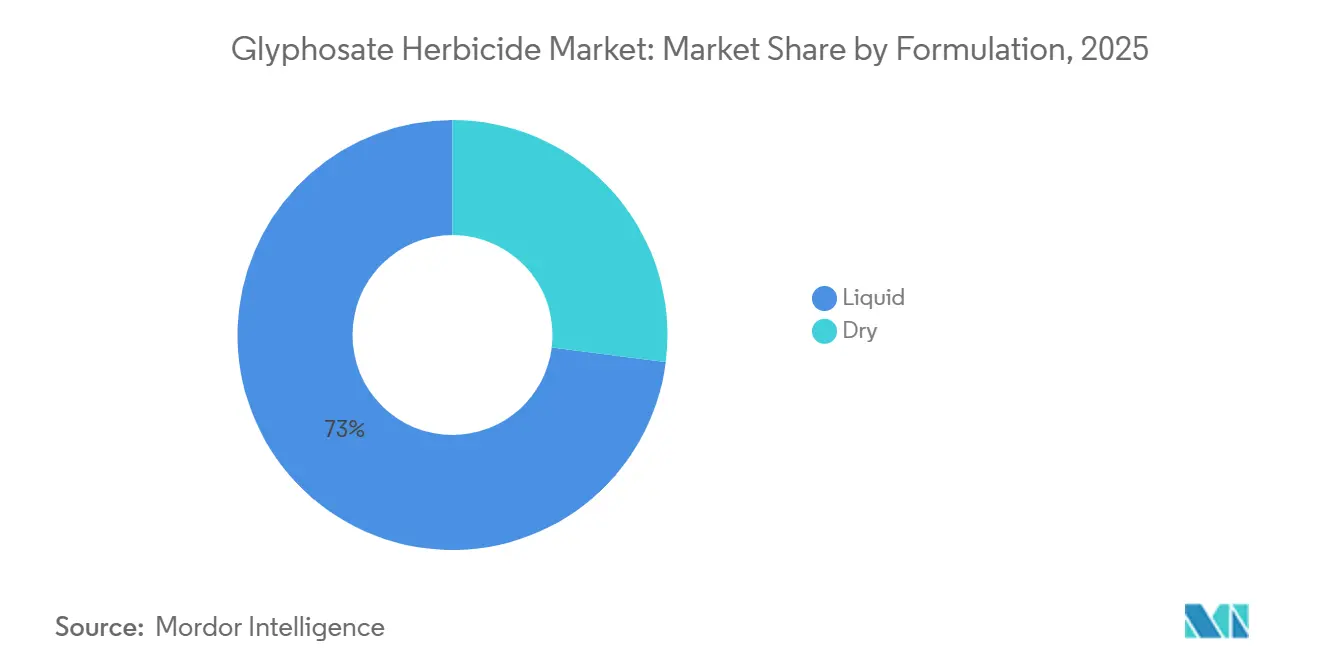
- By formulation, liquid formulations commanded a 73.0% market share in 2025, and dry formulations are forecast to grow at a 7.3% CAGR through 2031.
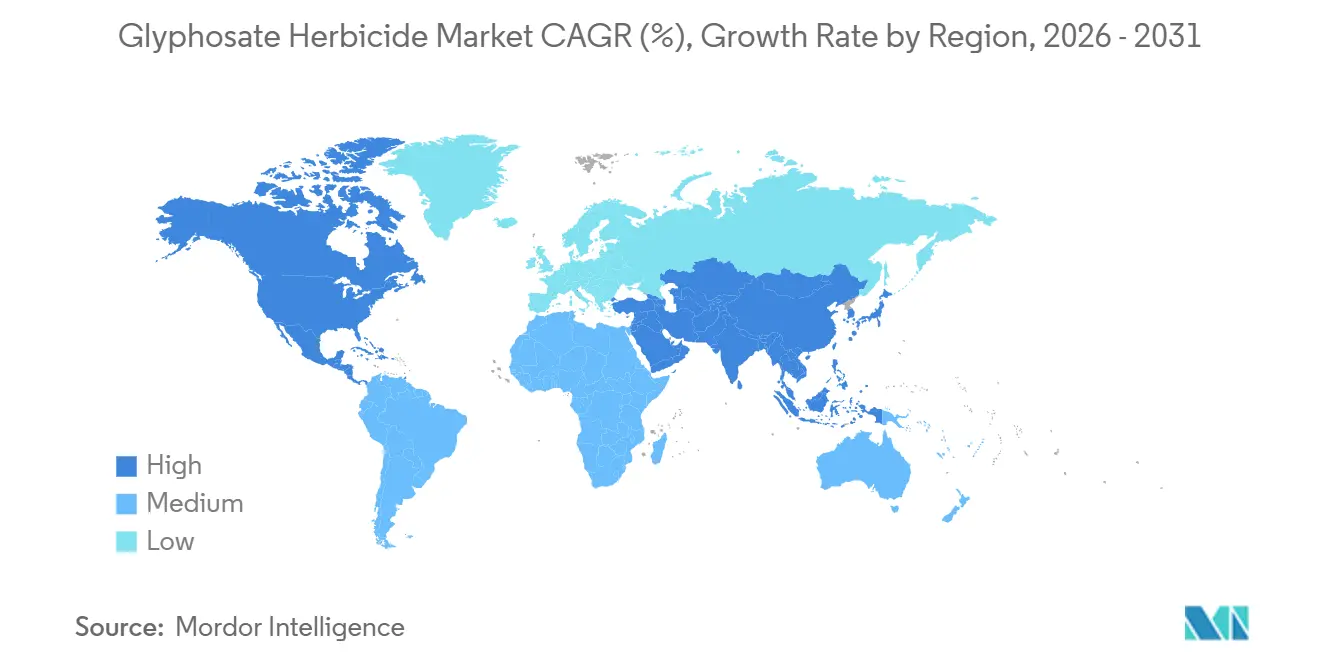
- By geography, North America held a 30% share of the glyphosate herbicide market in 2025, while Asia-Pacific is projected to deliver the fastest regional growth at a 6.90% CAGR through 2031.
Note: Market size and forecast figures in this report are generated using Mordor Intelligence’s proprietary estimation framework, updated with the latest available data and insights as of January 2026.
Market Trends and Insights
Drivers Impact Analysis of Glyphosate Herbicide Market*
| Driver | (~) % Impact on CAGR Forecast | Geographic Relevance | Impact Timeline |
|---|---|---|---|
| Commercialization of Genetically Modified (GM) herbicide-tolerant crops | +1.8% | North America, South America, and Asia-Pacific | Long term (≥ 4 years) |
| Rising demand for effective weed-control solutions | +1.2% | Asia-Pacific, Africa, and South America | Medium term (2-4 years) |
| Expansion of agricultural land and intensified farming | +1.0% | South America, Africa, and Asia-Pacific | Medium term (2-4 years) |
| Capacity consolidation stabilizes long-term prices | +0.9% | North America, Europe, and Asia-Pacific | Short term (≤ 2 years) |
| Carbon-credit backed regenerative no-till acreage | +0.7% | North America, Europe, and select South America | Long term (≥ 4 years) |
| Clustered Regularly Interspaced Short Palindromic Repeats (CRISPR)-based stacked-trait pipelines | +0.6% | North America, and South America | Long term (≥ 4 years) |
| Source: Mordor Intelligence | |||
Commercialization of Genetically Modified (GM) Herbicide-Tolerant Crops
The ongoing regulatory approvals and increasing adoption of genetically modified herbicide-tolerant crops by farmers are driving glyphosate demand as growers integrate into seed-and-chemistry systems. In June 2025, Argentina's Secretaría de Agricultura approved the commercial release of the stacked maize event MON-87427-7 x MON-94804-4 x MON-00603-6. This event combines reduced plant height with glyphosate tolerance, following favorable evaluations by the National Advisory Commission on Agricultural Biotechnology (CONABIA) and the National Service of Agri-Food Health and Quality (SENASA), which concluded that the stacked event poses no additional risks compared to conventional maize[1]Source: Ministerio de Economía, “Resolución 91/2025,” boletinoficial.gob.ar. As seed companies incorporate more traits into glyphosate-tolerant crops, glyphosate becomes a standard input, stabilizing demand against short-term price fluctuations and competition from alternative herbicides.
Rising Demand for Effective Weed-Control Solutions
Labor shortages and increasing wages in key agricultural regions are encouraging growers to adopt chemical weed control as a cost-effective alternative to manual or mechanical methods. This trend is particularly evident in the Asia-Pacific region, where smallholder farms face rising opportunity costs for family labor, and in Africa, where commercial agriculture is expanding faster than the availability of seasonal workers. Glyphosate's broad-spectrum efficacy and relatively low application cost per hectare make it a preferred choice for pre-plant burndown and post-emergence weed control in both genetically modified (GM) and non-genetically modified (non-GM) cropping systems. Its systemic action, which translocates to roots and rhizomes, effectively controls perennial weeds such as Cynodon dactylon and Cyperus rotundus, which are often resistant to mechanical tillage. For example, product labels in Argentina now include warnings about resistant Sorghum halepense biotypes and recommend consulting technical advisors for resistance management and combination strategies.
Expansion of Agricultural Land and Intensified Farming
The expansion of soybean and maize cultivation in South America and Africa is increasing herbicide application rates as growers shift from extensive grazing or fallow land to intensive row-crop farming. In Brazil and Argentina, the conversion of cerrado and pampas into soybean plantations has led to more frequent glyphosate applications to manage volunteer crops and invasive grasses during the establishment phase. Similarly, African countries expanding cotton and maize production in the Sahel and East Africa are adopting herbicide-based weed control to achieve export-competitive yields. This intensification of land use reduces fallow periods, limiting natural weed suppression and necessitating chemical interventions to maintain uniform crop stands. Higher yields justify the additional cost of herbicide inputs, and as farm mechanization increases, the convenience of glyphosate spraying compared to manual weeding or inter-row cultivation becomes more appealing.
Capacity Consolidation Stabilizes Long-Term Prices
Recent mergers and asset divestitures have addressed global glyphosate overcapacity, leading to improved producer margins and stabilized prices following the volatility experienced between 2020 and 2023. BASF's acquisition of Bayer's glufosinate business and certain European glyphosate-based herbicides, valued at EUR 7.6 billion (USD 9.0 billion), was part of a divestiture package required by the European Commission to preserve competition after Bayer's acquisition of Monsanto. This transaction streamlined production assets and R&D pipelines, reducing the number of independent suppliers and enabling more efficient utilization of capacity. According to Bayer's 2024 investor presentation, Chinese generic glyphosate technical prices have returned to the 15-year historical median, while prices for branded glyphosate-based herbicides have stabilized following a significant post-pandemic correction.
Restraints Impact Analysis of Glyphosate Herbicide Market*
| Restraint | (~) % Impact on CAGR Forecast | Geographic Relevance | Impact Timeline |
|---|---|---|---|
| Regulatory restrictions and phased bans | −1.1% | Europe, spillover to Middle East and select Asia | Medium term (2-4 years) |
| Accelerating weed resistance in major crop belts | −0.8% | North America, South America, and Asia-Pacific | Short term (≤ 2 years) |
| Litigation-driven exit risk for branded suppliers | −0.6% | North America, and Europe | Medium term (2-4 years) |
| Venture funding shift to bio-herbicide start-ups | −0.4% | North America, and Europe | Long term (≥ 4 years) |
| Source: Mordor Intelligence | |||
Regulatory Restrictions and Phased Bans
European Union and sub-national regulatory actions are trimming long-term demand by restricting glyphosate use in public spaces, near water bodies, and in organic-certified production systems. The European Food Safety Authority conducted a comprehensive risk assessment and peer review of glyphosate in 2023, concluding that no critical areas of concern were identified, and data gaps remained[2]Source: European Food Safety Authority, “La EFSA explica la evaluación científica del glifosato,” efsa.europa.eu. Despite this scientific assessment, political pressure and precautionary-principle interpretations have led several member states to impose partial bans or require integrated pest management plans that prioritize non-chemical alternatives. These restrictions reduce the addressable market size in Europe and create regulatory uncertainty that discourages long-term investment in glyphosate production capacity. Compliance with these evolving frameworks requires manufacturers to maintain multiple product formulations and labeling variants, which increases administrative costs and complicates supply-chain logistics.
Accelerating Weed Resistance in Major Crop Belts
Resistant Amaranthus and Ryegrass species are forcing higher doses and tank-mix combinations, eroding the cost advantage that made glyphosate the default choice for weed control. Peer-reviewed research documented in Argentina identified glyphosate-resistant biotypes of Sorghum halepense in core soybean regions, with resistance mechanisms including target-site mutations in the EPSPS enzyme, gene amplification, and reduced translocation to meristematic tissues. Agronomists are responding by recommending pre-emergence residual herbicides, post-emergence tank mixes with alternative modes of action, and mechanical weed control during critical crop-establishment windows. While these integrated approaches sustain total herbicide demand, they dilute glyphosate's market share and reduce per-hectare profitability for manufacturers. The resistance dynamic also accelerates the commercial adoption of herbicide-tolerant traits for alternative chemistries, such as dicamba and 2,4-D, which directly compete with glyphosate for acreage.
*Our forecasts treat driver/restraint impacts as directional, not additive. The impact forecasts reflect baseline growth, mix effects, and variable interactions.
Glyphosate Herbicide Market Segment Analysis
By Crop Type:
Commercial Crops Outpace Staple GrainsGrains and cereals held a 44.0% glyphosate herbicide market share in 2025. This dominance is attributed to the cultivation of soybeans and maize in North and South America, where glyphosate-tolerant varieties are widely used, and pre-plant burndown applications are a common practice. Pulses and oilseeds held a notable secondary share, driven by the use of glyphosate for pre-harvest desiccation in crops such as lentils, chickpeas, and canola. This practice facilitates synchronized maturity and reduces harvest moisture content. Fruits and vegetables represent a smaller segment of the market, as many high-value crops are cultivated under organic or integrated pest management systems that limit the use of glyphosate. Some tree-fruit orchards utilize glyphosate for under-canopy weed control.
Commercial crops, including cotton, sugarcane, and plantation crops, are forecast to grow at a 6.8% CAGR through 2031. This growth is driven by the adoption of desiccation protocols that enhance fiber quality in cotton and streamline harvest scheduling in sugarcane. In Argentina, the regulatory framework supports this expansion by authorizing glyphosate-tolerant cotton varieties and enforcing residue compliance through the National Service of Agri-Food Health and Quality (SENASA), providing legal assurance for growers and exporters[3]Source: ATANOR S.C.A., “etiq Glifosato II x 20L,” atanor.com.ar . Other crops, such as pastures and forestry, along with non-agricultural applications like railway and roadside maintenance, contribute a stable but slower-growing share of the market. Infrastructure maintenance budgets and public-sector procurement cycles influence demand in these segments.


By Biotechnology Adoption:
Trait Systems Lock in DemandGenetically Modified (GM) crops accounted for 60.0% of the glyphosate herbicide market size in 2025 and are projected to grow at a 6.5% CAGR through 2031. The expansion of this segment highlights the institutional adoption of herbicide-tolerant traits in major exporting countries. Seed companies in these regions integrate glyphosate tolerance with other traits, including insect resistance, drought tolerance, and yield enhancement, creating comprehensive systems that are challenging for farmers to separate.
The segmentation of the glyphosate herbicide market reveals a strategic divide within the global seed industry. In regions where Genetically Modified (GM) crops are widely accepted, such as the Americas and parts of Asia, seed companies are focusing on next-generation trait stacks. These stacks extend glyphosate's commercial relevance by incorporating tolerance into CRISPR-edited backgrounds that provide additional agronomic benefits. Conversely, in regions where the adoption of Genetically Modified (GM) crops is restricted, such as Europe and parts of Africa, manufacturers are prioritizing improvements in glyphosate formulations and application technologies to enhance its effectiveness in conventional cropping systems.
By Formulation:
Dry Products Gain Ground in Logistics-Constrained RegionsLiquid formulations commanded 73.0% of the glyphosate herbicide market share in 2025, driven by their ease of tank-mixing, compatibility with precision-spray equipment, and established distribution infrastructure. These formulations also offer lower per-hectare application costs due to reduced labor requirements for handling and mixing compared to dry products. The choice of formulation has strategic implications for manufacturers and distributors. Liquid products necessitate investments in bulk storage tanks, filling lines, and hazardous-material transport certifications, creating entry barriers for smaller regional players. Meanwhile, the growing preference for dry formulations in emerging markets reflects a shift toward decentralized distribution, where smallholder farmers procure inputs from village-level retailers instead of manufacturers or large agri-retailers.
Dry formulations are forecast to grow at a 7.3% CAGR through 2031, driven by increasing adoption in Africa and parts of the Asia-Pacific. Distributors in these regions favor granular products due to their reduced transport weight, minimized storage requirements, and ease of handling in areas with limited cold-chain infrastructure. Additionally, dry formulations are advantageous in markets with unreliable water quality, as they can be pre-mixed with known water volumes, avoiding compatibility issues that may arise when liquid concentrates are diluted with hard or saline water. These formulations can also be packaged in smaller units and distributed through general agricultural-input retailers, reducing the capital intensity of market entry. This approach requires more extensive dealer training to ensure proper reconstitution and application.
Geography Analysis
North America Glyphosate Herbicide Market
North America’s 30% share of the glyphosate herbicide market in 2025 is driven by the widespread adoption of no-till soy and corn farming systems. Over 80% of growers in the region rely on herbicides for burndown and in-crop applications. In Canada, similar practices are observed in prairie wheat and canola farming, while Mexico's shift to mechanized maize farming is contributing to steady incremental demand. Litigation poses a significant risk to the market, as pending cases could impact domestic supply if Bayer were to exit the market. To address this, state-level liability shields, such as those enacted in Georgia, aim to ensure continued production. The United States remains the largest single-country market, supported by carbon-credit programs that incentivize no-till farming. These programs sustain pre-plant glyphosate applications, even as increasing weed resistance necessitates higher doses and tank-mix combinations.
APAC Glyphosate Herbicide Market
The Asia-Pacific region is projected to deliver the fastest regional growth, at a 6.90% CAGR, by 2031. In China, pesticide volumes have stabilized at approximately 240-250 million metric tons, with glyphosate remaining among the top 10 active ingredients. India's agrochemical value chain is expanding, with increasing volumes of generic glyphosate as farmers adopt cost-effective weed control methods. Countries such as Indonesia, Vietnam, and Thailand are increasingly adopting pre-plant burndown practices to support double cropping. In Australia, broadacre cereal farms exhibit mature but steady demand, bolstered by precision guidance systems that optimize the application of inputs. India's regulatory environment remains cautious, with periodic reviews of glyphosate registrations and state-level restrictions in areas where environmental advocacy groups have raised concerns about groundwater contamination.
South America Glyphosate Herbicide Market
South America ranks second in glyphosate consumption, largely due to Brazil's projected 322.3 million metric ton grain harvest in 2025, which drives high herbicide usage. No-till farming spans over 35 million hectares in the region, making glyphosate essential for controlling grass weeds prior to planting. In Argentina, currency challenges have heightened price sensitivity but have not reduced reliance on glyphosate. Regional technological advancements, such as Syngenta's USD 65 million facility in Paulínia, focus on developing tropical-climate formulations to maintain efficacy under high humidity, supporting long-term market growth. In Brazil's cerrado region, the conversion of pasture and savanna into soybean plantations continues to drive incremental demand for glyphosate in pre-plant burndown and post-emergence weed control. Both Brazil and Argentina face increasing weed resistance, particularly in species like Amaranthus and Sorghum halepense. This has led agronomists to advocate for integrated weed management programs that combine residual herbicides with mechanical control methods.

Regulatory Landscape
Glyphosate regulation continues to diverge by region, combining periodic scientific reviews with political scrutiny and litigation risk. In the European Union, glyphosate was renewed under Commission Implementing Regulation (EU) 2023/2660, keeping the active substance approved through 15 December 2033, with continued oversight under the EU pesticide framework (Regulation (EC) No 1107/2009) and ongoing attention to data gaps raised during the 2023-2024 scientific exchanges led by EFSA and ECHA.
In the United States, glyphosate remains under EPA registration review after a court-ordered withdrawal of the interim decision, so timing and labeling outcomes remain a key compliance variable for registrants and downstream formulators. In Brazil, the tripartite system (ANVISA, IBAMA, and MAPA) continues to update post-registration requirements; ANVISA published updated standards in May 2026 establishing toxicological classifications and reference doses for active ingredients used in pesticides, adding more documentation and stewardship expectations for suppliers active in Latin America.
Competitive Landscape
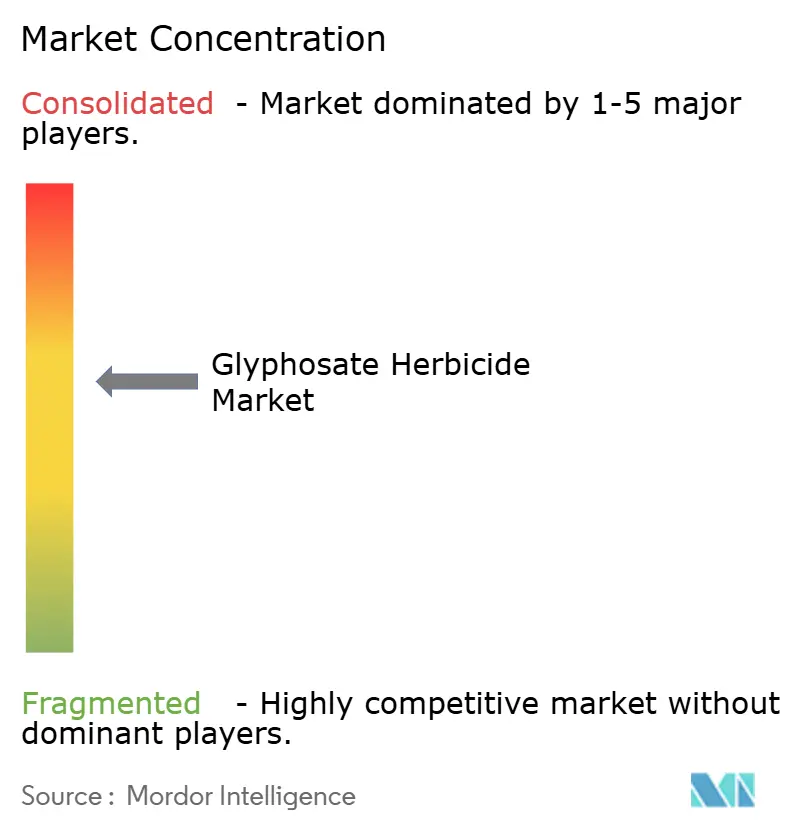
The glyphosate herbicide market exhibits moderate concentration, with key players such as Bayer AG, Zhejiang Xinan Chemical Industrial Group Co., Ltd., BASF SE, Syngenta Group Co., Ltd., and UPL Limited accounting for a significant share of technical-grade production. Bayer's USD 16 billion litigation provisions have introduced considerable uncertainty regarding its market position. Any potential withdrawal by Bayer could significantly disrupt supply chains for formulators and pose challenges for downstream manufacturers.
Chinese manufacturers have undertaken coordinated facility shutdowns in response to strict environmental audits. These measures have effectively reduced market oversupply and contributed to price stability within the industry. Companies with diversified product portfolios have demonstrated greater operational flexibility. For instance, in 2025, FMC Corporation's strategic partnership with Bayer to distribute Isoflex herbicide across 30 million hectares of European Union cereal crops successfully integrated new modes of action with existing glyphosate applications.
Industry organizations, such as the Modern Ag Alliance, continue to advocate for science-based regulatory assessments to ensure the continued availability of glyphosate in agricultural markets. Additionally, digital agriculture platforms have enhanced the value proposition of glyphosate products by offering features such as comprehensive tank-mix guidance, detailed residual analysis, and advanced drift-control recommendations. These advancements have strengthened customer relationships and promoted sustainability throughout the supply chain.
Glyphosate Herbicide Industry Leaders
Bayer AG
Zhejiang Xinan Chemical Industrial Group Co., Ltd.
BASF SE
Syngenta Group Co., Ltd.
UPL Limited
- *Disclaimer: Major Players sorted in no particular order
Glyphosate Herbicide Market Companies Covered in this Report
- Bayer AG
- Zhejiang Xinan Chemical Industrial Group Co., Ltd
- BASF SE
- Syngenta Group Co., Ltd.
- UPL Limited
- Corteva, Inc.
- FMC Corporation
- Nufarm Limited
- Albaugh LLC
- Zhejiang Jiangshan Agrochemical & Chemical Co., Ltd.
- Jiangsu Yangnong Chemical Group Co., Ltd. (Sinochem Holdings Corporation Ltd.)
- ADAMA Ltd.
- Bharat Rasayan Limited
- Jiangsu Good-Harvest Weien Agrochemical Co., Ltd.
- Anhui Huaxing Chemical Industry Co., Ltd.

Market Opportunities and Future Outlook
Opportunity areas are increasingly tied to supply-chain security, formulation differentiation, and agronomic system needs rather than simple volume expansion. In February 2026, a White House directive emphasized the strategic importance of maintaining adequate supplies of elemental phosphorus and glyphosate-based herbicides, which reinforces the value of upstream integration and resilient sourcing for glyphosate producers and formulators. In parallel, China tightened product standardization through the One Certificate, One Product, One Standard pesticide rule, effective 1 January 2026, creating room for compliant, well-documented offerings and for exporters and importers that can manage documentation, batch consistency, and multi-market labeling.
On the supply side, new large-scale additions and portfolio restructuring are changing competitive positioning and procurement choices. In May 2026, Guizhou Jiangshan CropScience announced a complex in Weng'an County, Guizhou, adding 100,000 tons per year of glyphosate isopropylamine salt 46% TK capacity, which is aimed at supporting scale-based pricing and availability for global buyers. In the United States, Bayer consolidated its glyphosate operations into Ruveon LLC in July 2026, pointing to a more specialized operating model for a commodity-exposed product line and sharpening counterparties for distributors and large farm-input channels that prioritize continuity of supply, consistent formulations, and streamlined logistics.
Recent Industry Developments in Glyphosate Herbicide Market
- July 2026: Bayer consolidated its US glyphosate business into a new dedicated entity, Ruveon LLC, based in St. Louis, Missouri. The centralization covers production, pricing, logistics, and go-to-market execution for glyphosate under a standalone structure, which is reshaping how distributors and large farm-input channels contract for supply and manage continuity risk.
- August 2025: BASF signed a trait licensing agreement with Corteva Agriscience and M.S. Technologies to develop and market a soybean trait stack for Brazil tolerant to 2,4-D choline, glyphosate, and glufosinate. The agreement supports stacked herbicide-tolerance systems that feed into spray programs and tank-mix strategies, affecting how glyphosate is positioned alongside alternative modes of action in major row-crop acreage.
- March 2024: EFSA and ECHA published a technical report addressing scientific arguments submitted by NGOs during the EU renewal process for glyphosate. The post-renewal scrutiny keeps stewardship, documentation, and country-level use restrictions in focus for registrants and formulators operating across the EU, influencing compliance costs and product portfolio decisions.


Glyphosate Herbicide Market Report Scope and Research Methodology
Market Definition and Coverage
For this study, the market covers the value of glyphosate-based herbicides sold as technical grade material and as formulated products, used to control weeds in agricultural and non-agricultural settings. The sizing is counted at the point the product leaves manufacturers or major formulators.
Scope exclusions: We exclude multi-active formulations where glyphosate is less than 50% of the formulation, since mixing rules can otherwise inflate totals through double counting.
Segments Covered in This Report
- By Crop Type
- Grains and Cereals
- Pulses and Oilseeds
- Fruits and Vegetables
- Commercial Crops
- Other Crops
- By Biotechnology Adoption
- GM Crops
- Non-GM Crops
- By Formulation
- Liquid
- Dry
- By Geography
- North America
- United States
- Canada
- Mexico
- Rest of North America
- South America
- Brazil
- Argentina
- Rest of South America
- Europe
- Germany
- France
- Italy
- Spain
- United Kingdom
- Russia
- Rest of Europe
- Asia-Pacific
- China
- India
- Japan
- Australia
- Rest of Asia-Pacific
- Middle East
- Saudi Arabia
- United Arab Emirates
- Turkey
- Rest of Middle East
- Africa
- South Africa
- Nigeria
- Rest of Africa
- North America
Data Sources, Market Sizing, and Validation
Desk Research
Desk work starts by building a fact base for acreage, cropping patterns, and weed-control practices that influence glyphosate use intensity. We use public sources such as FAOSTAT for crop and land-use statistics, USDA and other agriculture ministries for planted area and farm input trends, and the World Bank for macro indicators that reflect purchasing power shifts.
To keep pricing and the supply side grounded, we review customs and trade publications such as UN Comtrade, along with pesticide registration and residue rule updates from regulators like the US EPA and the European Commission. We also check company filings, annual reports, and investor presentations for volume and margin direction, and we refer to paid subscription databases for company financials, patents, and shipment or trade signals where available. The sources listed here are illustrative, and many other public documents and datasets are also reviewed for data collection, cross-checks, and clarification.
Primary Interviews and Surveys
Primary work is used to pressure-test desk assumptions and fill gaps around typical dose rates, switching behavior versus alternative herbicides, and how channel pricing moves through seasons. We speak with manufacturers and formulators, distributors, agronomists, large farm operators, and procurement teams across APAC, EMEA, and the Americas so the demand pool, pricing logic, and adoption signals align by geography.
Distribution of primary research fieldwork respondents
| Company type | Respondent position | Region |
|---|---|---|
| Top tier: 29% | CXOs: 15% | APAC: 43% |
| Mid tier: 53% | Functional/Unit leaders: 34% | EMEA: 34% |
| Smaller Players: 18% | Managers: 51% | Americas: 23% |
Market-Sizing & Forecasting
The core model uses top-down and bottom-up logic in a practical way. First, a demand pool is reconstructed by linking herbicide-treated area to average application intensity in major crop systems, which is then converted into active ingredient and formulated-equivalent demand using typical concentration and use rates. Next, that demand is priced using regional average selling price ranges aligned to channel structure and currency timing.
To keep totals realistic, we track a short set of variables that market participants consistently point to, such as planted area in glyphosate-tolerant crop systems, pre-plant and post-emergence treatment practices, weather-driven reapplication risk, generic supply availability, and regulatory restrictions that shift use between crop and non-crop settings. Results are corroborated with selective bottom-up checks, including sampled supplier volume disclosures, trade direction signals, and distributor channel checks. Where gaps are explainable but not well measured, we adjust the model inputs rather than forcing a single technical relationship.
Forecasting is run using scenario analysis built around expected acreage trends, pricing direction, and policy signals. Scenarios are narrowed after confirming assumptions with primary experts for the next few seasons. Where data is thin in smaller countries, we use proxies like crop area and input spend per hectare, and then validate the implied per-hectare usage so the model does not drift into unrealistic consumption.
Data Validation & Update Cycle
Before numbers are finalized, outputs are compared against independent signals such as crop acreage shifts, trade flow direction, and observed price movements so totals do not conflict with what the market is showing. Outliers are reviewed in a second pass, and if a jump cannot be explained by a clear driver like regulation changes or supply disruptions, we re-check assumptions and, when needed, re-contact sources to confirm the change.
A multi-step review is followed, where methods, inputs, and calculations are checked by another analyst before sign-off, and the logic is tested for unit consistency across regions. Reports are refreshed annually, and interim updates are made when material events occur, such as major policy actions, large capacity changes, or abnormal raw material moves. Before delivery, a final update pass is completed so clients receive the latest view available at the time of publication.
Mordor Intelligence's Glyphosate Herbicide Market Size Measured Against Other Published Estimates
Published market sizes for glyphosate often do not match each other because the scope and the counting point are not the same across studies. Differences usually come from whether values are counted at manufacturing level or closer to retail, whether multi-active blends are fully included, and how prices are converted and averaged across regions.
The biggest spread tends to show up when studies mix technical material with adjacent herbicide categories, or when they count blended formulations without checking active ingredient share, which can add the same liters twice across classes. Another common driver is the price curve, since some models apply a single global price trend, while others rebuild regional prices using channel feedback and trade signals, and base-year selection also matters when input costs are moving.
Benchmark comparison
| Source | Market Size | Gaps in Research Methodology |
|---|---|---|
| Mordor Intelligence | USD 11.48 B (2026) | |
| Global Consultancy A | USD 9.07 B (2024) | Uses an earlier base year and a broad "glyphosate" framing that may not separate manufacturer-level sell-out from later channel markups, and it does not clearly state a threshold rule for multi-active formulations. |
| Industry Publisher B | USD 8.98 B (2024) | Anchors estimates to a 2023 base and applies a smoother price and growth path through 2030, which can understate short-cycle price swings and regional mix shifts that affect realized selling prices. |
The table suggests that base year timing and blend handling drive much of the gap between published values. Excluding multi-active formulations where glyphosate is a minor component and counting value at the manufacturer or major formulator exit point tightens the model to repeatable inputs, and the same rule is applied here by Mordor Intelligence.


Key Questions Answered in the Report
How large is the glyphosate herbicide market in 2026?
The market generated USD 11.48 billion in 2026 and is forecast to reach USD 15.58 billion by 2031.
Which crop type generates the most demand for glyphosate products?
Grains and cereals led with a 44.0% revenue share in 2025, primarily due to the widespread adoption of glyphosate-tolerant soybeans and maize.
How are litigation risks influencing supplier strategies?
Branded manufacturers support state shield laws and may limit retail sales to manage exposure, potentially opening share for generics.
What role do carbon credits play in glyphosate demand?
No-till acreage eligible for carbon payments relies on glyphosate for weed control, reinforcing baseline use in North American and European programs.
Page last updated on:


 Your data is secure and never sold or shared.


