Glycerin Market Size and Share
Market Overview
| Study Period | 2021 - 2031 |
|---|---|
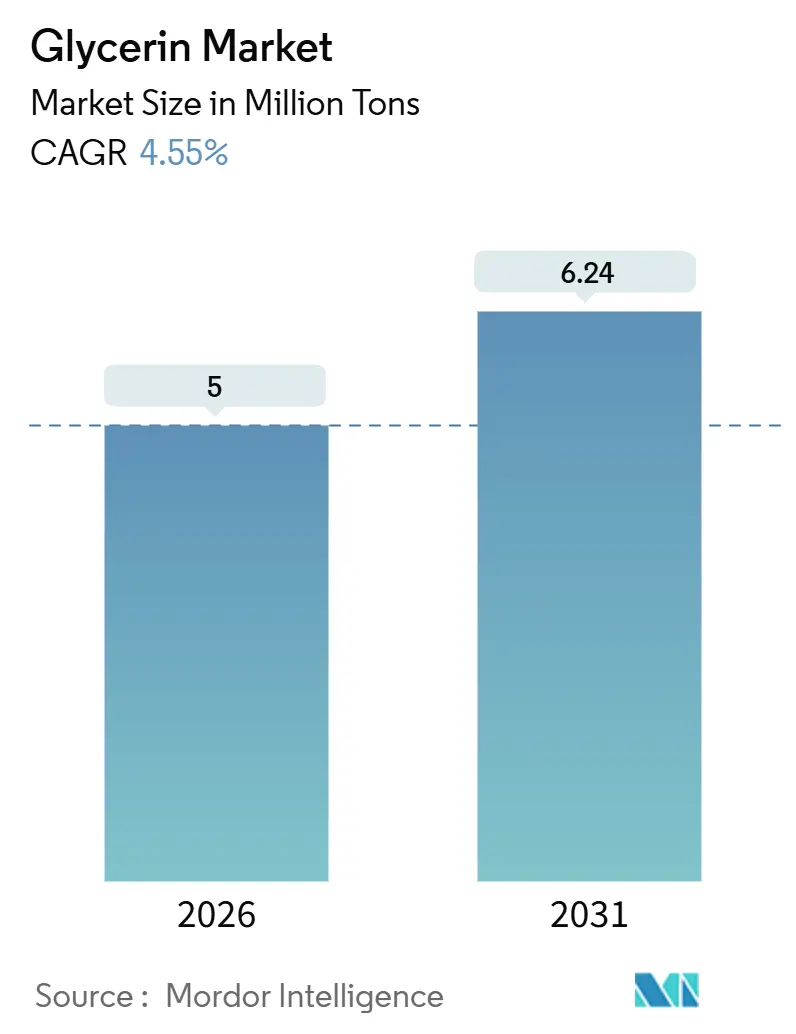
| Market Volume (2026) | 5 Million tons |
| Market Volume (2031) | 6.24 Million tons |
| Growth Rate (2026 - 2031) | 4.55% CAGR |
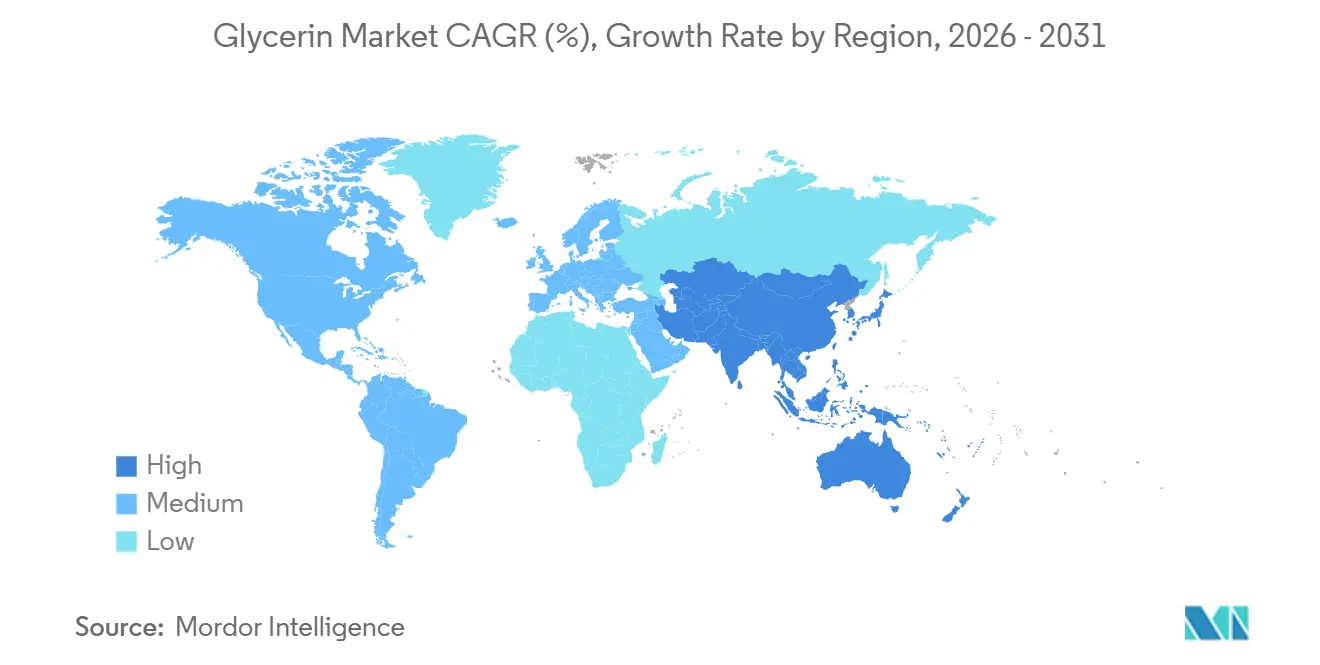
| Fastest Growing Market | Asia Pacific |
| Largest Market | Asia Pacific |
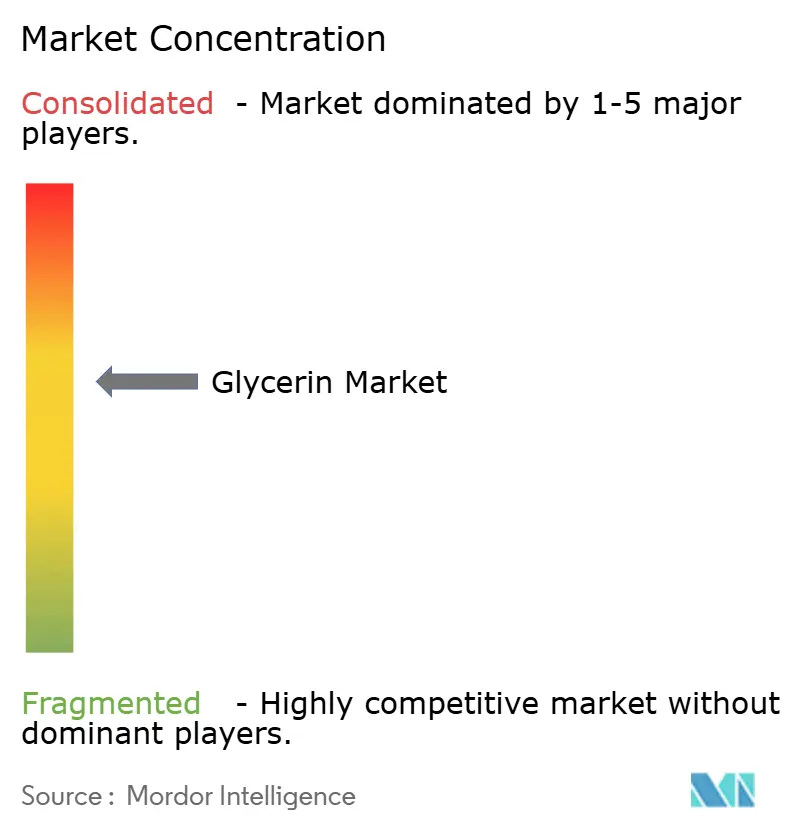
| Market Concentration | Medium |
Major Players *Disclaimer: Major Players sorted in no particular order Image © Mordor Intelligence. Reuse requires attribution under CC BY 4.0. | |
Glycerin Market Analysis by Mordor Intelligence
The Glycerin Market size is estimated at 5 million tons in 2026, and is expected to reach 6.24 million tons by 2031, at a CAGR of 4.55% during the forecast period (2026-2031). Structured biodiesel expansion keeps supply growing, yet the rapid build-out of hydrotreated vegetable oil (HVO) units that yield no co-product is tightening the long-term refined-grade outlook. India’s biodiesel output jumped 60% between 2024 and 2025, but utilization rose to only 59.8%, showing that feedstock access, rather than reactor capacity, sets the ceiling for incremental glycerin volumes. At the demand end, FDA guidance issued in May 2023 that mandates diethylene glycol and ethylene glycol testing for all drug products is pushing pharmaceutical buyers toward USP-grade material, reinforcing the price premium for high-purity grades. Asia-Pacific holds half of global consumption today and continues to compound above the global average as China’s oleochemical integration and Southeast Asia’s palm-biodiesel clusters internalize more crude glycerin into on-site refining systems.
Key Report Takeaways
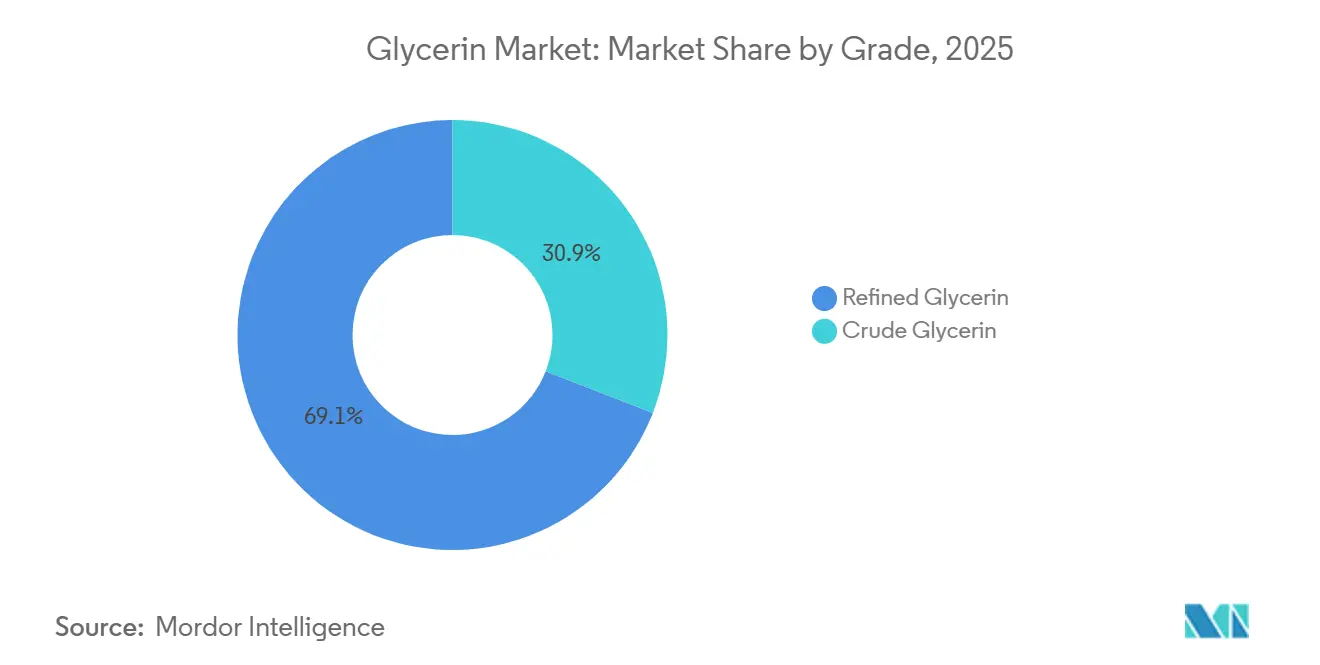
- By grade, refined glycerin led with 69.1% of the Glycerin market share in 2025; the grade is forecast to grow at a 5.02% CAGR through 2031.
- By source, biodiesel contributed 60.17% of the Glycerin market in 2025, while vegetable-oil-derived glycerin is projected to advance at a 6.21% CAGR to 2030.
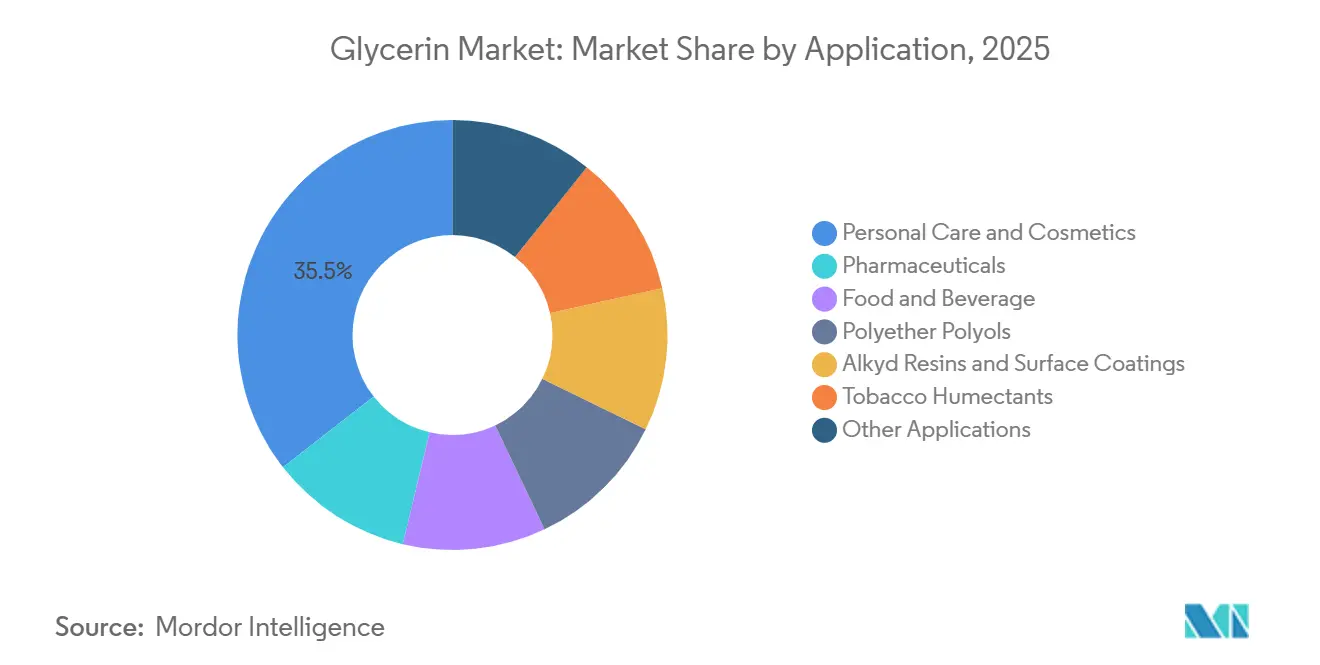
- By application, personal care and cosmetics held a 35.54% revenue share in 2024 and are expected to record the fastest 4.92% CAGR over the same period.
- By geography, Asia-Pacific captured 49.03% of the Glycerin market in 2024, and it is set to expand at a 5.09% CAGR to 2030.
Note: Market size and forecast figures in this report are generated using Mordor Intelligence’s proprietary estimation framework, updated with the latest available data and insights as of January 2026.
Global Glycerin Market Trends and Insights
Driver Impact Analysis
| Driver | (~) % Impact on CAGR Forecast | Geographic Relevance | Impact Timeline |
|---|---|---|---|
| Surging demand for USP-grade glycerin in pharmaceuticals | +0.8% | Global, with concentration in North America, Europe, India, China | Medium term (2-4 years) |
| Increasing use in personal care & cosmetics | +1.1% | Global, led by North America, Europe, Asia-Pacific urban centers | Short to medium term (≤ 4 years) |
| Rising adoption of vegetable-sourced glycerin in food industry | +0.6% | North America, Europe, Asia-Pacific (clean-label demand) | Medium term (2-4 years) |
| Emergence of solid-state glycerin electrolytes for next-gen batteries | +0.3% | Asia-Pacific (China, South Korea, Japan), North America | Long term (≥ 4 years) |
| Circular-economy projects converting crude glycerin to bio-ECH | +0.5% | Europe, North America, Brazil | Medium to long term (2-6 years) |
| Source: Mordor Intelligence | |||
Surging Demand for USP-grade Glycerin in Pharmaceutical Industry
FDA’s 2023 requirement to test every excipient batch for diethylene and ethylene glycols triggered a sharp pivot toward 99.5%-plus glycerin produced under GMP conditions[1]U.S. Food and Drug Administration, “Testing of Glycerin for Diethylene Glycol,” fda.gov. Indonesian capacity additions by Louis Dreyfus Company in 2025 and record output from Verbio in Germany illustrate the global scramble for compliant supply. Oral and topical formulations remain the core outlets, and India’s PLI scheme is prompting refiners near Hyderabad and Ahmedabad to backward-integrate so that domestic APIs can secure fully traceable excipients.
Increasing Use in the Personal Care and Cosmetics Industries
Consumer scrutiny of synthetic humectants and tighter sustainability norms are lifting vegetable-glycerin penetration in moisturizers, cleansers, and serums, with major brand launches in 2024-2025 citing natural origin on pack. Partnerships such as BASF–Acies Bio leverage renewable-methanol routes for upstream surfactants that often co-formulate with glycerin, entrenching its role in “clean beauty” claims. RSPO certification and EU deforestation rules reinforce preference for traceable feedstock, which Argent Energy’s Amsterdam refinery now provides at 50,000 t/y of 99.7% purity output.
Rising Adoption of Vegetable-Sourced Glycerin in Food Industry
Glycerin enjoys GRAS status and supplies moisture retention without affecting glycemic load, making it attractive in low-sugar bakery and confectionery lines. Vegetable origin carries vegan and halal credentials that widen its price premium over tallow variants, a spread that grew in 2024-2025 as ADM’s stake in Brazil’s Buckminster Química boosted bi-distilled availability. Tobacco-harm-reduction products and alcohol-free flavor extracts provide additional lift, stabilizing demand even as traditional cigarette volumes erode.
Emergence of Solid-State Glycerin Electrolytes for Next-Gen Batteries
Research into glycerol-based polymer electrolytes for lithium-ion and solid-state batteries is transitioning from academic laboratories to pilot-scale demonstrations, driven by the search for safer, non-flammable electrolyte systems that can operate across wider temperature ranges than conventional liquid electrolytes. Academic breakthroughs have demonstrated ionic conductivities approaching 10⁻³ S/cm at room temperature for glycerol–LiTFSI gels, and pilot programs are now run in China, South Korea, and the United States. While today's addressable volume is niche, wide-temperature tolerance and non-flammability could unlock small but lucrative shares of medical, wearable, and IoT battery niches once solid-state cell production scales later this decade.
Restraint Impact Analysis
| Restraint | (~) % Impact on CAGR Forecast | Geographic Relevance | Impact Timeline |
|---|---|---|---|
| Volatile crude-glycerin prices linked to biodiesel feedstocks | -0.7% | Global, acute in South America, Southeast Asia, Europe | Short to medium term (≤ 3 years) |
| Availability of substitutes (propylene glycol, sorbitol) | -0.5% | Global, particularly in industrial and food applications | Medium term (2-4 years) |
| Sustainability scrutiny on palm-oil supply chains | -0.4% | Southeast Asia, Europe (import-dependent markets) | Short to medium term (≤ 3 years) |
| Source: Mordor Intelligence | |||
Volatile Crude-Glycerin Prices Linked to Biodiesel Feedstocks
Crude-glycerin pricing exhibits high correlation with biodiesel production volumes and feedstock costs, creating margin compression for refiners and formulators who cannot pass through price swings to end customers. Brazil’s 2023 export revenue fell 52.9% even as shipments climbed, proving how oversupply from rising biodiesel blend mandates decouples volume from margin. In Argentina, idle capacity topping 70% amid shifting policy keeps supply erratic and spot prices whipsawing, forcing pharmaceutical buyers to hold more inventory and widening working-capital needs.
Availability of Substitutes (Propylene Glycol, Sorbitol)
Propylene glycol and sorbitol offer functional equivalence to glycerin in many industrial, food, and personal-care applications, and their pricing dynamics often favor substitution when glycerin premiums widen. Propylene glycol derived from petro or emerging bio-propylene chains offers functional parity in antifreeze, polyols, and certain foods; Gevo and LG Chem’s ETO pathway aims for commercial output before 2030. Sorbitol produced from glucose hydrogenation similarly hedges formulators against glycerin price spikes, particularly in sugar-free confectionery and oral-care lines.
Segment Analysis
By Grade: Pharmaceutical Purity Drives Refining Investment
Refined material captured 69.1% of the glycerin market share in 2025, and its portion of the glycerin market size is set to increase at a 5.02% CAGR because drug, personal-care, and food buyers require USP-grade traceability. The FDA impurity rule accelerated multi-stage distillation and ion-exchange projects worldwide, widening the crude-to-refined margin spread to USD 400-700/t in 2024-2025.
Integrated players such as Verbio and Louis Dreyfus demonstrate that biodiesel complexes can monetize the pharmaceutical premium in-house, while mid-tier technical grades (99.0-99.5%) from Argent Energy fill the gap for industrial users who do not need USP certification[2]Argent Energy, “Amsterdam Bio-based Glycerine Refinery Commissioned,” argentenergy.com. As more biodiesel plants add purification, crude-export flows thin out, but global refined supply remains tight, underpinning premium pricing in North America and Europe.
By Source: Biodiesel Dominance Masks Feedstock Diversification
Biodiesel still furnishes 60.17% of the total supply, yet vegetable-oil-split and fatty-alcohol routes are rising at a 6.21% CAGR, lowering salt and methanol contamination levels and cutting refining costs. Southeast Asian complexes operated by Wilmar, KLK OLEO, and Emery leverage palm splitting to deliver direct-food or pharma-grade streams.
HVO’s rapid scale-up erodes FAME’s share of renewable diesel and thus trims future crude-glycerin generation. Meanwhile, India’s 60% jump in biodiesel production during 2024-2025 underscores how used-cooking-oil and palm-stearin diversification can fill domestic supply gaps and reduce refined-glycerin imports.
By Application: Personal Care Outpaces Polyols as Clean Beauty Reshapes Demand
Personal-care lines held 35.54% of 2025 volume and are tracking a 4.92% CAGR. Clean-label formulas favor vegetable glycerin over petroleum humectants, and EU traceability rules amplify this shift. Polyether polyols remain a sizeable outlet but face substitution when glycerin rises above USD 800/t.
Pharmaceutical use, though smaller in tonnage, delivers the highest margins, while food applications benefit from low-sugar positioning and vegan credentials. Diversified outlets such as vaping liquids, heated-tobacco sticks, and emerging acrylonitrile pathways (Project Falcon) provide incremental upside that can absorb part of the biodiesel-linked surplus.
Note: Segment shares of all individual segments available upon report purchase
Geography Analysis
Asia-Pacific owns 49.03% of global demand and is forecast to expand at 5.09% annually through 2031. China exports most of its biodiesel to the EU yet retains associated crude glycerin for domestic oleochemical uses, while India’s push to a 5% biodiesel blend by 2030 could unleash significant incremental supply once used-cooking-oil collection infrastructure scales. Japan and South Korea import USP-grade volumes because local production is limited, directing Malaysian and Indonesian refiners to seek WHO-GMP certification to secure market access.
North America remains structurally short, so imports from Brazil and Southeast Asia persist despite volatile crude-price swings. Renewable diesel co-processing in Canada is tightening domestic supply further, underlining the value of local purification projects near the US Gulf Coast and Midwest biodiesel clusters.
Europe’s historic dominance is ebbing as diesel demand falls and policy pivots toward HVO, yet RED II’s double-counting of glycerin valorization encourages downstream conversion to bio-ECH and propylene glycol. Stringent deforestation rules squeeze feedstock from Indonesia and Malaysia, but waste-oil streams in the Netherlands and Germany maintain flow under ISCC certification. South America delivers large crude volumes, though Brazil’s margin collapse after B15 implementation and Argentina’s policy swings inject uncertainty. The Middle East is nascent but gaining traction via petrochemical diversification moves such as Sipchem-LyondellBasell, which could later influence regional glycerin balances.
Competitive Landscape
The Glycerin market is moderately concentrated. Competitive pressure intensifies in USP-grade and personal-care pools, where certifications and supply security trump price. In contrast, cost-sensitive industrial outlets see retreat when propylene glycol and sorbitol undercut glycerin, a dynamic likely to strengthen as Gevo–LG Chem bio-propylene matures. Multi-stage distillation and membrane tech are now baseline investments for any refinery that seeks access to pharmaceutical or food markets.
Glycerin Industry Leaders
BASF
Wilmar International Ltd.
Cargill, Incorporated
KLK OLEO
IOI Corporation Berhad
- *Disclaimer: Major Players sorted in no particular order
Recent Industry Developments
- May 2025: The Louis Dreyfus Company (LDC) inaugurated a new glycerin refining plant and an edible oil packaging line in Lampung, marking an expansion of its operations in Indonesia. The newly established glycerin production facility boasts an annual capacity of 55,000 metric tons, positioning LDC to cater to the surging global demand for high-purity, USP-grade glycerin.
- October 2024: At its Port of Amsterdam site, Argent Energy inaugurated Europe's largest facility for producing bio-based, technical-grade glycerine. The cutting-edge refinery transforms crude glycerine into a refined product boasting 99.7% purity. With a production capacity of 50,000 tons, this facility stands to benefit chemical producers across the continent.
Research Methodology Framework and Report Scope
Market Definitions and Key Coverage
Our study defines the global glycerin market as all fresh crude and refined glycerol streams obtained from biodiesel trans-esterification, fatty-acid splitting, or soap-making that are sold into personal-care, pharmaceutical, food, chemical intermediate, and technical channels.
Scope Exclusion: Figures do not cover downstream derivatives such as epichlorohydrin, propylene glycol, or 1,3-propanediol.
Segmentation Overview
- By Grade
- Crude Glycerin
- Refined Glycerin
- By Source
- Biodiesel
- Fatty Acids
- Fatty Alcohols
- Other Sources
- By Application
- Personal Care and Cosmetics
- Pharmaceuticals
- Food and Beverage
- Polyether Polyols
- Alkyd Resins and Surface Coatings
- Tobacco Humectants
- Other Applications
- By Geography
- Asia-Pacific
- China
- India
- Japan
- South Korea
- Rest of Asia-Pacific
- North America
- United States
- Canada
- Mexico
- Caribbeans
- Europe
- Germany
- United Kingdom
- Italy
- France
- Rest of Europe
- South America
- Brazil
- Argentina
- Rest of South America
- Middle-East and Africa
- Saudi Arabia
- United Arab Emirates
- Turkey
- South Africa
- Egypt
- Rest of Middle-East and Africa
- Asia-Pacific
Detailed Research Methodology and Data Validation
Primary Research
Analysts held structured calls with oleochemical procurement leads, cosmetic formulators, pharma excipient distributors, and biodiesel operators across Asia-Pacific, Europe, and the Americas. Their guidance on actual yield losses, contract price bands, and near-term policy impacts allowed us to sharpen model coefficients and close information gaps.
Desk Research
We began with hard statistics, UN Comtrade shipment ledgers, FAO and USDA oil-seed balances, IEA biodiesel output tables, and European Biodiesel Board yearbooks, which anchored 2025 supply volumes. Trade briefs from the American Cleaning Institute and the Personal Care Products Council helped translate supply into end-use pull, while company 10-Ks and plant filings accessed through D&B Hoovers and Dow Jones Factiva revealed capacity shifts and pricing cues. Patent insights sourced via Questel flagged emerging applications that could alter demand. The examples above are illustrative; many additional open and paid references supported data capture and cross-checks.
Market-Sizing & Forecasting
Supply was first rebuilt top-down from biodiesel and fatty-acid outputs, applying verified glycerin yield factors, then balanced with import-export data. A selective bottom-up roll-up of major producer capacities and sampled average selling prices checked the totals. Variables driving the forecast, such as biodiesel mandate levels, refined-grade price spreads, personal-care spending per capita, pharmaceutical gelatin capsule production, and palm-oil availability, feed a multivariate regression to 2030. Scenario analysis steps in wherever disclosure is thin.
Data Validation & Update Cycle
Every run passes anomaly screens, peer review, and sign-off. Models refresh annually, with interim updates triggered by material events such as policy shifts or plant outages. Before delivery, an analyst re-executes the workbook so clients receive the latest view.
Why Our Glycerin Baseline Commands Confidence
Published estimates often diverge because some firms mix grades, others toggle between volume and value, and many freeze exchange rates before commodity swings. Mordor Intelligence aligns scope, units, and refresh cadence, giving decision-makers a steadier reference point.
Key Gap Drivers include conversion of refined tonnage to revenue using list prices, omission of technical grade, folding of glycerin derivatives into totals, and static biodiesel growth assumptions.
Benchmark comparison
| Market Size | Anonymized source | Primary gap driver |
|---|---|---|
| 4.78 million tons (2025) | Mordor Intelligence | |
| USD 3.10 billion (2025) | Global Consultancy A | Mixes refined output and derivative revenues; constant 2023 prices |
| USD 3.21 billion (2024) | Regional Consultancy B | Excludes crude grade and smaller Asian producers |
| USD 3.13 billion (2025) | Trade Journal C | Treats biodiesel by-product as zero-value, inflating margins |
The comparison shows that, once scope and variable selection are harmonized, our volume-first model supported by transparent inputs delivers a dependable, repeatable baseline.
Key Questions Answered in the Report
What is the projected volume of the glycerin market by 2031?
The industry is expected to reach 6.24 million tons by 2031.
Which region leads demand growth to 2031?
Asia-Pacific, aided by Chinese oleochemicals and Indian biodiesel mandates, grows at a 5.09% CAGR.
Why is USP-grade demand rising?
FDA impurity testing rules from 2023 force drug formulators to secure 99.5%-plus traceable grades.
How does HVO expansion affect glycerin supply?
Hydrotreated vegetable oil produces no glycerin co-product, capping future crude-grade availability.
What circular applications are emerging for crude glycerin?
Commercial plants now convert it to epichlorohydrin, propylene glycol and acrylonitrile for SAF and plastics.


