
Market Overview
| Study Period | 2020 - 2031 |
|---|---|
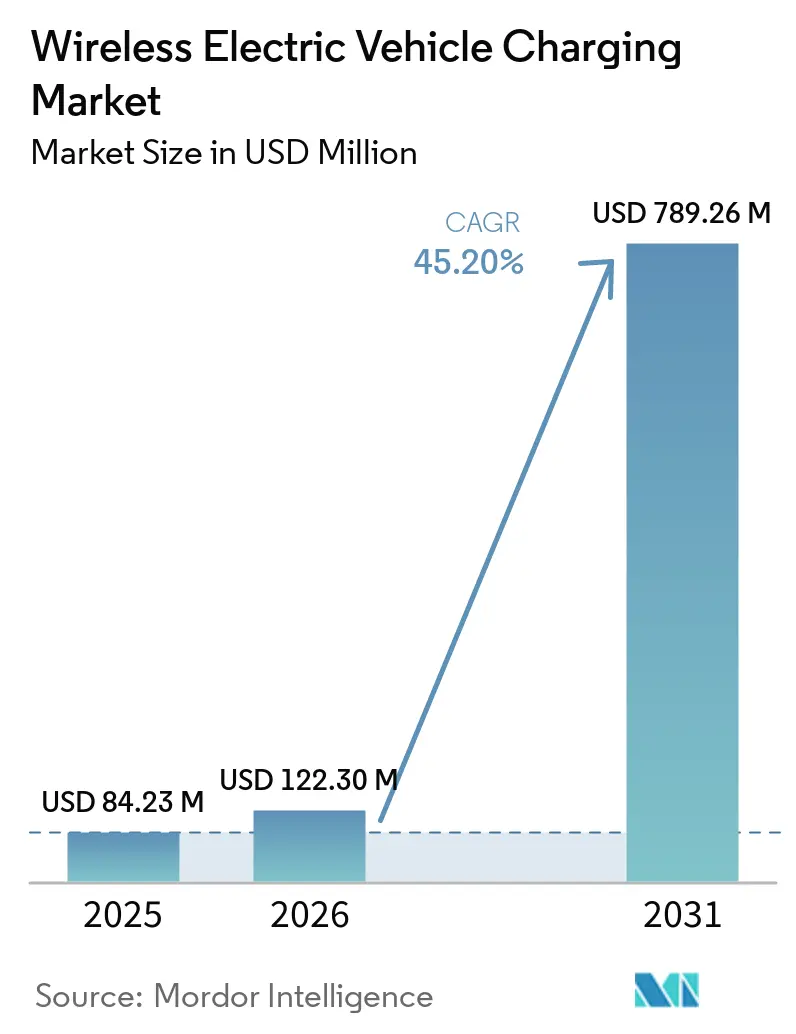
| Market Size (2026) | USD 122.30 Million |
| Market Size (2031) | USD 789.26 Million |
| Growth Rate (2026 - 2031) | 45.20 % |
| Fastest Growing Market | Asia Pacific |
| Largest Market | Europe |
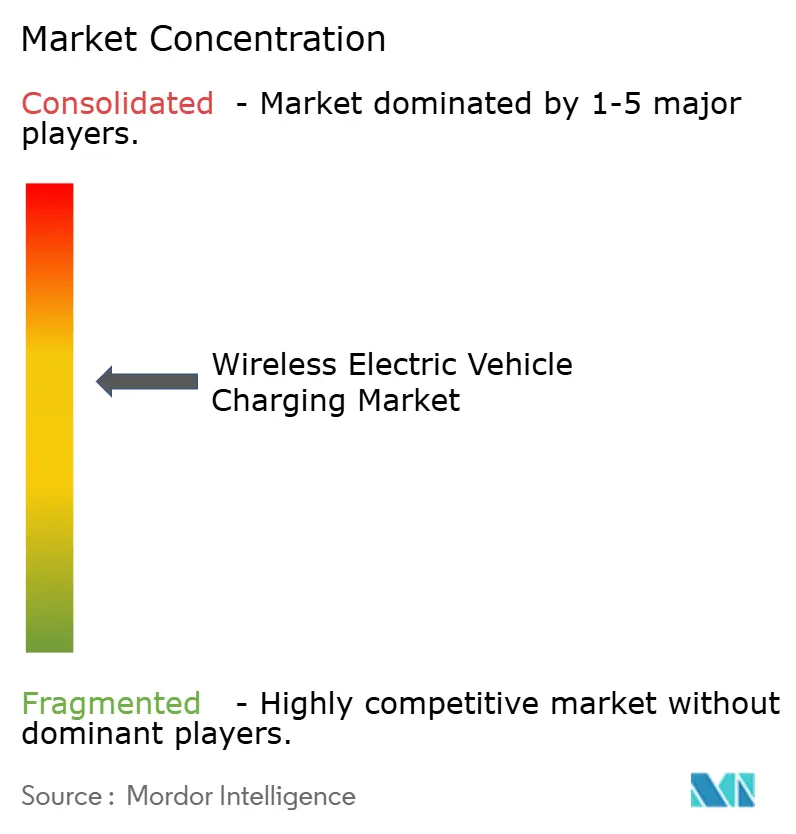
| Market Concentration | Medium |
Major Players
*Disclaimer: Major Players sorted in no particular order Image © Mordor Intelligence. Reuse requires attribution under CC BY 4.0. |
|
Wireless Electric Vehicle Charging Market Analysis by Mordor Intelligence
The wireless EV charging market size is expected to grow from USD 84.23 million in 2025 to USD 122.3 million in 2026 and is forecast to reach USD 789.26 million by 2031 at 45.2% CAGR over 2026-2031. Investment momentum reflects the shift from laboratory pilots to revenue-generating deployments, accelerated by Tesla’s purchase of Wiferion and the release of the SAE J2954 standard in August 2024. Automakers now view the technology as a differentiator because conventional plug-in infrastructure in major cities is approaching saturation. Europe commands the largest regional demand today, yet China’s rapid build-out of charging points positions Asia-Pacific as the fastest-growing arena. Across all regions, fleet operators underscore that wireless charging lowers labor costs and unlocks high utilization rates, reinforcing technology adoption despite higher capital expenditure.
Key Report Takeaways
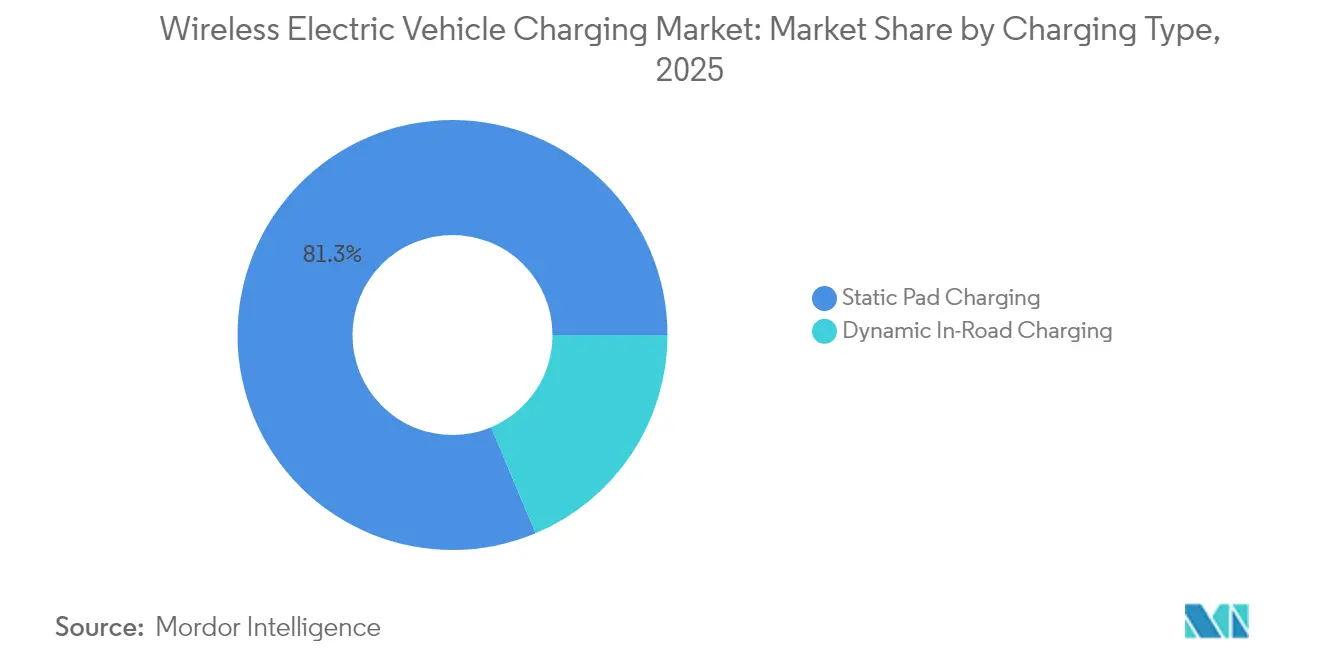
- By charging type, static pad systems led with 81.32% of wireless EV charging market share in 2025, while dynamic in-road solutions are forecast to climb at a 60.8% CAGR to 2031.
- By vehicle type, passenger cars held 64.55% of wireless EV charging market revenue share in 2025; buses and coaches are projected to expand at a 46.9% CAGR through 2031.
- By power output, up to 11 kW units accounted for 57.10% of the wireless EV charging market size in 2025, whereas installations above 150 kW are set to grow at a 67.6% CAGR over the same period.
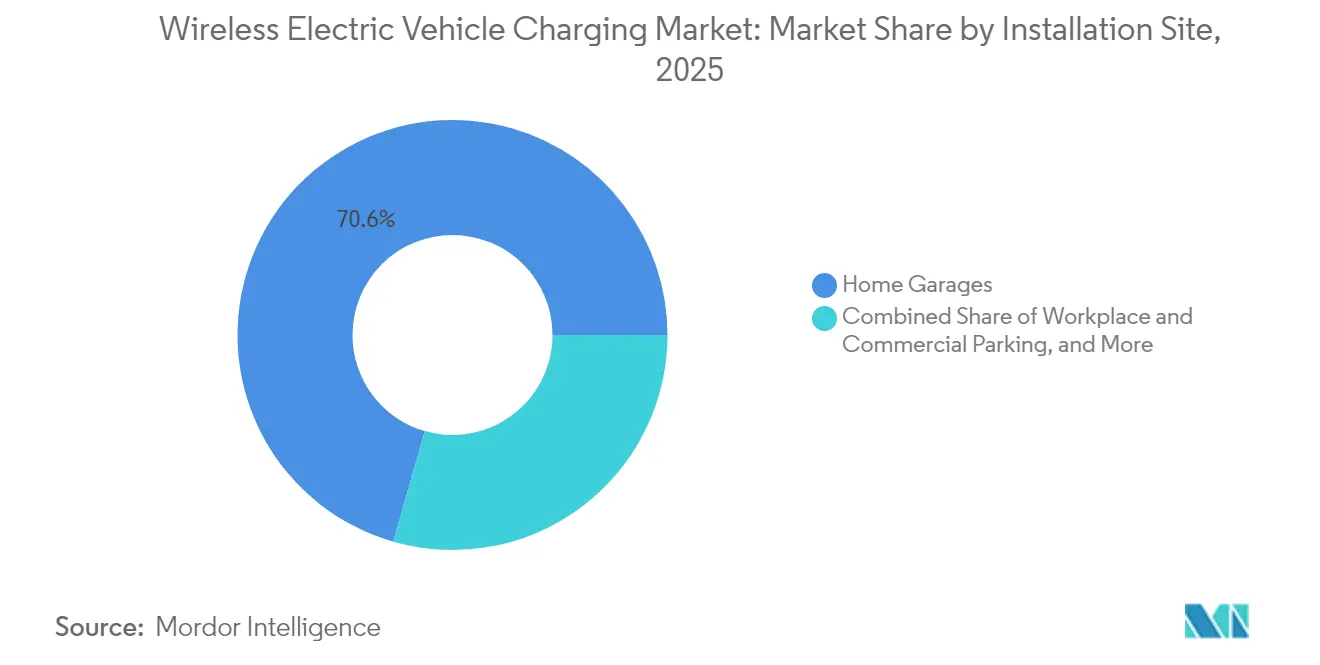
- By installation site, home garages represented 70.55% of the wireless EV charging market size in 2025, while highway lane projects exhibit the highest outlook at a 55.5% CAGR.
- By technology platform, inductive resonant coupling led with 73.65% of the wireless EV charging market share in 2025, while magnetic field alignment multi-coil systems are forecast to grow at a 63.8% CAGR through 2031.
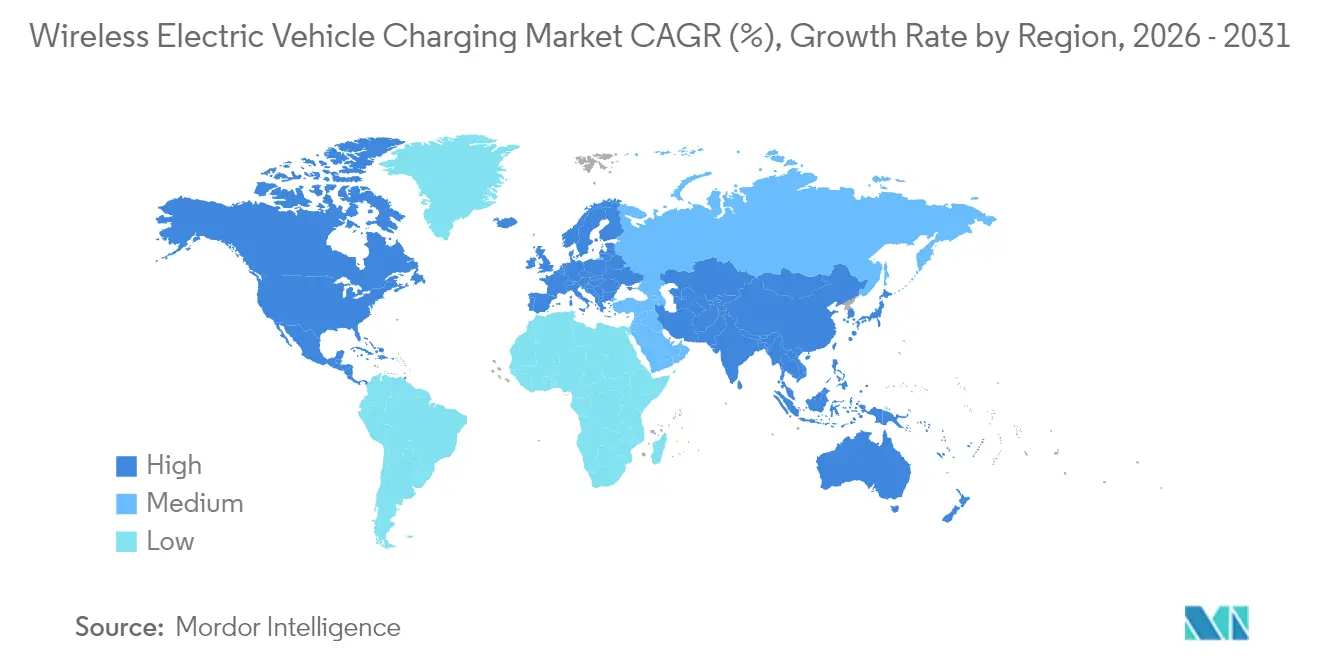
- By geography, Europe led with 37.85% of the wireless EV charging market share in 2025; Asia-Pacific is advancing at a 46.7% CAGR to 2031.
Note: Market size and forecast figures in this report are generated using Mordor Intelligence’s proprietary estimation framework, updated with the latest available data and insights as of 2026.
Market Trends and Insights
Drivers Impact Analysis of Wireless Electric Vehicle Charging Market*
| Driver | (~) % Point Impact on Market CAGR | Geographic Relevance | Impact Timeline |
|---|---|---|---|
| Rapid Acceleration In Global EV Sales | +12.5% | Global, with concentration in China, Europe, North America | Medium term (2-4 years) |
| Extended Government ZEV Mandates & Incentives | +8.2% | North America & EU, expanding to Asia-Pacific | Long term (≥ 4 years) |
| Early OEM Integration Into Premium Models | +7.8% | Global, led by German and Japanese automakers | Short term (≤ 2 years) |
| Fleet Electrification Demand For Autonomous Depot Charging | +6.9% | North America & EU, pilot projects in Asia-Pacific | Medium term (2-4 years) |
| Urban Anti-Cable Regulations & Curbside Inductive Pads | +4.1% | European cities, select North American municipalities | Long term (≥ 4 years) |
| Emerging SAE J2954-2 More Than 300 Kw Standard | +3.7% | Global, with early adoption in North America | Medium term (2-4 years) |
| Source: Mordor Intelligence | |||
Rapid Acceleration in Global EV Sales
Global electric vehicle sales momentum creates unprecedented demand for differentiated charging solutions, with wireless technology emerging as a premium feature that commands higher margins for automakers. Tesla's strategic acquisition of Wiferion in August 2024 signals the technology's maturation beyond experimental phases, while WiTricity's establishment of a Japanese subsidiary in May 2024 demonstrates coordinated global expansion efforts.[1]"WiTricity Corporation, a U.S. company that manufactures EV wireless power transfer products, establishes a Japanese subsidiary in Tokyo", Japan External Trade Organization, www.jetro.go.jp. The convergence of autonomous vehicle development with wireless charging capabilities creates a compelling value proposition, as demonstrated by Tesla's four new wireless charging patents filed in September 2024, specifically targeting robotaxi applications where human intervention becomes impractical Not a Tesla App. This technological alignment suggests wireless charging will transition from luxury convenience to operational necessity as mobility services scale.
Extended Government ZEV Mandates & Incentives
Zero-emission vehicle mandates increasingly recognize infrastructure limitations as barriers to adoption, prompting governments to incentivize wireless charging deployment through targeted subsidies and regulatory frameworks. Japan's consideration of subsidies for Tesla's charging stations within broader tariff negotiations illustrates how wireless technology becomes entangled with trade policy and industrial competitiveness. The SAE J3400 standard's establishment as a Recommended Practice in September 2024 provides regulatory clarity that enables government procurement programs to specify wireless charging requirements for public fleets.[2]"SAE Task Force Votes to Establish J3400 Standard as Recommended Practice", Joint Office of Energy and Transportation, driveelectric.gov. European cities' exploration of anti-cable regulations for curbside parking creates a regulatory pull that complements a technology push, particularly as urban planners seek to eliminate visual pollution from charging infrastructure while maintaining accessibility.
Early OEM Integration into Premium Models
Automotive manufacturers leverage wireless charging as a differentiation strategy in premium segments, where technology premiums align with consumer willingness to pay for convenience features. BMW's collaboration with WiTricity on the 530e iPerformance represents the first commercially available wireless charging-enabled hybrid, establishing a template for luxury market penetration. Continental's announcement of an 11 kW wireless inductive charging system for production by the decade's end, along with BMW and Mercedes-Benz's planning implementation, signals coordinated industry movement toward standardization. The technology's integration with human-machine interface apps that guide precise vehicle positioning demonstrates how wireless charging enables broader automation strategies, positioning it as an enabler for autonomous parking and charging sequences.
Fleet Electrification Demand for Autonomous Depot Charging
Commercial fleet operators increasingly view wireless charging as an operational imperative rather than a convenience feature, particularly for depot-based applications where labor costs for manual charging exceed technology premiums. The Antelope Valley Transit Authority's deployment of three 250 kW inductive chargers from WAVE demonstrates how high-power wireless systems enable continuous fleet operations without dedicated charging personnel. Electreon's Charging as a Service model eliminates upfront infrastructure investment while reducing battery capacity requirements by 50%, creating compelling total cost of ownership propositions for fleet operators. The technology's alignment with autonomous vehicle development creates synergistic value propositions, as demonstrated by Michigan's partnership with Electreon and Xos for wireless-charged delivery vehicles that operate without human intervention.
Restraints Impact Analysis of Wireless Electric Vehicle Charging Market*
| Restraint | (~) % Point Impact on Market CAGR | Geographic Relevance | Impact Timeline |
|---|---|---|---|
| High System & Installation Costs | -15.3% | Global, particularly acute in price-sensitive markets | Short term (≤ 2 years) |
| Interoperability & Standards Gaps | -8.7% | Global, with regional variations in adoption | Medium term (2-4 years) |
| Electro-Magnetic Safety Concerns In Dense Urban Zones | -6.2% | Urban areas globally, stricter in EU and Japan | Medium term (2-4 years) |
| Grid Harmonics Constraints On Megawatt In-Road Lanes | -3.4% | Highway corridors with high-power dynamic charging | Long term (≥ 4 years) |
| Source: Mordor Intelligence | |||
High System & Installation Costs
Wireless charging systems command 2-3 times the cost of equivalent wired solutions, creating significant barriers to mass market adoption despite improving technology economics. WiTricity's 11 kW wireless charger carries a USD 3,500 price point with installation costs ranging USD 3,500-4,000, compared to traditional Level 2 chargers priced below USD 1,000 installed. Infrastructure deployment costs prove even more challenging, with dynamic charging lanes requiring approximately EUR 167 million investment compared to EUR 105 million for equivalent fast-charging stations, though both scenarios yield similar net present values over extended timeframes.[3]"A Corridor-Based Approach to Estimating the Costs of Electric Vehicle Charging Infrastructure on Highways", MDPI, www.mdpi.com.The cost differential becomes particularly acute for public infrastructure deployment, where municipalities must justify premium pricing against limited utilization rates in early adoption phases.
Interoperability & Standards Gaps
Technical standardization challenges persist despite SAE J2954's establishment, as competing technology platforms pursue proprietary advantages that fragment market development. The distinction between inductive resonant coupling and magnetic field alignment multi-coil systems creates compatibility concerns for infrastructure investors uncertain about future technology convergence.Patent landscape complexity, exemplified by Mojo Mobility's USD 192 million victory against Samsung for wireless charging patent infringement, creates legal uncertainties that discourage infrastructure investment. Regional variations in electromagnetic field exposure limits and safety standards further complicate global deployment strategies, as manufacturers must navigate different regulatory frameworks across key markets while maintaining cost-effective production scales.
*Our forecasts treat driver/restraint impacts as directional, not additive. The impact forecasts reflect baseline growth, mix effects, and variable interactions.
Wireless Electric Vehicle Charging Market Segment Analysis
By Charging Type:
Static Dominance Enables Dynamic FutureStatic pad charging maintains commanding 81.32% of the wireless electric vehicle charging market share in 2025, reflecting current commercial viability and consumer acceptance patterns, while dynamic in-road charging accelerates at 60.8% CAGR through 2031 as infrastructure investments target long-term mobility transformation. Static systems benefit from established installation protocols and proven reliability, as demonstrated by WiTricity's deployment across multiple automotive partnerships and Electreon's successful bus terminal implementations in Israel and Germany. Dynamic charging applications remain concentrated in pilot projects and specialized corridors. Yet, Michigan's 14th Street deployment and Sweden's Smartroad Gotland demonstrate commercial viability for heavy-duty applications where continuous charging enables smaller battery configurations.
The technology maturation timeline favors static solutions for immediate market development, while dynamic systems require coordinated infrastructure investment beyond individual vehicle purchase decisions. Oak Ridge National Laboratory's achievement of 270 kW wireless power transfer represents a breakthrough that bridges static and dynamic applications, as the same polyphase electromagnetic coupling technology enables both stationary and mobile charging scenarios. Dynamic charging's growth trajectory depends on public-private partnerships that align infrastructure investment with fleet electrification schedules, creating network effects that justify premium technology costs through operational efficiency gains.


By Vehicle Type:
Commercial Fleets Drive Premium AdoptionPassenger cars command 64.55% of the wireless electric vehicle charging market share in 2025, yet buses and coaches emerge as the fastest-growing segment at 46.9% CAGR, reflecting commercial operators' willingness to pay technology premiums for operational advantages that reduce total cost of ownership. Light commercial vehicles and medium & heavy trucks represent emerging applications where wireless charging enables autonomous depot operations without human intervention for charging procedures. Plug-in hybrid cars maintain steady demand as transitional technology, though their growth prospects diminish as battery electric vehicles achieve cost parity and charging infrastructure expands.
Fleet applications demonstrate superior economics compared to individual consumer adoption, as centralized depot charging enables standardized installation and maintenance procedures while maximizing utilization rates. The Port of Los Angeles's implementation of 500 kW wireless charging systems for heavy-duty trucks illustrates how commercial applications justify premium pricing through operational efficiency gains and emissions compliance requirements. Buses and coaches particularly benefit from wireless technology's alignment with fixed route operations, where predictable charging schedules enable optimized battery sizing and reduced infrastructure complexity compared to opportunity charging with manual connections.
By Power Output:
Megawatt Migration AcceleratesUp to 11 kW systems dominate current installations with 57.10% of the wireless electric vehicle charging market share in 2025, reflecting residential and light commercial applications where power requirements align with existing electrical infrastructure capabilities, while above 150 kW installations surge at 67.6% CAGR as commercial applications demand rapid charging capabilities. The 11-50 kW segment serves as a bridge technology for workplace and retail applications, while 51-150 kW systems target fleet depot installations where moderate power levels balance charging speed with infrastructure costs. Above 150 kW applications represent the technology frontier, where megawatt-class systems enable dynamic charging for heavy-duty vehicles and high-utilization commercial fleets.
Power output evolution reflects broader industry trends toward extremely fast charging, as demonstrated by ChargePoint's introduction of megawatt charging systems capable of delivering up to 3 megawatts for commercial applications. Wireless technology's power scaling challenges require advanced thermal management and electromagnetic field control, yet breakthrough developments like Oak Ridge National Laboratory's 270 kW demonstration prove technical feasibility for high-power applications. The power output distribution suggests market bifurcation between residential convenience applications and commercial efficiency solutions, with limited overlap in technology requirements and pricing strategies.
By Installation Site:
Home Foundation Supports Highway FutureHome garages capture 70.55% of the wireless electric vehicle charging market share in 2025, establishing wireless charging as a premium residential amenity that commands higher property values and appeals to affluent early adopters, while highway lanes represent the fastest-growing application at 55.5% CAGR as public infrastructure investment targets long-distance travel enablement. Workplace and commercial parking installations serve as intermediate adoption vehicles, where employers provide wireless charging as employee benefits while testing technology reliability and user acceptance patterns. Public parking lots and retail locations offer revenue generation opportunities for property owners, though utilization rates remain uncertain in early deployment phases.
Fleet and depot facilities demonstrate the most compelling economics for wireless charging adoption, as centralized installation enables standardized maintenance procedures while maximizing technology utilization through continuous operation schedules. Highway lane applications require coordinated public investment and standardized technology platforms, yet successful pilot projects in Sweden and planned deployments in Michigan demonstrate technical feasibility for dynamic charging infrastructure. The installation site distribution reflects technology adoption patterns that begin with controlled environments and expand toward public infrastructure as reliability and standardization mature.
By Technology Platform:
Inductive Leadership Faces Multi-Coil ChallengeInductive resonant coupling will maintain 73.65% of the wireless electric vehicle charging market size in 2025, benefiting from established patent portfolios and proven commercial deployments. Magnetic field alignment multi-coil systems will accelerate at 63.8% CAGR as next-generation technology platforms pursue higher efficiency and power density advantages. Capacitive power transfer remains a niche application with specialized use cases, though its growth potential depends on breakthrough developments in energy transfer efficiency and safety protocols. The technology platform competition reflects fundamental physics trade-offs between power transfer efficiency, electromagnetic field containment, and system complexity.
WiTricity's acquisition of Qualcomm Halo's patent portfolio, encompassing over 1,500 wireless charging patents, demonstrates the strategic importance of intellectual property in technology platform competition. Magnetic field alignment systems offer theoretical advantages in power density and misalignment tolerance, yet require more complex control systems and higher manufacturing costs, increasing the role of the wireless charging integrated circuit in managing power transfer and system efficiency. As demonstrated by Oak Ridge National Laboratory's polyphase electromagnetic coupling breakthrough, the platform evolution suggests eventual convergence toward hybrid approaches that combine inductive coupling's reliability with multi-coil systems' performance advantages.
Geography Analysis
Nordic Europe Wireless Electric Vehicle Charging Market
Europe controlled 37.85% of the wireless electric vehicle charging market in 2025, anchored by climate regulations and early demonstration corridors such as Sweden’s e-motorway and Germany’s eCharge BASt. Norway added the world’s first inductive urban road in August 2024, showcasing Nordic leadership in blending renewable energy with wireless charging. Germany’s premium carmakers further lift regional usage by bundling charging pads within luxury trims, reinforcing consumer familiarity.
APAC Wireless Electric Vehicle Charging Market
Asia-Pacific accelerates at a 46.7% CAGR through 2031, propelled by China’s addition of 4.222 million charging points in 2024 alone. Beijing’s urban-renewal plans embed inductive bays within new apartment complexes, while provincial grants fund dynamic truck lanes on export corridors. Japan’s formation of the EV Wireless Power Transfer Council in April 2025 and WiTricity’s Tokyo branch underscore coordination among utilities, parts suppliers, and policymakers to seed national networks.
North America Wireless Electric Vehicle Charging Market
North America exhibits concentrated growth pockets. Michigan’s induction lane on 14th Street and California’s USD 20 million UCLA road project validate technical feasibility, but state-by-state rules on electromagnetic exposure mean patchwork permitting processes. The Joint Office’s support for SAE J3400 seeks to unify coupler specifications and integrate wireless billing data into federal funding criteria. Mexico and Canada remain emergent spaces; cross-border freight operators advocate for corridor interoperability to safeguard investment in trucks equipped with underbody receivers. Together, these regional narratives suggest the wireless EV charging market will evolve as a mosaic of national pilots scaling into continental networks. Cost declines and standard harmonization are expected to reduce adoption gaps by the decade’s end.

Regulatory Landscape
Standards are converging toward clearer interoperability and safety requirements for wireless power transfer (WPT). SAE J2954 (revised August 2024) provides alignment and interoperability guidance for light-duty plug-in electric vehicles, while ISO 19363:2020 covers on-board safety and interoperability for passenger and light-duty vehicle magnetic field WPT. In parallel, the IEC 61980 series and newer IEC PAS documents (PAS 61980-5:2024 and PAS 61980-6:2025) extend the framework to off-board supply requirements, including in-motion/dynamic use cases, which supports OEM and infrastructure specifications across regions.
Policy is also tightening expectations for public deployment and procurement. In the European Union, Commission Delegated Regulation (EU) 2025/656 (April 2025) amends Regulation (EU) 2023/1804 to add technical specifications for inductive static wireless recharging for light-duty EVs, with application effective from January 8, 2026, creating clearer compliance pathways under AFIR. In the United States, H.R. 1892 proposes a Wireless Electric Vehicle Charging Grant Program (authorized at USD 250 million) for infrastructure projects, while the U.S. Department of Transportation published a February 2026 Federal Register notice proposing modifications to the waiver of Buy America requirements for EV charging infrastructure that includes considerations relevant to wireless charging components.
Competitive Landscape
Competition is moderate yet intensifying. WiTricity deploys a patent-heavy licensing model, having absorbed Qualcomm Halo’s 1,500-plus patents, and recently licensed Yura Corporation to penetrate Korean supply chains. Electreon promotes infrastructure-as-a-service, earning recurring revenue by operating inductive roads in Israel, Sweden, and the United States. Tesla occupies a vertically integrated niche, folding Wiferion’s hardware into its broader robotaxi roadmap and owning vehicle, software, and pad IP.
Tier-one suppliers such as Continental, Bosch, and MAHLE leverage existing OEM relationships to package inductive modules alongside conventional power-electronics suites. Siemens’ equity investment in WiTricity and ABB’s partnership announcements point to a systemic shift: major electrical firms prepare portfolios that cover both wired and wireless formats to safeguard their share as fleet electrification accelerates.
Technological breakthroughs continue to reshape competitive dynamics. Oak Ridge’s 270 kW prototype recorded power densities up to ten times current commercial pads, pressuring private firms to accelerate R&D timelines. Patent disputes exemplified by Mojo Mobility’s USD 192 million win highlight the strategic value of defensible IP. Consequently, many late entrants adopt cross-licensing to avoid litigation. Early-mover alliances forged in 2024–2025 are likely to harden into durable ecosystem clusters that set de facto standards for coil geometry, communication protocols, and safety certification.
Wireless Electric Vehicle Charging Industry Leaders
-
WiTricity Corporation
-
HEVO Inc.
-
Plugless Power Inc.
-
InductEV Inc.
-
Electreon Wireless Ltd.
- *Disclaimer: Major Players sorted in no particular order
Wireless Electric Vehicle Charging Market Companies Covered in this Report
- WiTricity Corporation
- InductEV Inc.
- Electreon Wireless Ltd.
- HEVO Inc.
- Plugless Power Inc. (Evatran Group)
- Continental AG
- Robert Bosch GmbH
- Toyota Motor Corporation
- Toshiba Corporation
- Qualcomm Technologies (Halo)
- Siemens AG
- ABB Ltd.
- Wireless Advanced Vehicle Electrification, LLC. (WAVE Charging)
Read Analysis of Wireless Electric Vehicle Charging Companies

Market Opportunities and Future Outlook
Standardization and public programs are widening the addressable deployment base beyond pilots into repeatable installations that can be procured and scaled. The EU codification of inductive static wireless recharging specifications under AFIR through Delegated Regulation (EU) 2025/656 (effective January 8, 2026) supports interoperable public and fleet installations across member states. It also complements the SAE J2954 guidance for light-duty systems and the SAE J2954/2 framework for heavy-duty WPT, which together outline a route toward common vehicle-receiver and ground-assembly requirements. This opens room for OEM-aligned aftermarket kits, multi-OEM infrastructure at depots and public parking sites, and supplier offerings that package pads, power electronics, alignment, and communication into certifiable solutions.
Fleet and logistics settings continue to offer the most utilization-led opportunity because they concentrate vehicles, standardize dwell time, and capture labor savings from automated charging. Recent transactions and deployments reinforce this shift: Electreon completed the acquisition of InductEV in March 2026, combining stationary and dynamic wireless portfolios under one provider, and WAVE Charging with Ports America deployed a high-power wireless charging system at the Port of Los Angeles (July 2026), highlighting port drayage and yard operations as a scalable use case. Dynamic wireless road pilots in France (A10), Germany (A6, E|MPOWER), and U.S. state initiatives keep roadway electrification on the engineering agenda, but near-term whitespace appears concentrated on controlled sites like transit terminals, ports, and distribution depots where civil works can be planned and utilization is easier to measure.
Recent Industry Developments in Wireless Electric Vehicle Charging Market
- May 2026: HEVO Inc. and Fleet Tracking Technologies Co., Ltd. signed an MOU to deploy wireless charging and fleet electrification solutions across Saudi Arabia and the Middle East. The partnership anchors market entry around fleet depots and managed operations, aligning wireless charging with regional electrification programs that favor scalable, repeatable site deployments.
- March 2026: Electreon Wireless Ltd. completed the acquisition of InductEV Inc., combining InductEVs stationary high-power wireless charging footprint with Electreons dynamic wireless road capabilities. The deal consolidates technology and delivery capacity under one supplier, supporting broader bids that span depot, transit, and roadway applications.
- November 2024: Electreon collaborated with UCLA on a USD 20 million wireless charging roadway project in California to advance the states first wireless charging road. The project formalized a large, urban U.S. testbed that can influence procurement specifications and accelerate validation of in-road wireless charging in a major EV market.


Wireless Electric Vehicle Charging Market Report Scope and Research Methodology
Market Definition and Coverage
For this methodology, the market covers revenue generated from wireless charging systems used to transfer power to electric vehicles without a physical connector. It includes stationary pad based charging and dynamic in-road charging, counted across the full ecosystem needed to deliver charging at the vehicle and site level.
Scope exclusions: Excludes wired EV charging equipment, and it also excludes wireless charging used only for small consumer devices that are not EVs.
Segments Covered in This Report
-
By Charging Type
- Static Pad Charging
- Dynamic In-Road Charging
-
By Vehicle Type
- Passenger Car
- Light Commercial Vehicles
- Medium & Heavy Trucks
- Buses & Coaches
-
By Power Output
- Up to 11 kW
- 11–50 kW
- 51–150 kW
- Above 150 kW
-
By Installation Site
- Home Garages
- Workplace & Commercial Parking
- Public Parking Lots & Retail
- Fleet & Depot Facilities
- Highway Lanes
-
By Technology Platform
- Inductive Resonant Coupling
- Magnetic Field Alignment Multi-coil
- Capacitive Power Transfer
-
By Geography
-
North America
- United States
- Canada
- Rest of North America
-
South America
- Brazil
- Argentina
- Rest of South America
-
Europe
- Germany
- United Kingdom
- France
- Italy
- Spain
- Russia
- Rest of Europe
-
Asia-Pacific
- China
- Japan
- South Korea
- India
- Australia
- Rest of Asia-Pacific
-
Middle East and Africa
- Saudi Arabia
- United Arab Emirates
- Turkey
- South Africa
- Nigeria
- Egypt
- Rest of Middle East and Africa
-
North America
Data Sources, Market Sizing, and Validation
Desk Research
Desk work starts by mapping how EV wireless charging is regulated, specified, and reported so the inputs used in the model are comparable across regions. We typically refer to public materials such as SAE documentation related to J2954 alignment and power classes, International Energy Agency EV stock and charging infrastructure statistics, US Department of Energy alternative fuels and charging references, European Commission transport and energy publications, and UN Comtrade trade codes as supporting context.
After the baseline is set, we use company annual reports, investor presentations, product specification sheets, tender notices, and credible press releases to understand installed base movement, pilot-to-deployment conversion, and pricing direction. Patent databases are also reviewed to see where commercialization is moving, and an import and export shipment-level database is selectively used to sanity check cross-border equipment flows when product descriptions allow. The desk sources listed here are illustrative, and many other public references are used for data collection, validation, and clarification.
Primary Interviews and Surveys
Primary work is used to pressure-test the desk assumptions that most often move the final value, especially adoption timing, average system pricing, and the mix between stationary and dynamic deployments. We speak with a balanced set of stakeholders across hardware, integration, and end users, and coverage is kept global so regional deployment patterns and policy differences are reflected in our final view.
Distribution of primary research fieldwork respondents
| Company type | Respondent position | Region |
|---|---|---|
| Top tier: 27% | CXOs: 13% | APAC: 47% |
| Mid tier: 59% | Functional/Unit leaders: 29% | EMEA: 30% |
| Smaller Players: 14% | Managers: 58% | Americas: 23% |
Market-Sizing & Forecasting
Sizing is built using a top-down approach where EV parc growth and charging infrastructure build-outs are translated into a realistic addressable pool for wireless charging, and then converted using adoption rates by site type. Once that demand pool is set, the value is calculated through average system pricing that is adjusted for power output class, installation complexity, and the split between static pads and dynamic road embedded solutions.
To keep the model grounded, we rely on a small set of practical inputs such as EV sales and stock by region, share of charging that is opportunity based (fleet and public dwell locations), power output mix (which influences bill of materials and pricing), average number of equipped sites per deployment, and observed project timelines from pilots to scaled rollouts. Bottom-up checks are then run on selected pockets using sampled quotes, public tenders, and integrator channel checks, and gaps are handled by applying conservative penetration assumptions where pricing or volume signals are thin.
For forecasting, scenario analysis is used because the market is sensitive to standards readiness, infrastructure funding, and OEM program timing. The scenarios are anchored on expert consensus from interviews, and then translated into year-by-year adoption curves so the CAGR outcome is explainable and repeatable.
Data Validation & Update Cycle
Outputs are cross-checked against independent signals such as EV charging point additions, public procurement activity, and known program announcements, and then reviewed for sudden jumps that do not match real deployment constraints. Where a variance looks material, we re-check the conversion assumptions, pricing steps, and regional weightings, and we may re-contact sources to confirm what changed and when.
Before sign-off, the model and key assumptions go through multiple analyst reviews so arithmetic consistency and logic alignment are enforced. Reports are refreshed annually, and interim updates are made when major standards, policy moves, or large-scale deployments materially change the demand outlook. Prior to delivery, a final refresh pass is completed so the numbers reflect the latest available inputs.
Mordor Intelligence's Global Wireless Charging Market Market Size Versus Other Published Estimates
Published market numbers can look far apart because the underlying market is not always the same, even when the title sounds similar. Differences usually come from whether the scope is EV-only or includes phones and wearables, which years are treated as the base, and how fast adoption is assumed to move from pilots into scaled deployments.
Some sources bundle consumer device charging pads and receiver modules into a single total and then apply broad growth rates. Mordor Intelligence counts only wireless charging systems used for electric vehicles, including static and dynamic solutions, and the totals are tied back to EV stock, deployment pipelines, and power-class pricing logic.
Benchmark comparison
| Source | Market Size | Gaps in Research Methodology |
|---|---|---|
| Mordor Intelligence | USD 0.12 B (2026) | |
| Global Consultancy A | USD 5.35 B (2024) | Uses a broader wireless charger scope that includes consumer electronics and accessory chargers, which inflates totals versus an EV-only demand pool and typically anchors pricing to high-volume device categories. |
| Industry Publisher B | USD 9.96 B (2024) | Combines multiple end uses (consumer electronics, automotive in-cabin, healthcare, and industrial) and applies revenue shares by technology type, so EV infrastructure wireless charging is not isolated as its own deployment-led market. |
The spread mainly comes from scope and from how adoption is converted into revenue. When the model is anchored on EV deployment reality, with clear pricing steps by power output and installation site, the resulting market size stays traceable to inputs that can be checked and updated over time.


Key Questions Answered in the Report
What is the current wireless EV charging market size and projected growth?
The wireless EV charging market size is USD 122.3 million in 2026 and is forecast to rise to USD 789.26 million by 2031, representing a 45.2% CAGR.
Which charging type leads the market today?
Static pad systems lead with 81.32% market share, reflecting simpler installation and proven reliability.
Why do fleet operators favor wireless charging?
Eliminating manual plug-in labor and enabling round-the-clock operation reduces total operating costs and aligns with autonomous vehicle strategies.
What are the main obstacles to wider adoption?
High installation costs and interoperability concerns due to competing technology platforms and evolving standards remain primary restraints.
Page last updated on:


 Your data is secure and never sold or shared.


