Market Overview
| Study Period | 2021 - 2031 |
|---|---|
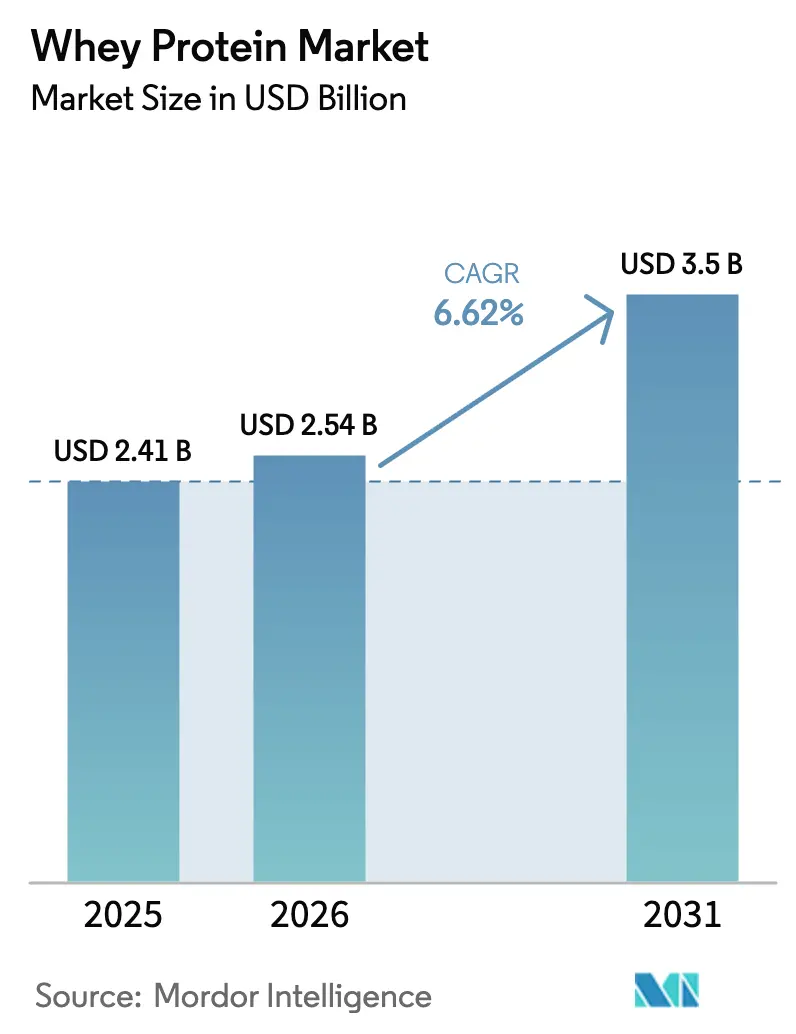
| Market Size (2026) | USD 2.54 Billion |
| Market Size (2031) | USD 3.5 Billion |
| Growth Rate (2026 - 2031) | 6.62% CAGR |
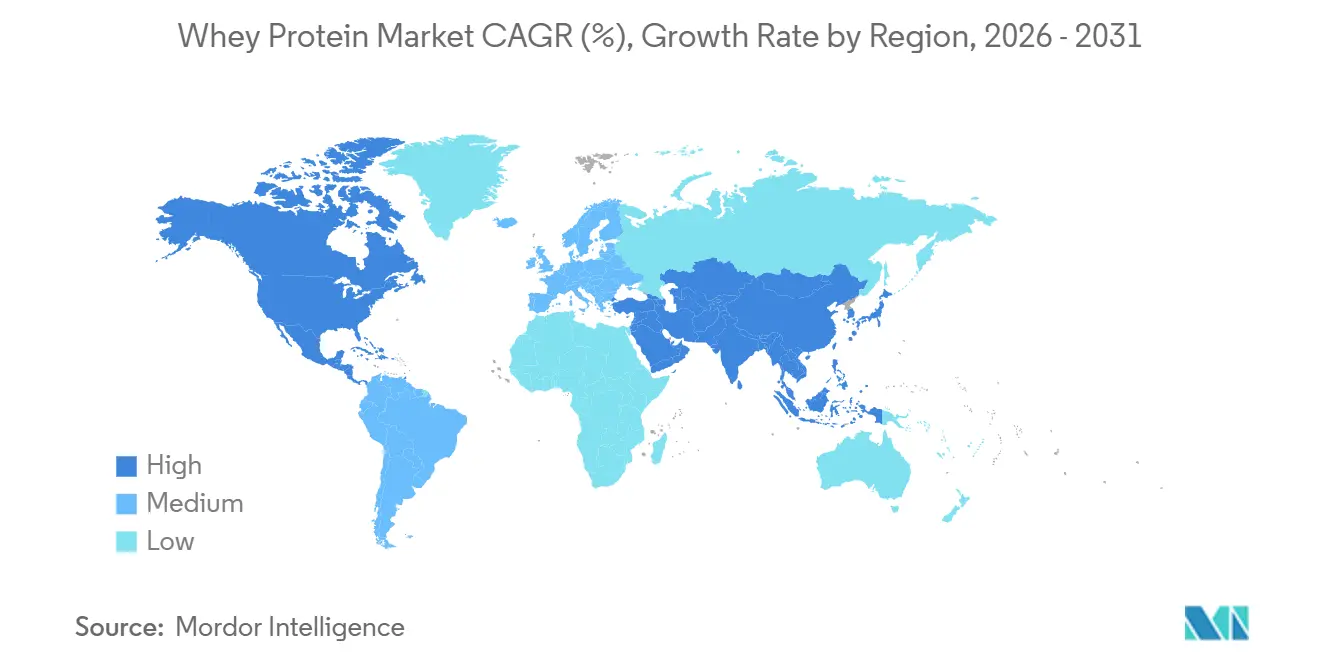
| Fastest Growing Market | Asia Pacific |
| Largest Market | North America |
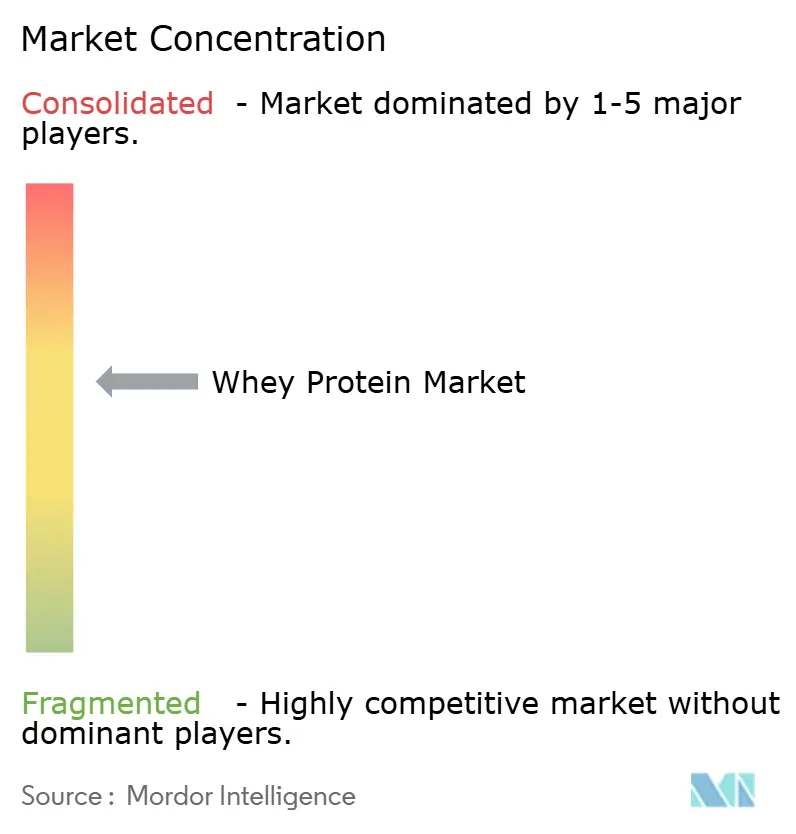
| Market Concentration | Medium |
Major Players*Disclaimer: Major Players sorted in no particular order Image © Mordor Intelligence. Reuse requires attribution under CC BY 4.0. | |
Whey Protein Market Analysis by Mordor Intelligence
The whey protein market size is expected to grow from USD 2.41 billion in 2025 to USD 2.54 billion in 2026 and is forecast to reach USD 3.50 billion by 2031 at a 6.62% CAGR over 2026-2031. This growth is largely attributed to shifts in value-mix rather than sheer tonnage. Processors are increasingly adopting membrane-separation lines, channeling liquid whey into higher-margin isolates and hydrolysates. These premium products are in high demand by brands in sports nutrition, infant formula, and clinical nutrition. Thanks to a record cheese surplus in the U.S., monthly whey output rose from 93.6 million lbs in January 2024 to 97.8 million lbs by December 2024[1]Source: USDA National Agricultural Statistics Service, “Dairy Products 2024 Summary,” usda.gov. This surplus not only keeps input costs competitive but also allows manufacturers to redirect streams towards these premium products without raising selling prices, as highlighted by the U.S. Department of Agriculture. Trends like clean-label preferences, the introduction of clear-whey beverages, and direct-to-consumer brands showcasing third-party test results bolster a premium narrative. This narrative is broadening the appeal of whey protein from just bodybuilders to a wider audience of mainstream wellness consumers. As competitive intensity heightens, industry giants like Fonterra, Glanbia, and Arla Foods are establishing billion-dollar protein hubs. Meanwhile, regional specialists and plant-protein contenders are emphasizing sustainability. This has turned process innovation, traceability, and flavor masking into pivotal battlegrounds within the whey protein market.
Key Report Takeaways
- By product type, whey protein concentrate led with 58.96% revenue in 2025; whey protein isolates are projected to expand at a 4.80% CAGR through 2031.
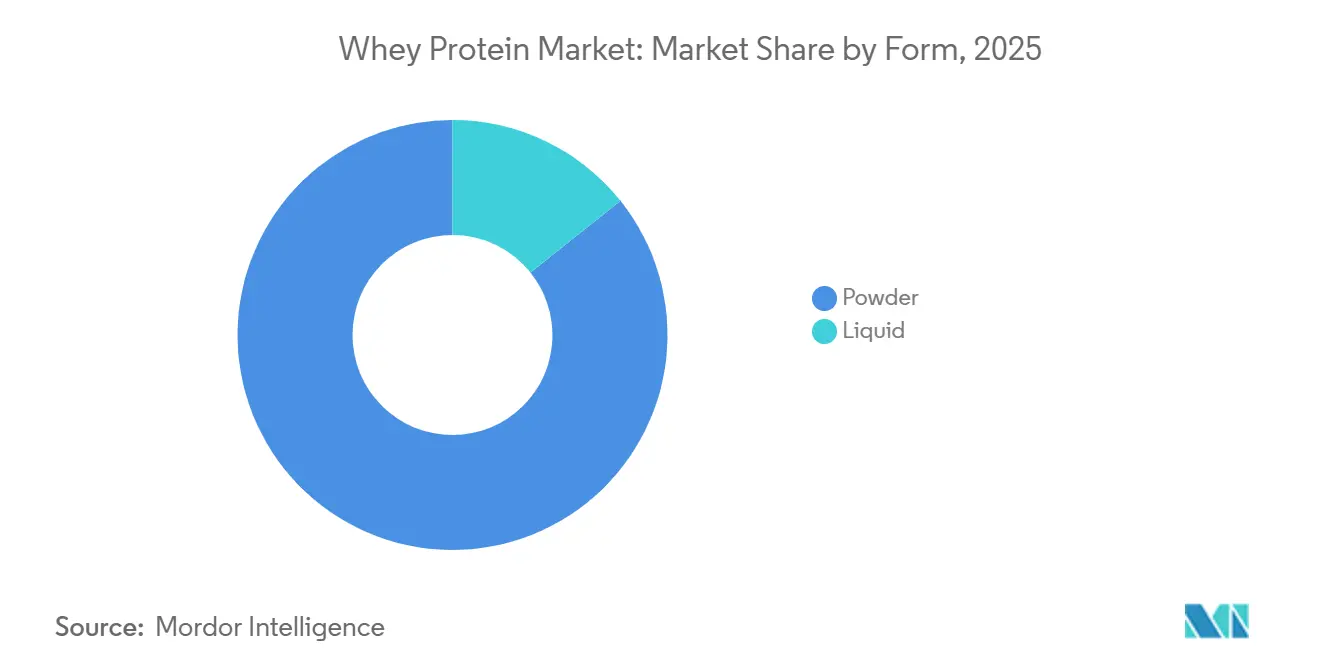
- By form, powders dominated with an 85.74% whey protein market share in 2025, whereas liquids are tracking a 4.93% CAGR to 2031.
- By application, food and beverages commanded 58.42% of the whey protein market size in 2025, while supplements are set to advance at a 5.78% CAGR through 2031.
- By geography, North America held 36.43% of revenue in 2025, yet Asia-Pacific is poised for a 5.56% CAGR to 2031.
Note: Market size and forecast figures in this report are generated using Mordor Intelligence’s proprietary estimation framework, updated with the latest available data and insights as of January 2026.
Global Whey Protein Market Trends and Insights
Drivers Impact Analysis*
| Driver | (~) % Impact on CAGR Forecast | Geographic Relevance | Impact Timeline |
|---|---|---|---|
| Rising demand for high-protein sports-nutrition products | +1.8% | Global, with concentration in North America, Europe, and urban Asia-Pacific | Medium term (2-4 years) |
| Expanding use in functional and fortified foods and beverages | +1.2% | Global, particularly North America, Europe, and emerging Asia-Pacific markets | Long term (≥ 4 years) |
| Growing penetration in infant nutrition across emerging markets | +1.5% | Asia-Pacific (China, India, Southeast Asia), Middle East and Africa, South America | Long term (≥ 4 years) |
| Micro-/ultra-filtration tech enabling clear whey beverages | +0.9% | Global, led by North America and Europe, adoption is spreading to the Asia-Pacific | Medium term (2-4 years) |
| Surplus cheese output lowers raw-material costs | +0.7% | North America (United States primary), spillover to global pricing | Short term (≤ 2 years) |
| Online D2C brands boost demand for premium flavored isolates | +0.6% | North America, Europe, urban Asia-Pacific | Short term (≤ 2 years) |
| Source: Mordor Intelligence | |||


Rising demand for high-protein sports-nutrition products
Sports nutrition has transitioned from a niche focus on bodybuilding to a mainstream wellness trend, with protein content now driving purchases across various demographics. In the U.S., 27% of consumers prioritize high-protein content in their food and beverage choices. Furthermore, projections indicate the U.S. protein market will hit USD 9.7 billion by 2032, as highlighted in Fonterra's Ingredients business overview. This evolution mirrors significant lifestyle shifts: the rise of remote work, adaptable gym hours, and the influence of fitness personalities on social media have made daily protein supplementation commonplace, extending its appeal beyond just elite athletes. Whey protein isolate, boasting a 90-92% protein content and quick digestion, has emerged as the preferred choice for post-workout recovery and meal-replacement shakes. It's now outpacing lower-purity concentrates in premium offerings. The industry's pivot towards an "active lifestyle" branding, focusing on casual exercisers over elite athletes, has broadened the market's reach. In response, manufacturers are introducing single-serve sachets, ready-to-drink options, and innovative flavors like salted caramel, matcha, and cold brew coffee. These moves cater to younger consumers seeking convenience, especially those who turn away from the chalky taste and artificial sweeteners of traditional powders.
Expanding use in functional and fortified foods and beverages
Functional foods and beverages, designed to offer health benefits beyond basic nutrition, are increasingly incorporating whey protein to fulfill clean-label, high-protein, and satiety claims. Bakery manufacturers are enhancing bread, muffins, and protein bars with whey protein concentrate and isolate, boosting protein density while preserving texture. They leverage whey’s water-binding and emulsification properties to maintain moisture and extend shelf life. Beverage formulators are introducing whey protein hydrolysates in clear, carbonated protein drinks. Enzymatic hydrolysis, which reduces turbidity and prevents heat-induced coagulation, enables this innovation. Arla Foods' 2024 patent highlights enzyme combinations, serine endopeptidase from Bacillus, Aspergillus subtilase, and leucyl aminopeptidase, that achieve over 15% hydrolysis. Notably, they maintain bitterness below a caffeine-equivalent of 0.08% and keep nephelometric turbidity under 40 NTU in 4% solutions. This advancement paves the way for UHT-stable and carbonated beverage applications without the need for ultrafiltration. Dairy-alternative producers are merging whey protein isolate with oat, almond, or soy bases, crafting hybrid products that offer complete amino acid profiles. This innovation addresses the nutritional shortfall often found in plant-only formulations. Snack manufacturers are now infusing whey protein into extruded crisps, puffed snacks, and savory treats. They are capitalizing on whey’s neutral flavor and its ability to bind seasonings, marking a shift from the traditional sweet applications that dominated the category until 2023.
Growing penetration in infant nutrition across emerging markets
Whey protein's most lucrative applications are in infant formula and follow-on milk powders. As birth rates stabilize in Asia-Pacific, the Middle East, Africa, and South America, urbanization and increased maternal workforce participation are driving higher per-capita formula consumption. In 2024, China accounted for 24.6% of global whey imports, valued at USD 780.62 million (HS 040410). While this marked a 7.07% decline in value year-on-year, volume demand remained stable at 645,258 tons, with the U.S. supplying 30.42% of the import value. In India, the infant-nutrition market is growing as the Food Safety and Standards Authority of India (FSSAI) enforces stricter standards for infant milk substitutes, requiring a 60:40 whey-to-casein ratio to mimic breast milk. This shift favors whey protein isolate and demineralized whey over less pure concentrates. In Southeast Asia, countries like Thailand, Indonesia, and Vietnam are seeing multinational brands such as Nestlé, Danone, and Abbott localize production to avoid import tariffs and meet halal certification standards. This drives demand for whey ingredients compliant with Islamic dietary laws, certified by bodies like the Jabatan Kemajuan Islam Malaysia (JAKIM). A 2025 study in Biochemical and Biophysical Research Communications found that adding whey protein hydrolysates to infant formula increased bioactive peptide content by 101% post-digestion versus control formulas. These enhanced fractions, including immunomodulatory and antimicrobial properties, make premium hydrolysate-enriched formulas appealing to health-conscious parents willing to pay 30-50% premiums.
Micro-/ultra-filtration tech enabling clear whey beverages
Membrane-separation technologies, including microfiltration, ultrafiltration, nanofiltration, and reverse osmosis, have transformed whey processing into a precision ingredient platform. Microfiltration, with a pore size of 0.1-10 micrometers, removes fat and bacteria while preserving the native protein structure, enabling the production of whey protein isolate with 90-95% protein content and minimal denaturation. This is critical for applications requiring high solubility and neutral flavor. Ultrafiltration, operating at a pore size of 0.001-0.1 micrometers, concentrates proteins and peptides while allowing lactose, minerals, and water to permeate. This process customizes protein-to-lactose ratios for infant formula, sports nutrition, and medical nutrition. The rise of clear whey beverages, transparent, fruit-flavored drinks resembling sports drinks rather than milky shakes, is driven by enzymatic hydrolysis and ultrafiltration, which remove turbidity-causing peptides and lipids. In January 2025, the American Dairy Products Institute (ADPI) updated its whey protein hydrolysate definition (version 3.0), requiring a higher degree of hydrolysis than the starting whey protein material and compliance with the United States Federal Food, Drug, and Cosmetic Act[2]Source: American Dairy Products Institute, “Whey Protein Hydrolysate Standard v3.0,” adpi.org. This standardizes product claims and analytical methods across the industry. Clear whey beverages appeal to consumers who dislike the texture of traditional protein shakes and are driving growth in convenience retail outlets, such as gas stations, gyms, and airports, where shelf-stable, single-serve formats command premium prices.
Restraints Impact Analysis*
| Restraint | (~) % Impact on CAGR Forecast | Geographic Relevance | Impact Timeline |
|---|---|---|---|
| Volatile milk prices are impacting whey costs | -0.8% | Global, particularly Europe and Oceania; the United States is less affected due to a cheese surplus | Short term (≤ 2 years) |
| Rising competition from plant-based proteins | -0.6% | Global, with the highest intensity in North America and Europe | Medium term (2-4 years) |
| Lactose intolerance and allergen concerns among consumers | -0.4% | Global, particularly Asia-Pacific (high lactose intolerance prevalence), and urban markets | Long term (≥ 4 years) |
| Stricter EU lactose-label rules are squeezing certain formulas | -0.3% | Europe (EU member states), spillover to export markets requiring EU compliance | Medium term (2-4 years) |
| Source: Mordor Intelligence | |||
Volatile milk prices impacting whey costs
In 2024 and 2025, milk prices experienced sharp fluctuations, influenced by weather disruptions, rising feed costs, and changing global dairy demand. Fonterra, citing a tighter global milk supply and robust demand for dairy ingredients, upped its forecast for the 2024-25 season to NZD 7.25-8.25 per kilogram of milk solids (previously NZD 6.00-7.00). In December 2025, they further adjusted the 2025-26 forecast to NZD 9.00-10.00 per kilogram, highlighting ongoing supply constraints. While rising milk prices squeezed margins for whey processors, especially in regions where whey, a byproduct of cheese or casein, couldn't fetch premium prices, European processors felt the pinch most acutely in 2024. They grappled with high energy costs, particularly natural gas for spray drying, and a contracting milk supply. The latter was due to environmental regulations in the Netherlands, Denmark, and Ireland that limited herd sizes. On the other hand, U.S. whey processors enjoyed a plentiful supply from cheese production, offering them some protection against fluctuations in farmgate milk prices. However, smaller processors lacking integrated cheese operations faced tighter margins, leading some to exit the market or consolidate. Additionally, the volatility in input costs made long-term supply contracts less appealing. This pushed ingredient buyers, like infant-formula manufacturers and sports-nutrition brands, to opt for shorter contract durations or include price-adjustment clauses, complicating their financial planning and inventory management.
Rising competition from plant-based proteins
Driven by sustainability concerns, allergen-free positioning, and vegan dietary preferences, ingredients like pea, soy, rice, and faba bean, along with emerging sources such as mung bean and chickpea, are increasingly being used in sports nutrition, meal replacements, and dairy-alternative beverages. Notably, pea protein isolate has enhanced its taste and solubility through advancements like enzymatic debittering and flavor-masking technologies. This progress has narrowed the sensory gap with whey protein isolate, making it more appealing to consumers who prioritize environmental impact over traditional protein quality metrics like biological value or leucine content. Life-cycle assessments from consulting firms and environmental NGOs highlight that plant-based proteins use 5-10 times less water and produce 50-70% lower greenhouse gas emissions per kilogram compared to their dairy counterparts. This data crafts a compelling sustainability narrative for brands aiming at eco-conscious consumers. Yet, plant proteins come with nutritional challenges: many are incomplete (missing essential amino acids), boast lower digestibility-corrected amino acid scores (DIAAS) than whey, and often need synthetic amino acid fortification (like lysine and methionine) to rival whey's anabolic potential, raising questions on their clean-label claims. As a solution, hybrid formulations are gaining traction. By blending whey protein isolate with pea or rice protein, these hybrids promise a complete amino acid profile, better sustainability metrics, and cost savings. However, this trend risks diluting whey's market share and exerting downward pressure on its pricing, especially in cost-sensitive sectors like ready-to-drink beverages and protein bars.
*Our forecasts treat driver/restraint impacts as directional, not additive. The impact forecasts reflect baseline growth, mix effects, and variable interactions.
Segment Analysis
By Product Type: Isolate Gains as Hydrolysate Targets Clinical Niches
In 2025, whey protein concentrate led the market with a 58.96% share, driven by its cost-effectiveness (34-80% protein content) and versatility. It is widely used in bakery items, ready-to-eat meals, confectionery, and animal feed, where functional properties like water-binding, emulsification, and foaming outweigh the need for high protein purity. Concentrate is the primary ingredient in protein bars, baked goods, and processed meats, where manufacturers prioritize cost per gram of protein over label claims. Residual lactose (5-50%) and lipids (2-10%) enhance flavor, browning, and texture, avoiding reformulation. Whey protein isolate, projected to grow at 4.80% annually through 2031, is gaining traction in sports nutrition, infant formulas, and medical nutrition, where 90-92% protein purity, minimal lactose (below 1%), and clean labels are key. Growth in isolates is supported by membrane-filtration capacity expansions, such as Fonterra's NZD 75 million (USD 46 million) Studholme site upgrade targeting high-value proteins and Glanbia's USD 1 billion investment in Idaho to boost U.S. production. Whey protein hydrolysate, a smaller but fast-growing segment, is used in clinical nutrition (pre-digested protein for gut-compromised patients), hypoallergenic infant formulas, and clear whey beverages. Enzymatic hydrolysis reduces peptide size, improves solubility, and lowers allergenicity. Arla Foods' 2024 patent for a palatable extensively hydrolyzed whey achieving a hydrolysis degree above 15% without bitterness addresses the trade-off between functionality and taste, potentially expanding hydrolysate use in sports beverages.
Concentrate's dominance stems from entrenched supply chains and formulators' reluctance to reformulate cost-optimized products, but isolate's growth signals a shift toward premiumization. In January 2025, the American Dairy Products Institute's version 3.0 update to whey protein hydrolysate definitions standardized analytical methods for degree of hydrolysis and compositional claims, reducing formulation risks and regulatory uncertainties. Hydrolysate's niche status, with a 50-100% price premium over isolates, limits its market size but offers high margins for processors skilled in enzymatics and membrane chromatography. These processors can fractionate bioactive peptides like lactoferrin, glycomacropeptide, and immunoglobulins, which command pharmaceutical-grade prices in nutraceutical and clinical applications.


By Form: Powder Dominates but Liquid Gains in RTD Channels
In 2025, powder formats dominated the market with an 85.74% share, driven by established spray-drying infrastructure, a 12-24 month shelf life, low shipping costs, and consumer preference for scoopable tubs and single-serve sachets. Powders are widely used as bulk concentrates in bakeries and animal feed, isolates in sports nutrition and infant formulas, and hydrolysates in medical nutrition and specialized supplements. Spray-drying technology, where liquid whey concentrate is atomized and dried in hot air chambers, remains the industry standard. In the U.S., over 200 whey-drying plants produce more than 935,000 metric tons of whey and lactose products annually, accounting for over 25% of global production. Powders benefit from ambient storage, low water activity that inhibits microbial growth, and compatibility with supply chains like bulk bags and consumer tubs. Innovations such as agglomeration for better mixability, lecithin addition to reduce clumping, and flavor encapsulation ensure continued consumer acceptance.
Liquid whey protein, projected to grow at 4.93% annually through 2031, is gaining traction in ready-to-drink sports beverages, meal-replacement shakes, and UHT-stable functional drinks. Convenience, portability, and immediate consumption drive purchases. Liquid formats eliminate the mixing step, appealing to on-the-go consumers and those averse to powder textures or clumping. They also enable differentiation through carbonation, fruit infusions, and coffee blends, features difficult to replicate in powders. Fonterra's NZD 150 million (USD 92 million) investment in a UHT cream plant at Edendale, set for completion in H2 2026, highlights confidence in liquid dairy ingredient production for foodservice and beverage applications. Clear whey beverages, transparent, fruit-flavored drinks achieved through hydrolysis and ultrafiltration, target consumers who find milky protein shakes heavy or hard to digest. Early adopters like Optimum Nutrition's Clear Whey and MyProtein's Clear Whey Isolate report strong repeat-purchase rates in convenience retail. However, liquid formats face higher production costs, heavier shipping weights, and shorter shelf life (6-12 months refrigerated, 12-18 months UHT), limiting adoption in cost-sensitive or distribution-constrained markets.
By Application: Supplements Outpace Food and Beverage Growth
In 2025, food and beverages led the market with 58.42%, including bakery items (protein-enriched bread, muffins, cookies), beverages (protein shakes, smoothies, coffee drinks), breakfast cereals (high-protein granola, oatmeal), condiments and sauces (protein-fortified dressings, gravies), dairy and dairy-alternative products (Greek yogurt, protein milk, oat-whey blends), ready-to-cook and ready-to-eat meals (frozen entrees, meal kits), and snacks (protein bars, crisps, jerky). Whey protein's versatility supports water-binding, gel-formation, emulsification, foaming, heat stability, and a neutral flavor profile. Bakery manufacturers use whey protein concentrate to enhance dough handling, moisture retention, and shelf life, while beverage formulators prefer whey protein isolate for its clarity and rapid dissolution. Dairy-alternative producers blend whey protein isolate with plant bases (oat, almond, soy) to create hybrid products with complete amino acid profiles and creamier textures, addressing flexitarian consumer needs.
Supplements, including infant formula, sports nutrition, and medical nutrition, held a smaller share in 2025 but are projected to grow at 5.78% annually through 2031, driven by aging populations, protein awareness, and regulatory approvals. Infant formulas and follow-on milk powders use whey protein isolate or demineralized whey to achieve a 60:40 whey-to-casein ratio, mimicking breast milk, and command premiums when fortified with bioactive fractions. Sports nutrition, protein powders, ready-to-drink shakes, bars, and gels target active consumers and have expanded into mainstream retail and e-commerce. Elderly and medical nutrition formulations use whey protein hydrolysates to improve absorption and reduce gastrointestinal distress. A 2025 study showed enzyme-treated whey protein hydrolysates increased protein digestibility from 25% to 69-70%. In personal care, whey protein is used in hair-care products and skin creams for its moisturizing and antioxidant properties, though this segment remains small. Animal feed applications use lower-grade whey protein concentrate and permeate but face competition from soy meal, fishmeal, and synthetic amino acids.
Geography Analysis
In 2025, North America held 36.43% of the market, driven by the United States' leadership as the top global dairy producer, generating 75 million metric tons of milk annually (19.5% of global supply). The U.S. also leads in whey processing, with over 200 plants producing 935,000 metric tons of whey and lactose products (25% of global output). Advanced infrastructure, abundant whey supply, and export channels (United States Dairy Export Council in 20+ countries) enable U.S. processors to meet domestic sports-nutrition and infant-formula demand while exporting to Asia, South America, and the Middle East. Key investments include Glanbia's USD 1 billion Idaho expansion, Tirlán's EUR 126 million (USD 137 million) Ireland facility (operational by 2027), and USD 1.1 billion across 15 Wisconsin projects in 2025. Canada and Mexico benefit from USMCA trade provisions and growing local sports-nutrition and functional-beverage brands emphasizing sustainability and transparency.
Asia-Pacific is projected to grow at 5.56% annually through 2031, led by China, India, and Southeast Asia. Rising infant-formula demand, middle-class protein consumption, and government nutrition programs drive whey imports. In India, FSSAI's stricter standards favor whey protein isolate and demineralized whey, while urban centers see growing sports-nutrition demand. Japan's functional-foods market supports whey protein with bioactive benefits, and Australia and New Zealand serve as production hubs. Fonterra's NZD 3.845 billion (USD 2.36 billion) divestment to Lactalis in 2025 highlights its focus on B2B dairy ingredients and regional growth.
Europe leads in technology and regulations, with advanced facilities in Germany, France, the UK, the Netherlands, and Scandinavia producing premium isolates and bioactive fractions for infant formula, medical nutrition, and sports supplements. The European Food Safety Authority's 2024 lactose-labeling update (<0.1 grams per 100 grams) consolidated supply among major players like Arla Foods Ingredients, FrieslandCampina, and Lactalis Ingredients[3]Source: European Food Safety Authority, “Updated Lactose-Free Criteria,” efsa.europa.eu. Arla's expansion at its Arinco facility and patented hydrolyzed whey protein hydrolysates (2024) showcase innovation. In South America, Brazil and Argentina are expanding whey-drying and filtration capacities to reduce imports, with Carbery Group reporting EUR 668 million (USD 728 million) revenue in 2024 and expanding in Brazil, the U.S., Japan, and Southeast Asia. The Middle East and Africa, though smaller, is growing rapidly due to urbanization, population growth, and government nutrition initiatives, with over 3 billion consumers across Asia, the Middle East, and Africa driving demand for innovative dairy solutions.

Competitive Landscape
The whey protein market is moderately concentrated, with major players such as Fonterra, Glanbia, Arla Foods Ingredients, Kerry Group PLC, and Royal FrieslandCampina NV controlling significant production capacities and export channels. However, the market also includes numerous smaller regional players, toll manufacturers, and specialty-fraction producers, creating a fragmented competitive landscape, particularly in niche segments. Established cooperatives leverage scale advantages, including bulk whey purchasing, amortized capital costs for advanced equipment, and established distribution networks, to dominate the commodity concentrate and mid-tier isolate markets. In contrast, smaller players differentiate themselves through organic certifications, grass-fed sourcing, single-origin traceability, and proprietary enzymatic processes that yield unique peptide profiles. The market exhibits a bifurcation, with commodity players focusing on operational efficiencies like energy-efficient dryers and automation to protect margins, while premium players invest in research and development and direct-to-consumer channels to capture higher-margin segments less vulnerable to plant-based protein substitution. Emerging opportunities include hypoallergenic hydrolysates for infant formulas, clear whey beverages for convenience retail, and bioactive peptide fractions for clinical and nutraceutical applications, where regulatory barriers protect early movers.
Arla Foods' 2024 patent for palatable extensively hydrolyzed whey protein hydrolysates (US20240373875A1) highlights the industry's focus on technology-driven differentiation. The patent describes enzyme combinations that achieve a hydrolysis degree above 15% while maintaining bitterness below 0.08% caffeine equivalence and nephelometric turbidity under 40 NTU. This innovation enables UHT-stable and carbonated beverage applications without ultrafiltration, reducing capital and operating costs while expanding potential applications. Meanwhile, direct-to-consumer brands like Transparent Labs, Kion, and Naked Nutrition are disrupting the market by bypassing traditional retail channels, leveraging social media influencers, and offering third-party tested, clean-label formulations at premium prices. These brands appeal to younger consumers who are skeptical of legacy supplement brands' proprietary blends and undisclosed sourcing. Plant-based protein startups, including Ripple Foods and NotCo, are challenging whey protein's nutritional and sustainability positioning. However, plant proteins often fall short in digestibility, amino acid completeness, and taste, creating opportunities for hybrid whey-plant formulations that balance nutrition, sustainability, and cost.
Regulatory compliance remains a critical factor in the whey protein market. Established players benefit from robust quality-control infrastructures, including HACCP protocols, ISO certifications, and third-party audits, which enable them to meet stringent standards set by United States Department of Agriculture, European Food Safety Authority, Food Safety and Standards Authority of India, and Codex Alimentarius. These regulatory frameworks create a compliance moat that favors larger players with the resources to navigate complex requirements. Smaller entrants, on the other hand, face higher per-unit compliance costs and significant barriers to market access. This regulatory advantage, combined with established players' expertise in navigating international trade specifications, further consolidates their position in the market while posing challenges for new entrants aiming to scale their operations.
Whey Protein Industry Leaders
Arla Foods AMBA
Fonterra Co-operative Group Limited
Glanbia PLC
Kerry Group PLC
Royal FrieslandCampina NV
- *Disclaimer: Major Players sorted in no particular order

Recent Industry Developments
- October 2024: Fonterra announced a NZD 150 million (approximately USD 92 million) investment to build a new UHT (ultra-high temperature) milk processing plant at its Edendale site in New Zealand, expanding processing capacity and flexibility for long-life dairy products to support export and domestic supply of shelf-stable dairy ingredients and consumer milk, with the project expected to strengthen regional manufacturing capability in Southland and affect whey and dairy ingredient flows by increasing capacity for long-life milk streams.
- August 2024: Fonterra announced a NZD 75 million (USD 46 million) expansion of its Studholme (South Island, New Zealand) site to create a hub for high-value dairy proteins targeting premium applications like medical and sports nutrition. Site works will begin in September 2024, with the first product expected in 2026. The expansion will add 6 permanent roles and employ Canterbury-region contractors. The project also supports converting Studholme's coal boiler to a coal-free alternative, aligning with Fonterra's goal to exit coal by 2037.
- March 2024: Westland Milk Products (owned by Yili Group) announced a NZD 70 million (approximately USD 43 million) investment to build a new lactoferrin plant at its Hokitika facility in New Zealand, with the investment supported by parent Yili Group and expected to triple production capacity for lactoferrin, a minor milk protein with growing international demand across multiple nutritional categories due to reported health benefits.


Global Whey Protein Market Report Scope
Whey protein is defined as a high-quality, water-soluble "complete" protein typically derived as a byproduct of the dairy industry during the cheese-making or paneer process. The Whey protein market is segmented by product type, form, application, and geography. By product type, the market is segmented into whey protein concentrate, whey protein isolate, and whey protein hydrolysate. By form, the market is segmented into powder and liquid. By application, the market is segmented into animal feed, food and beverages, personal care and cosmetics, and supplements. The food and beverages segment is further segmented into bakery, beverages, breakfast cereals, condiments/sauces, dairy and dairy alternative products, ready-to-cook/ready-to-eat food products, and snacks. Similarly, the supplements segment is further segmented into baby food and infant formula, elderly nutrition and medical nutrition, and sport/performance nutrition. By geography, the market is segmented into North America, Europe, Asia-Pacific, South America, and the Middle East and Africa. The Market Forecasts are Provided in Terms of Value (USD).
Product Type
| Whey Protein Concentrate |
| Whey Protein Isolate |
| Whey Protein Hydrolysate |
Form
| Powder |
| Liquid |
Application
| Animal Feed | |
| Food and Beverages | Bakery |
| Beverages | |
| Breakfast Cereals | |
| Condiments/Sauces | |
| Dairy and Dairy Alternative Products | |
| Ready-to-cook/Ready-to-eat Food Products | |
| Snacks | |
| Personal Care and Cosmetics | |
| Supplements | Baby Food and Infant Formula |
| Elderly Nutrition and Medical Nutrition | |
| Sport/Performance Nutrition |
Geography
| North America | United States |
| Canada | |
| Mexico | |
| Rest of North America | |
| Europe | United Kingdom |
| Germany | |
| France | |
| Italy | |
| Spain | |
| Sweden | |
| Belgium | |
| Poland | |
| Netherlands | |
| Rest of Europe | |
| Asia-Pacific | China |
| Japan | |
| India | |
| Thailand | |
| Singapore | |
| Indonesia | |
| South Korea | |
| Australia | |
| New Zealand | |
| Rest of Asia Pacific | |
| South America | Brazil |
| Argentina | |
| Peru | |
| Colombia | |
| Chile | |
| Rest of South America | |
| Middle East and Africa | South Africa |
| Nigeria | |
| Egypt | |
| Morocco | |
| Turkey | |
| Rest of Middle East and Africa |
| Product Type | Whey Protein Concentrate | |
| Whey Protein Isolate | ||
| Whey Protein Hydrolysate | ||
| Form | Powder | |
| Liquid | ||
| Application | Animal Feed | |
| Food and Beverages | Bakery | |
| Beverages | ||
| Breakfast Cereals | ||
| Condiments/Sauces | ||
| Dairy and Dairy Alternative Products | ||
| Ready-to-cook/Ready-to-eat Food Products | ||
| Snacks | ||
| Personal Care and Cosmetics | ||
| Supplements | Baby Food and Infant Formula | |
| Elderly Nutrition and Medical Nutrition | ||
| Sport/Performance Nutrition | ||
| Geography | North America | United States |
| Canada | ||
| Mexico | ||
| Rest of North America | ||
| Europe | United Kingdom | |
| Germany | ||
| France | ||
| Italy | ||
| Spain | ||
| Sweden | ||
| Belgium | ||
| Poland | ||
| Netherlands | ||
| Rest of Europe | ||
| Asia-Pacific | China | |
| Japan | ||
| India | ||
| Thailand | ||
| Singapore | ||
| Indonesia | ||
| South Korea | ||
| Australia | ||
| New Zealand | ||
| Rest of Asia Pacific | ||
| South America | Brazil | |
| Argentina | ||
| Peru | ||
| Colombia | ||
| Chile | ||
| Rest of South America | ||
| Middle East and Africa | South Africa | |
| Nigeria | ||
| Egypt | ||
| Morocco | ||
| Turkey | ||
| Rest of Middle East and Africa | ||


Market Definition
- End User - The Protein Ingredients Market operates on a B2B basis. Food, Beverages, Supplements, Animal Feed, and Personal Care & Cosmetic manufacturers are considered to be end-consumers in the market studied. The scope excludes manufacturers buying liquid/dry whey to be used for application as a binding agent or thickener or other non-protein applications.
- Penetration Rate - Penetration Rate is defined as the percentage of Protein-Fortified End User Market Volume in the Overall End User Market Volume.
- Average Protein Content - Average protein content is the average protein content present per 100 g of product manufactured by all end-user companies considered under the scope of this report.
- End User Market Volume - End-user market volume is the consolidated volume of all types and forms of end-user products in the country or region.
| Keyword | Definition |
|---|---|
| Alpha-lactalbumin (α-Lactalbumin) | It is a protein that regulates the production of lactose in the milk of almost all mammalian species. |
| Amino acid | It is an organic compound that contains both amino and carboxylic acid functional groups, which are required for the synthesis of body protein and other important nitrogen-containing compounds, such as creatine, peptide hormones, and some neurotransmitters. |
| Blanching | It is the process of briefly heating vegetables with steam or boiling water. |
| BRC | British Retail Consortium |
| Bread improver | It is a flour-based blend of several components with specific functional properties designed to modify dough characteristics and give quality attributes to bread. |
| BSF | Black Soldier Fly |
| Caseinate | It is a substance produced by adding an alkali to acid casein, a derivative of casein. |
| Celiac disease | Celiac disease is an immune reaction to eating gluten, a protein found in wheat, barley, and rye. |
| Colostrum | It is a milky fluid that’s released by mammals that have recently given birth before breast milk production begins. |
| Concentrate | It is the least processed form of protein and has a protein content ranging from 40-90% by weight. |
| Dry protein basis | It refers to the percentage of "pure protein" present in a supplement after the water in it is completely removed through heat. |
| Dry whey | It is the product resulting from drying fresh whey which has been pasteurized and to which nothing has been added as a preservative. |
| Egg protein | It is a mixture of individual proteins, including ovalbumin, ovomucoid, ovoglobulin, conalbumin, vitellin, and vitellenin. |
| Emulsifier | It is a food additive that facilitates the blending of foods that are immiscible with one another, such as oil and water. |
| Enrichment | It is the process of addition of micronutrients that are lost during the processing of the product. |
| ERS | Economic Research Service of the USDA |
| Extrusion | It is the process of forcing soft mixed ingredients through an opening in a perforated plate or die designed to produce the required shape. The extruded food is then cut to a specific size by blades. |
| Fava | Also known as Faba, it is another word for yellow split beans. |
| FDA | Food and Drug Administration |
| Flaking | It is a process in which typically a cereal grain (like corn, wheat, or rice) is broken down into grits, cooked with flavors and syrups, and then pressed into flakes between cooled rollers. |
| Foaming agent | It is a food ingredient that makes it possible to form or maintain a uniform dispersion of a gaseous phase in a liquid or solid food. |
| Foodservice | It refers to the part of the food industry which includes businesses, institutions, and companies which prepare meals outside the home. It includes restaurants, school and hospital cafeterias, catering operations, and many other formats. |
| Fortification | It is the deliberate addition of micronutrients that are not found in them naturally or which are lost during processing, to improve a food product's nutritional value. |
| FSANZ | Food Standards Australia New Zealand |
| FSIS | Food Safety and Inspection Service |
| FSSAI | Food Safety and Standards Authority of India |
| Gelling agent | It is an ingredient that functions as a stabilizer and thickener to provide thickening without stiffness through the formation of gel. |
| GHG | Greenhouse Gas |
| Gluten | It is a family of proteins found in grains, including wheat, rye, spelt, and barley. |
| Hemp | It is a botanical class of Cannabis sativa cultivars grown specifically for industrial or medicinal use. |
| Hydrolysate | It is a form of protein manufactured by exposing the protein to enzymes that can partially break the bonds between the protein's amino acids and break down large, complicated proteins into smaller pieces. Its processing makes it easier and quicker to digest. |
| Hypoallergenic | It refers to a substance that causes fewer allergic reactions. |
| Isolate | It is the purest and most processed form of protein which has undergone separation to obtain a pure protein fraction. It typically contains ≥ 90% of protein by weight. |
| Keratin | It is a protein that helps form hair, nails, and the outer layer of skin. |
| Lactalbumin | It is the albumin contained in milk and obtained from whey. |
| Lactoferrin | It is an iron‑binding glycoprotein that is present in the milk of most mammals. |
| Lupin | It is the yellow legume seeds of the genus Lupinus. |
| Millenial | Also known as Generation Y or Gen Y, it refers to the people born from 1981 to 1996. |
| Monogastric | It refers to an animal with a single-compartmented stomach. Examples of monogastric include humans, poultry, pigs, horses, rabbits, dogs, and cats. Most monogastric are generally unable to digest much cellulose food materials such as grasses. |
| MPC | Milk protein concentrate |
| MPI | Milk protein isolate |
| MSPI | Methylated soy protein isolate |
| Mycoprotein | Mycoprotein is a form of single-cell protein, also known as fungal protein, derived from fungi for human consumption. |
| Nutricosmetics | It is a category of products and ingredients that act as nutritional supplements to care for skin, nails, and hair natural beauty. |
| Osteoporosis | It is a medical condition in which the bones become brittle and fragile from loss of tissue, typically as a result of hormonal changes, or deficiency of calcium or vitamin D. |
| PDCAAS | Protein digestibility-corrected amino acid score (PDCAAS) is a method of evaluating the quality of a protein based on both the amino acid requirements of humans and their ability to digest it. |
| Per-capita consumption of animal protein | It is the average amount of animal protein (such as milk, whey, gelatin, collagen, and egg proteins) that is readily available for consumption by each person in an actual population. |
| Per-capita consumption of plant protein | It is the average amount of plant protein (such as soy, wheat, pea, oat, and hemp proteins) that is readily available for consumption by each person in an actual population. |
| Quorn | It is a microbial protein manufactured using mycoprotein as an ingredient, in which the fungus culture is dried and mixed with egg albumen or potato protein, which acts as a binder, and then is adjusted in texture and pressed into various forms. |
| Ready-to-Cook (RTC) | It refers to food products that include all of the ingredients, where some preparation or cooking is required through a process that is given on the package. |
| Ready-to-Eat (RTE) | It refers to a food product prepared or cooked in advance, with no further cooking or preparation required before being eaten. |
| RTD | Ready-to-Drink |
| RTS | Ready-to-Serve |
| Saturated fat | It is a type of fat in which the fatty acid chains have all single bonds. It is generally considered unhealthy. |
| Sausage | It is a meat product made of finely chopped and seasoned meat, which may be fresh, smoked, or pickled and which is then usually stuffed into a casing. |
| Seitan | It is a plant-based meat substitute made out of wheat gluten. |
| Softgel | It is a gelatin-based capsule with a liquid fill. |
| SPC | Soy protein concentrate |
| SPI | Soy protein isolate |
| Spirulina | It is a biomass of cyanobacteria that can be consumed by humans and animals. |
| Stabilizer | It is an ingredient added to food products to help maintain or enhance their original texture, and physical and chemical characteristics. |
| Supplementation | It is the consumption or provision of concentrated sources of nutrients or other substances that are intended to supplement nutrients in the diet and is intended to correct nutritional deficiencies. |
| Texturant | It is a specific type of food ingredient that is used to control and alter the mouthfeel and texture of food and beverage products. |
| Thickener | It is an ingredient that is used to increase the viscosity of a liquid or dough and make it thicker, without substantially changing its other properties. |
| Trans fat | Also called trans-unsaturated fatty acids or trans fatty acids, it is a type of unsaturated fat that naturally occurs in small amounts in meat. |
| TSP | Textured soy protein |
| TVP | Textured vegetable protein |
| WPC | Whey protein concentrate |
| WPI | Whey protein isolate |


Research Methodology
Mordor Intelligence follows a four-step methodology in all our reports.
- Step-1: Identify Key Variables: The quantifiable key variables (industry and extraneous) pertaining to the specific product segment and country are selected from a group of relevant variables & factors based on desk research & literature review; along with primary expert inputs. These variables are further confirmed through regression modeling (wherever required).
- Step-2: Build a Market Model: In order to build a robust forecasting methodology, the variables and factors identified in Step-1 are tested against available historical market numbers. Through an iterative process, the variables required for market forecast are set and the model is built on the basis of these variables.
- Step-3: Validate and Finalize: In this important step, all market numbers, variables and analyst calls are validated through an extensive network of primary research experts from the market studied. The respondents are selected across levels and functions to generate a holistic picture of the market studied.
- Step-4: Research Outputs: Syndicated Reports, Custom Consulting Assignments, Databases & Subscription Platforms


