
Wearable Health Sensors Market Size and Share
Market Overview
| Study Period | 2020 - 2031 |
|---|---|
| Market Size (2026) | USD 2.09 Billion |
| Market Size (2031) | USD 4.16 Billion |
| Growth Rate (2026 - 2031) | 14.78% CAGR |
| Fastest Growing Market | Asia Pacific |
| Largest Market | Europe |
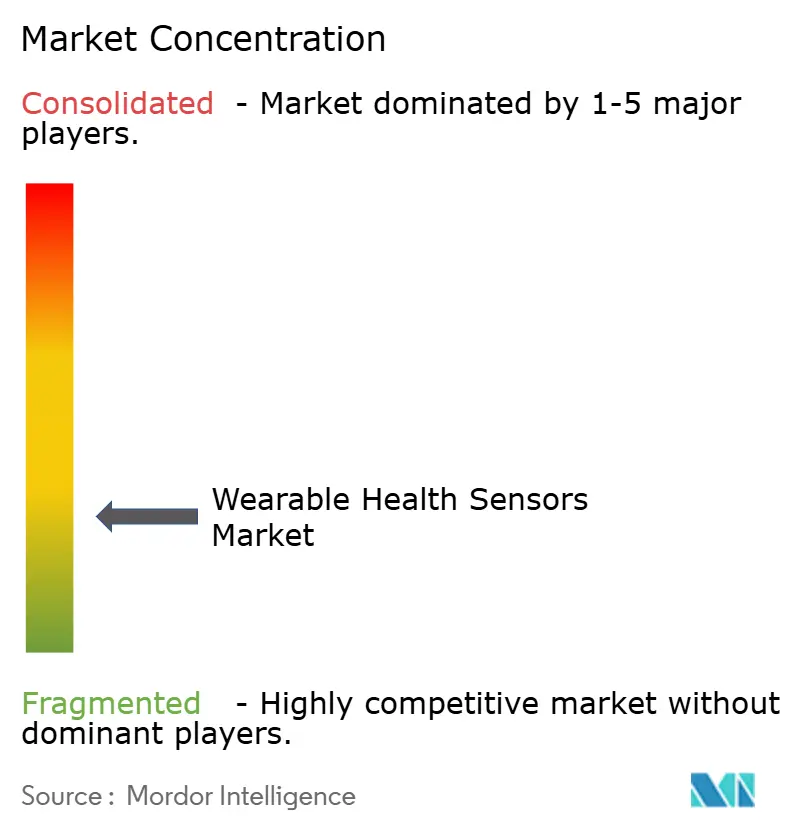
| Market Concentration | Low |
Major Players *Disclaimer: Major Players sorted in no particular order Image © Mordor Intelligence. Reuse requires attribution under CC BY 4.0. | |
Wearable Health Sensors Market Analysis by Mordor Intelligence
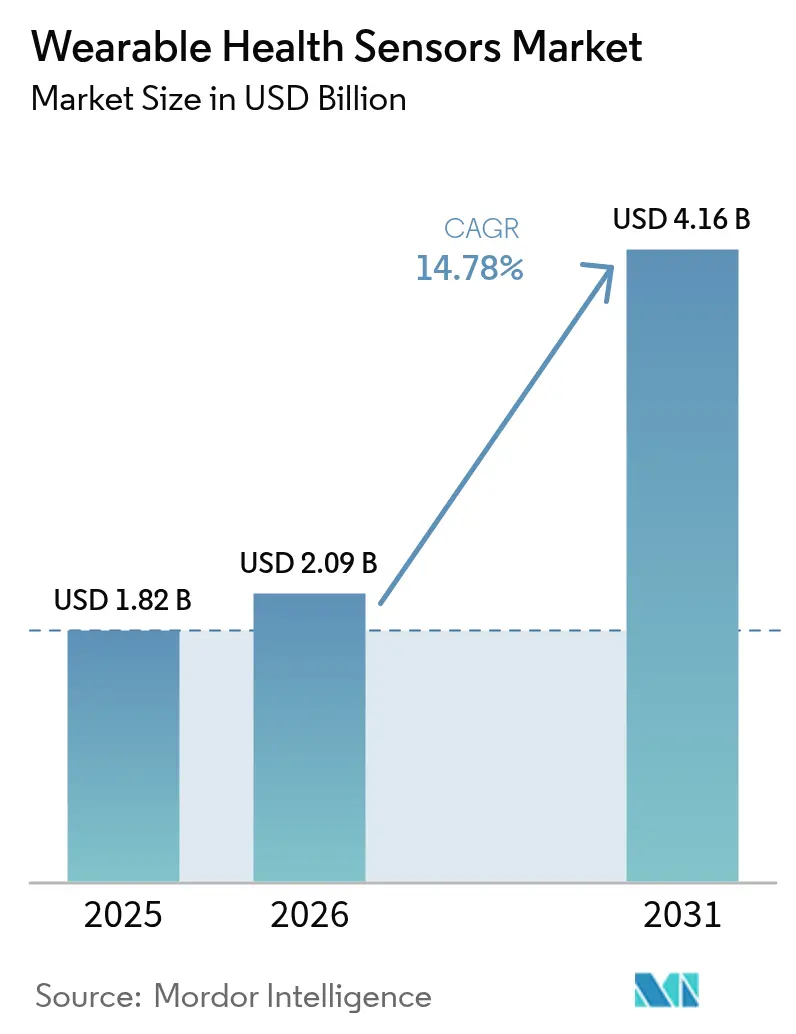
The wearable health sensors market size was valued at USD 1.82 billion in 2025 and estimated to grow from USD 2.09 billion in 2026 to reach USD 4.16 billion by 2031, at a CAGR of 14.78% during the forecast period (2026-2031). Demand is shifting from episodic care toward continuous monitoring as payers and providers see clear cost savings from early intervention. Miniaturized sensors paired with Bluetooth Low Energy, LTE-M, and NB-IoT keep power draw low while moving clinical-grade data into secure cloud platforms. North American adoption benefits from Remote Patient Monitoring (RPM) reimbursements, while cost breakthroughs in printed bio-patches expand use in Europe and Asia. Competitive activity centers on non-invasive glucose detection, skin-tone agnostic optical sensing, and hybrid MEMS-optical stacks that raise accuracy without harming battery life. Partnerships between silicon vendors and device brands are accelerating time-to-market for multi-parameter wearables across consumer, clinical, and industrial settings.
Key Report Takeaways
- By sensor type, accelerometers and inertial MEMS led with 31.80% of the wearable health sensors market share in 2025; optical/PPG sensors post the fastest 15.28% CAGR to 2031.
- By body placement, wrist-worn devices held 44.20% revenue share in 2025, while smart textiles expand at 15.05% CAGR through 2031.
- By application, remote patient monitoring and elderly care captured 38.10% of the wearable health sensors market size in 2025 and grow at 14.78% CAGR to 2031.
- By end user, home-healthcare agencies register the highest 25.10% CAGR to 2031, overtaking consumer channels in growth speed.
- By connectivity, BLE continued to dominate with 60.20% share in 2025 as cellular modules post a 14.35% CAGR on autonomy needs.
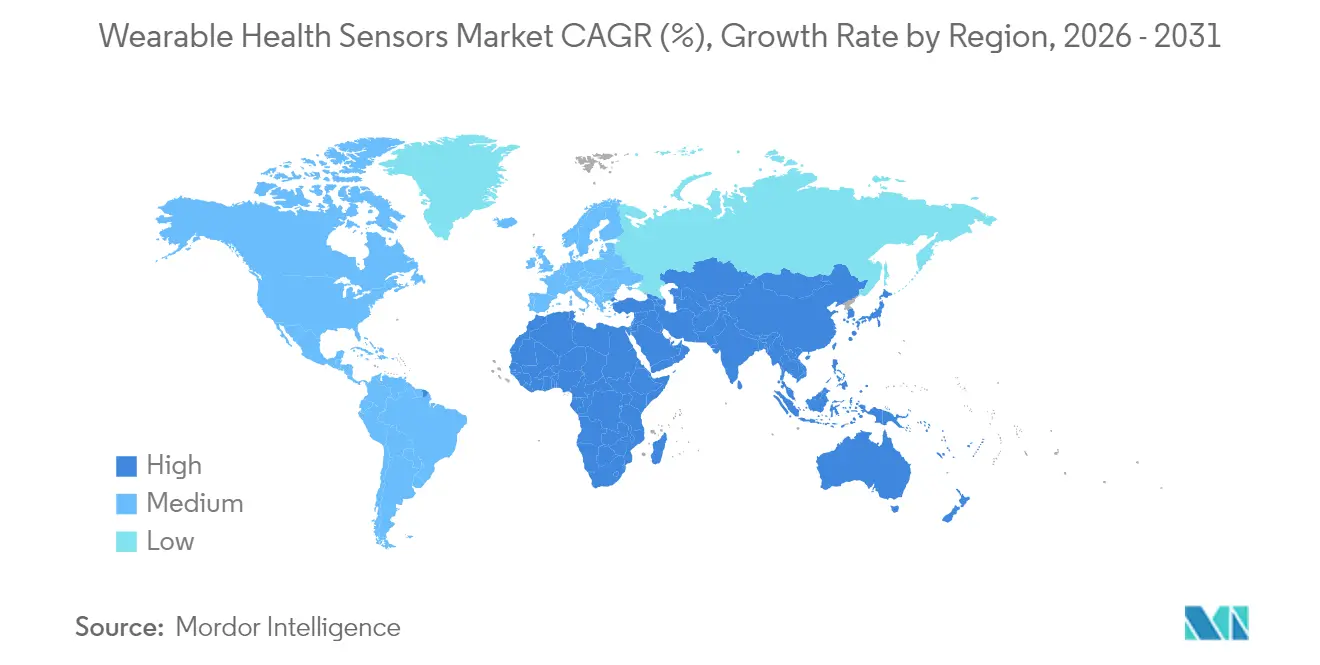
- Regionally, North America accounted for 38.20% of 2025 revenues, whereas Asia-Pacific records the strongest 13.72% CAGR to 2031.
Note: Market size and forecast figures in this report are generated using Mordor Intelligence’s proprietary estimation framework, updated with the latest available data and insights as of 2026.
Global Wearable Health Sensors Market Trends and Insights
Drivers Impact Analysis*
| DRIVER | (~) % IMPACT ON CAGR FORECAST | GEOGRAPHIC RELEVANCE | IMPACT TIMELINE |
|---|---|---|---|
| FDA-Reimbursed Remote Patient Monitoring Codes Accelerating U.S. Prescription-Grade Wearables | +3.5% | North America, with spillover to Europe | Medium term (2-4 years) |
| National Chronic-Disease Screening Mandates in Asia Driving Continuous BP / CGM Kits | +2.8% | Asia-Pacific, particularly China, Japan, and India | Medium term (2-4 years) |
| Scale-up of Printed Flexible Bio-Patches in EU Cutting Unit Cost Below US$1 | +1.9% | Europe, with global adoption following | Long term (≥ 4 years) |
| AI-Enabled Injury-Prevention Wearables Adopted by Elite Sports Leagues | +1.4% | North America, Europe | Short term (≤ 2 years) |
| Worker-Safety Heat-Strain Programs in GCC Oil and Gas Operations | +1.2% | Middle East, with adoption in other high-temperature industrial environments | Medium term (2-4 years) |
| Venture Funding Surge in Non-invasive Glucose Optical Sensors | +2.1% | Global, with initial concentration in North America | Long term (≥ 4 years) |
| Source: Mordor Intelligence | |||
FDA-reimbursed Remote Patient Monitoring codes accelerating U.S. prescription-grade wearables
RPM billing simplification that cut mandatory capture from 16 to 12 days per 30-day cycle unlocked a USD 5.1 billion annual device pool. Providers now receive up to USD 1,400 per patient yearly, funding enterprise-grade sensor platforms over retail gadgets. Major health systems formed dedicated RPM teams, expanding procurement pipelines for validated patches and smartwatches that feed EHR dashboards. Hospital readmission rates for chronic patients have fallen 30%, reinforcing payer support.[1]U.S. Department of Health and Human Services, “Billing for Remote Patient Monitoring,” Telehealth.HHS.gov, telehealth.hhs.gov
National chronic-disease screening mandates in Asia driving continuous BP and CGM kits
China earmarked USD 8.7 billion for diabetes and hypertension screening under its latest Five-Year Plan and posts 22.3% annual device demand growth.[2]Vietnam National University, “Hybrid Sensor Integration for Cardiovascular Monitoring,” ScienceDirect, sciencedirect.com Japan mandates yearly cardiovascular checks for citizens older than 40, embedding wearable sensors into universal coverage. These programs create long-run datasets for AI decision support while normalizing at-home diagnostics across the region.
Scale-up of printed flexible bio-patches in the EU cutting unit cost below USD 1
European printed-electronics lines grew capacity 340% since 2023, pushing disposable bio-patch cost below USD 1. Healthcare providers now deploy single-use sensors for post-operative monitoring at prices comparable with traditional dressings. Biodegradable e-textiles lose 48% weight after four months in soil, easing hospital waste concerns.[3]Marzia Dulal, “Sustainable E-Textiles: Biodegradable Wearables Reduce Waste,” TechXplore, techxplore.com
AI-enabled injury-prevention wearables adopted by elite sports leagues
Teams integrate multi-sensor modules with real-time biomechanics analytics to flag fatigue indicators before injuries occur, trimming player downtime by 26%. Premium budgets accelerate R&D that later migrates to consumer and clinical devices, extending the innovation runway for advanced sensor manufacturers.
Restraints Impact Analysis*
| RESTRAINTS | (~) % IMPACT ON CAGR FORECAST | GEOGRAPHIC RELEVANCE | IMPACT TIMELINE |
|---|---|---|---|
| EU MDR Class IIa SaMD Post-Market Surveillance Delays | -2.1% | Europe, with global impact for multinational manufacturers | Medium term (2-4 years) |
| Battery Energy-Density Limits in Ultra-Miniature Patches | -1.8% | Global | Long term (≥ 4 years) |
| PPG Accuracy Gaps on Dark Skin Tones—Recalls in Africa/Caribbean | -1.2% | Africa, Caribbean, with global reputational impact | Short term (≤ 2 years) |
| Data-Sovereignty Compliance Costs in Brazil and Colombia | -0.8% | Latin America, particularly Brazil and Colombia | Medium term (2-4 years) |
| Source: Mordor Intelligence | |||
EU MDR Class IIa SaMD post-market surveillance delays
Average clearance for analytical wearables rose from 7 to 19 months, lifting compliance expense 280% for startups. Many postpone EU launches or pivot to wellness labeling, slowing regional access to clinical-grade wearables and prompting consolidation as small firms seek scale to absorb regulatory overhead.
Battery energy-density limits in ultra-miniature patches
Commercial batteries plateau near 300 Wh/L, well below the 500 Wh/L needed for week-long multi-parameter monitoring in coin-cell footprints. Designers trade feature breadth for runtime, delaying form-factor migration from wrists to skin-tight patches. Incremental gains of 8-10% per year leave space for disruptive solid-state or on-body energy harvesting solutions.
*Our forecasts treat driver/restraint impacts as directional, not additive. The impact forecasts reflect baseline growth, mix effects, and variable interactions.
Segment Analysis
By Sensor Type: MEMS Dominates While Optics Accelerates
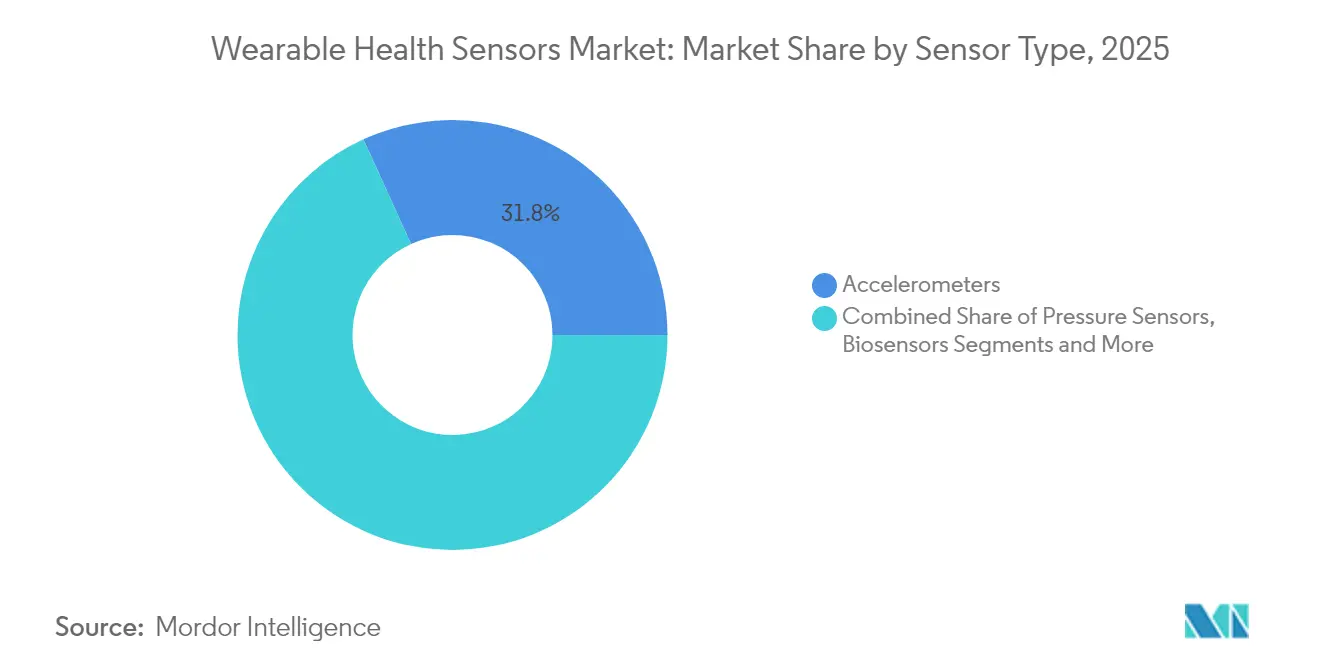
Accelerometers and inertial MEMS sensors command 31.80% of the market share in 2025, establishing themselves as the foundation of the wearable health sensors ecosystem due to their versatility in tracking movement patterns across multiple body locations. These sensors have evolved beyond simple step counting to enable sophisticated gait analysis and fall detection algorithms that are particularly valuable in elderly care applications. Optical/PPG sensors are projected to grow at the fastest rate of 15.28% from 2026-2031, driven by their expanding capabilities beyond heart rate monitoring to include blood oxygen saturation, blood pressure estimation, and even early-stage glucose monitoring applications. Temperature sensors have found renewed importance in continuous fever monitoring systems, while pressure sensors are increasingly deployed in smart footwear for diabetic foot ulcer prevention.
The integration of multiple sensor types within single devices represents a significant market evolution, with hybrid magnetic and optical sensor combinations showing particular promise for improved cardiovascular monitoring. Recent research from Vietnam National University demonstrates that combining these sensor types can overcome the limitations of optical sensors in detecting subtle cardiovascular abnormalities, potentially enabling earlier intervention for conditions like atrial fibrillation. Biosensors (electrochemical) are gaining traction in specialized applications like sweat analysis for hydration monitoring, while position and proximity sensors enable contextual awareness that improves the accuracy of other sensor readings by accounting for body position and movement artifacts.


By Body Placement: Wrist Dominance Challenged by Smart Textiles
Wrist-worn devices maintain their market leadership with 44.20% share in 2025, benefiting from consumer familiarity, established form factors, and the ability to house multiple sensor types in a single accessible location. The strategic advantage of this placement lies in its balance between user acceptance and sensor accuracy, with major players like Apple and Samsung leveraging their smartwatch platforms to introduce increasingly sophisticated health monitoring capabilities. Smart clothing and textiles are experiencing the fastest growth at 15.05% CAGR (2026-2031), as innovations in flexible electronics and conductive materials enable seamless integration of sensors into everyday garments without compromising comfort or washability.
Chest patches and skin-adhesive sensors are gaining prominence in clinical applications, offering continuous monitoring capabilities for patients with chronic conditions while maintaining a discreet profile. The University of British Columbia has developed a low-cost piezo-resistive sensor that can be embedded in textiles to monitor human movements, including heart rates and temperatures, and is washable and durable. Headgear and eyewear placements are finding specialized applications in neurological monitoring and augmented reality health interfaces, while footwear sensors provide unique insights into gait patterns and weight distribution that are particularly valuable for diabetic care and athletic performance analysis. The emerging category of implantable and ingestible sensors represents the frontier of the market, offering unprecedented monitoring precision but facing significant regulatory and user acceptance challenges.
By Application: Remote Monitoring Leads While Mental Health Accelerates
Remote patient monitoring and elderly care applications dominate the market with 38.10% share in 2025, reflecting the growing emphasis on aging-in-place solutions and the management of chronic conditions outside traditional healthcare settings. This application segment has benefited from healthcare system initiatives to reduce hospitalization costs, with remote monitoring demonstrating the ability to reduce hospital readmissions by up to 30% for chronic condition patients. Mental health and stress tracking applications are projected to grow at the fastest rate of 18.25% CAGR (2026-2031), as wearable sensors evolve beyond physical parameters to monitor physiological indicators of psychological states.
Chronic disease management applications, particularly for diabetes and cardiovascular conditions, represent a critical market segment where wearable sensors are increasingly integrated into standard care protocols. Recent innovations in this space include the direct pairing of the Apple Watch with the Dexcom G7 continuous glucose monitor, eliminating the need for smartphone intermediation and enhancing the user experience. Sports and fitness performance applications continue to drive consumer adoption, with elite sports organizations implementing sophisticated monitoring systems that track multiple physiological parameters to optimize training and prevent injuries. Worker safety and environmental exposure monitoring represent an emerging application area, particularly in industries with high heat stress risks, where wearable sensors can provide early warning of dangerous physiological conditions.
By End User: Consumer Dominance Shifting Toward Healthcare
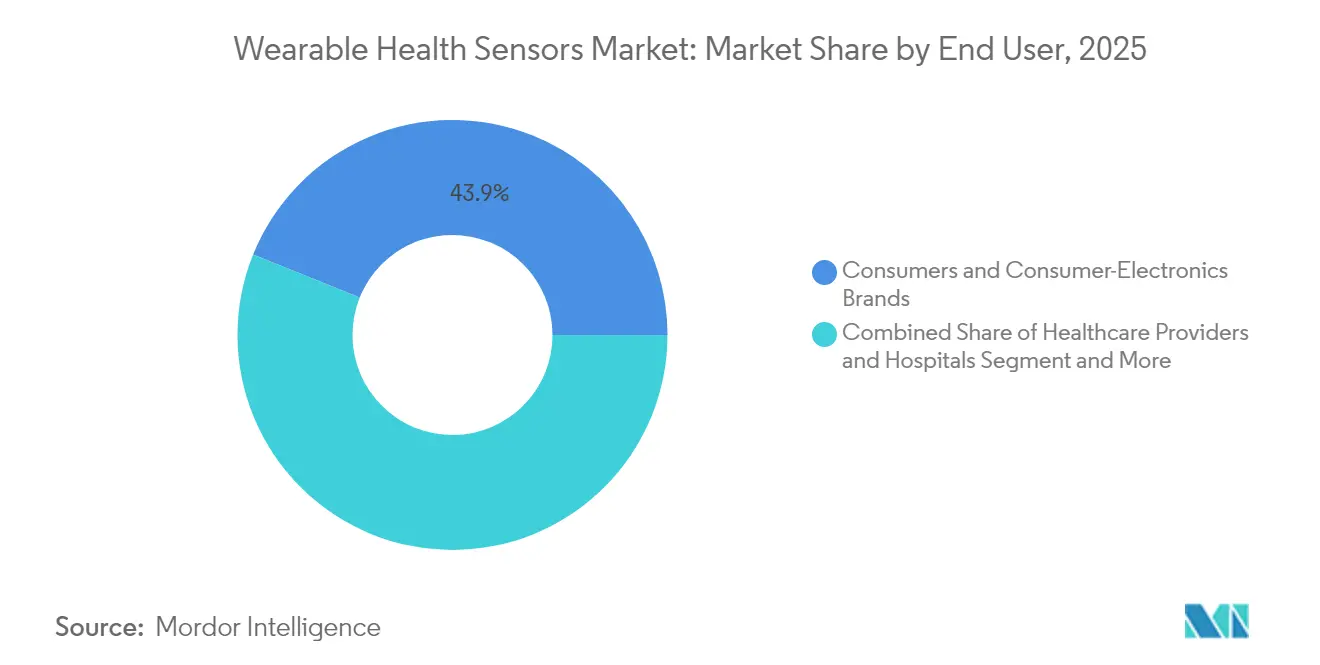
Consumers and consumer electronics brands account for 43.90% of the market share in 2025, reflecting the current dominance of fitness trackers and smartwatches in the wearable health sensors landscape. This segment benefits from established retail channels, consumer familiarity with wearable devices, and the integration of health monitoring features into mainstream consumer electronics products. The strategic significance of this segment extends beyond direct sales, as it serves as the primary channel for introducing new sensor technologies to the broader market before they migrate to specialized healthcare applications.
Home healthcare agencies are experiencing the most rapid growth at 25.10% CAGR (2026-2031), driven by the increasing shift toward home-based care delivery and the integration of remote monitoring into standard care protocols. This growth is supported by healthcare system initiatives to reduce hospitalization costs, with remote monitoring enabling earlier intervention for deteriorating conditions and reducing emergency department visits. A study by the Bipartisan Policy Center found that RPM services can reduce hospital readmissions by 38% for heart failure patients, creating a compelling economic case for adoption by home care providers. Healthcare providers and hospitals are increasingly implementing wearable sensor programs for post-discharge monitoring, while sports teams and fitness centers utilize advanced sensor systems for performance optimization and injury prevention. Military and first responder applications represent a specialized segment where environmental and physiological monitoring capabilities are integrated into existing equipment to enhance operational safety.
By Connectivity Technology: BLE Dominance with Cellular Growth
Bluetooth Low Energy (BLE) maintains its position as the dominant connectivity technology for wearable health sensors, offering an optimal balance between power efficiency and data transmission capabilities for most consumer applications. The strategic advantage of BLE lies in its universal smartphone compatibility, enabling wearable devices to leverage the processing power and connectivity of companion devices rather than incorporating these capabilities directly. Recent advancements in BLE security protocols, particularly LE Secure Connections using Elliptic Curve Diffie-Hellman (ECDH), have addressed previous vulnerabilities that limited adoption in sensitive healthcare applications.
Cellular connectivity, particularly LTE-M and NB-IoT, is gaining traction in applications requiring autonomous operation without smartphone tethering, such as elderly monitoring systems and remote patient care. This growth is supported by declining module costs and power consumption improvements that make cellular viable for a wider range of wearable form factors. Wi-Fi connectivity remains relevant for home-based applications where power constraints are less severe, while NFC/RFID technologies enable novel interaction models and passive sensing applications. Ultra-Wideband (UWB) technology is emerging as a significant innovation in the space, offering precise location tracking capabilities that enhance the contextual awareness of health monitoring systems, particularly in institutional settings where spatial information provides valuable clinical context.
Geography Analysis
North America led the wearable health sensors market with 38.20% revenue share in 2025. Widespread RPM reimbursement, high per-capita health spending, and ecosystem depth spur institutional demand. CMS allows providers to bill roughly USD 1,400 each year per monitored chronic patient, turning devices from consumer novelties into clinical assets. Canada expands telehealth to remote provinces, while Mexico’s social security system pilots diabetes CGM subsidies.
Asia-Pacific records the fastest 13.72% CAGR through 2031. China’s national screening budgets drive bulk procurement of continuous BP cuffs and glucose sensors, while local semiconductor fabricators scale optical chipsets. Japan’s super-aged society integrates fall and arrhythmia patch kits into community clinics. India’s middle class adopts mid-range fitness bands, and government primary-care centers test wearable vitals kiosks. South Korea leverages foundry expertise to supply MEMS and ASIC cores for global brands.
Europe contributes a significant slice yet faces MDR headwinds. Germany and France reimburse digital therapeutics that pass DiGA or PACTe portals, encouraging heart failure and COPD monitoring pilots. Printed-electronics hubs in Germany, the Netherlands, and the UK reduce patch cost, helping hospitals justify disposable sensors. However, MDR post-market rules slow Class IIa software deployments, leading several startups to prioritize United States release first. The Middle East accelerates adoption within oil and gas labor programs, while African uptake depends on addressing PPG accuracy in darker skin populations and connectivity gaps.

Regulatory Landscape
Wearable health sensors sit across a split regulatory perimeter, ranging from general wellness wearables to regulated medical devices and software. In the United States, the FDA framework (medical device oversight plus its General Wellness policy) shapes how consumer form factors can be marketed when they estimate physiologic parameters, while Medicare remote patient monitoring reimbursement remains a practical commercialization gate for prescription-grade deployments (the report base-year context highlights roughly USD 1,400 per monitored chronic patient per year in RPM billing). In Europe, the Medical Device Regulation (MDR) maintains a stricter, risk-based approach for clinical claims, and the report notes that MDR post-market surveillance requirements have extended clearance timelines and raised compliance costs for analytical wearables.
Standards and compliance expectations are tightening around accuracy, durability, interoperability, and quality systems, which affects sensor qualification and device validation cycles. Examples include IEC 63203-402-3:2024 for performance measurement and accuracy testing methods for heart rate wearables, ISO/IEEE 11073-10700:2024 for service-oriented device connectivity in clinical IT networks, and IEEE/UL 2933-2024 covering clinical IoT trust and interoperability principles. For textile-integrated sensing, the published amendment A1:2026 to IEC 63203-201-4 adds durability testing requirements for conductive textiles, reinforcing the need for repeatable wash and wear performance in smart clothing and e-textiles.
Value Chain Analysis
The wearable health sensors value chain spans upstream materials and components (MEMS inertial sensors, optical/PPG modules, temperature and pressure sensors, flexible substrates, conductive textiles), midstream integration (sensor fusion, packaging, power management, connectivity such as BLE and cellular modules), and downstream device platforms and services (smartwatches, patches, smart textiles, remote patient monitoring kits, and associated apps and cloud backends). Semiconductor suppliers and module integrators provide qualified sensor stacks, while OEMs and platform owners (consumer electronics brands and medical device companies) differentiate through industrial design, firmware, and clinical feature enablement; healthcare delivery channels then pull validated devices into RPM and chronic-care workflows.
The biggest bottlenecks increasingly show up in the midstream and downstream data and workflow layers rather than raw sensor availability, including normalization of inconsistent data formats, security controls for connected devices, and mapping sensor outputs into EHR-compatible structures for provider dashboards. This shift is reinforced by the growing role of model governance as part of the deliverable: device-plus-model systems and platform services raise switching costs and concentrate influence among players that control data pipelines, validation datasets, and update mechanisms. In parallel, advances in flexible and skin-adjacent form factors (printed patches, smart textiles, and adhesive electrodes) expand the chain to include printed electronics lines and textile testing/qualification, with durability and accuracy standards (such as the IEC 63203 family) shaping supplier selection and time-to-scale.
Competitive Landscape
Competition blends consumer electronics giants, medical device incumbents, semiconductor suppliers, and focused startups. Apple and Samsung wield platform stickiness and integrate silicon, software, and services, breaking ground on non-invasive glucose spectrometry. Dexcom partners with Apple for direct CGM-watch pairing, sidestepping smartphones and cementing cross-ecosystem utility. TE Connectivity and STMicroelectronics supply ultra-thin pressure and combo IMU sensors that shrink form factors for textile embedding.
Accuracy across all skin tones emerges as a differentiator. Valencell’s recalibrated PPG engines cut errors on Fitzpatrick Types V-VI by 68%, positioning the firm as a preferred module supplier for diversity-conscious payers. Regulatory capability also shapes rivalry; Medtronic’s strong compliance infrastructure speeds global launch of maternity CGM indications, whereas smaller innovators sometimes reclassify as wellness to dodge EU MDR.
Strategic capital flows focus on optical absorption spectroscopy and photothermal approaches for needle-free glucose assays. Venture funding hit USD 1.2 billion in 2024, drawing semiconductor fabs into co-development deals. Patent races in hybrid MEMS-optical stacks intensify, as combined sensor suites deliver redundancy that secures clinical accuracy and supports payer acceptance.
Wearable Health Sensors Industry Leaders
Apple Inc.
Alphabet Inc. (Fitbit)
STMicroelectronics N.V.
Analog Devices Inc.
Texas Instruments Inc.
- *Disclaimer: Major Players sorted in no particular order

Market Opportunities and Future Outlook
A near-term whitespace is opening between wellness-grade sensing and clinically anchored deployments where reimbursement and workflow integration pull demand toward prescription-grade wearables. The report highlights that U.S. RPM reimbursement economics are already converting devices into clinical assets (roughly USD 1,400 per monitored chronic patient per year in billing), and Europe is simultaneously navigating MDR overheads that steer some innovators toward wellness positioning or delayed EU launches. This creates room for companies that can package multi-parameter sensing (IMU plus optical/PPG plus temperature and pressure) with clear validation pathways and ready-to-deploy provider dashboards, particularly for remote patient monitoring, elderly care, and post-discharge monitoring where the report already shows leading application share.
Another opportunity is the infrastructure layer that makes wearable data usable at scale across brands, form factors, and care settings. The emergence of foundation-model approaches for wearable data, such as Google Researchs SensorFM trained on over one trillion minutes of multimodal sensor signals from five million participants across 100-plus countries, signals an industry move toward generalized physiological representations and more standardized downstream model adaptation. On the hardware side, the report narrative around printed flexible bio-patches and smart textiles aligns with new research directions for skin-compatible electrodes and long-wear ECG materials (for example, published work on painted skin electrodes and breathable hydrogel ECG interfaces), supporting product roadmaps that reduce irritation, improve adherence, and extend monitoring beyond wrist wear into patches and garments. These shifts put interoperability, cybersecurity, and durability standards at the center of commercial execution, especially for smart textiles and cross-platform RPM programs.
Recent Industry Developments
- May 2026: Google launched Fitbit Air, a screenless wearable tracker positioned around continuous sensing, including 24/7 heart rate and SpO2 monitoring along with atrial fibrillation-related capabilities. The release raises competitive intensity in always-on, lower-friction form factors where battery life and comfort support higher adherence for longitudinal monitoring. It also strengthens Googles health data ecosystem strategy by expanding the volume and continuity of sensor streams available for coaching and analytics.
- December 2025: Apple expanded hypertension notifications availability to Saudi Arabia for Apple Watch users. The move extends a clinically adjacent feature into additional regulated markets, highlighting how regional authorization and rollout sequencing can shape feature monetization and user acquisition. It also reinforces the role of optical sensing and algorithms as a platform differentiator for smartwatch-based health monitoring.
- March 2024: Analog Devices received U.S. FDA 510(k) clearance and announced commercial launch for the Sensinel Cardiopulmonary Management (CPM) System, a non-invasive wearable aimed at remote chronic disease management. The clearance supports broader provider adoption by reducing regulatory friction for clinical deployment versus wellness-only wearables. It also illustrates how component and electronics players are moving upstream into complete, regulated monitoring systems tied to remote care pathways.


Research Methodology Framework and Report Scope
Market Definition and Coverage
For this study, the wearable health sensors market covers sensors used in wearable form factors to measure and track human health signals, and the related sensor value sold into these wearable devices across regions.
Scope exclusions: We exclude non-wearable medical sensors used only in hospital equipment and general consumer sensors that are not used for health tracking.
Segmentation Overview
- By Sensor Type
- Pressure Sensors
- Temperature Sensors
- Accelerometers / Inertial MEMS
- Optical / PPG Sensors
- Biosensors (Electro-chemical)
- Gyroscopes and Magnetometers
- Position and Proximity Sensors
- Others
- By Body Placement / Form Factor
- Wrist-wear
- Headgear and Eyewear
- Chest Patches and Skin-Adhesive
- Footwear and In-Shoe
- Smart Clothing / Textiles
- Implantable and Ingestible Sensors
- By Application
- Vital-Signs Monitoring
- Chronic-Disease Management (Diabetes, CVD)
- Sports and Fitness Performance
- Remote Patient Monitoring and Elderly Care
- Mental-Health and Stress Tracking
- Worker Safety and Environmental Exposure
- By End User
- Healthcare Providers and Hospitals
- Consumers and Consumer-Electronics Brands
- Sports Teams / Fitness Centers
- Military and First Responders
- Home-care Agencies
- By Connectivity Technology
- Bluetooth / BLE
- Wi-Fi
- NFC / RFID
- Cellular (LTE-M / NB-IoT)
- Ultra-Wideband (UWB)
- By Geography
- North America
- United States
- Canada
- Mexico
- South America
- Brazil
- Argentina
- Rest of South America
- Europe
- Nordics
- Sweden
- Norway
- Denmark
- Finland
- Western Europe
- Germany
- United Kingdom
- France
- Italy
- Spain
- Netherlands
- Eastern Europe
- Poland
- Russia
- Rest of Eastern Europe
- Nordics
- Middle East
- GCC (Saudi Arabia, UAE, Qatar, Kuwait, Bahrain, Oman)
- Turkey
- Rest of Middle East
- Africa
- South Africa
- Nigeria
- Kenya
- Rest of Africa
- Asia-Pacific
- China
- Japan
- India
- South Korea
- ASEAN (Indonesia, Malaysia, Thailand, Vietnam, Philippines, Singapore)
- Rest of Asia-Pacific
- North America
Data Sources, Market Sizing, and Validation
Desk Research
Desk research was used to map the value chain and set realistic bounds for adoption and pricing before interviews were run. We relied on public sources such as the World Health Organization for noncommunicable disease indicators, the US FDA and the European Commission for device and sensor related guidance, and sources such as the International Telecommunication Union for connectivity penetration that supports data sharing features.
To convert these signals into usable sizing inputs, we also reviewed company annual reports, investor presentations, regulatory databases, and credible press coverage for product launches and feature shifts (for example, ECG, SpO2, skin temperature, and continuous monitoring claims). Patent databases and a paid subscription for company financials and news were used selectively to cross-check timelines, sensor bill-of-material direction, and regional commercialization patterns. The sources listed here are illustrative only, and many other public and paid references were also used for data collection, validation, and clarification.
Primary Interviews and Surveys
Primary work was used to confirm what portion of wearable device shipments actually carry health sensing features, and how those features translate into sensor value rather than device value. We spoke with a mix of sensor ecosystem participants, channel and distribution contacts, and healthcare or wellness focused practitioners across APAC, EMEA, and the Americas, so gaps from desk findings could be closed and the final assumptions stress-tested.
Distribution of primary research fieldwork respondents
| Company type | Respondent position | Region |
|---|---|---|
| Top tier: 26% | CXOs: 13% | APAC: 46% |
| Mid tier: 59% | Functional/Unit leaders: 28% | EMEA: 29% |
| Smaller Players: 15% | Managers: 59% | Americas: 25% |
Market-Sizing & Forecasting
Sizing starts from a top-down demand pool build that reconstructs wearable units by region, then applies health-sensor attach rates by major form factors, followed by an average sensor value per enabled device. The totals are corroborated with selective bottom-up checks, where we sample supplier-side revenue exposure, validate channel mix, and test implied ASP times volume against what interviewees see in procurement and product teardowns.
A few of the key inputs used in the model include wearable shipment trend direction, the mix shift toward health tracking features (such as SpO2, ECG, temperature, and motion sensing), replacement cycle patterns, sensor content per device, and regional pricing differences driven by feature tiering. Where country-level information is thin, we bridge gaps using proxy indicators like smartphone penetration, reimbursed remote monitoring maturity, and the installed base split between basic trackers and advanced smartwatches.
For forecasting, we use scenario analysis supported by simple multivariate regression checks so the outlook responds to feature adoption speed, ASP progression, and regulatory or reimbursement pushes. Assumptions are kept auditable, so a reader can trace each step from unit base, to attach rate, to sensor value, and finally to the regional roll-up.
Data Validation & Update Cycle
Each model run is checked against independent signals like wearable shipment narratives, reported product mix changes, and the timing of new health features coming to mass-market models. When a region or year shows an unexpected jump, we recheck currency conversions, ASP direction, and attach rate logic, then revisit the assumption with a second internal review.
We refresh the report annually, and interim updates are made when material events occur, such as a major regulatory change or a sharp pricing shift in high-volume wearable categories. Before delivery, the latest public updates are reviewed again so clients receive a current view that matches the most recent market conditions.
Mordor Intelligence's Global Wearable Health Sensors Market Market Size Compared With Other Published Estimates
Published numbers for wearable health sensors often do not match because the counted value can switch between sensor content, full device revenue, or broader digital health add-ons. Differences also show up when one estimate uses shipment-led sizing and another uses spending-led sizing, which changes how replacement cycles and regional mix are treated.
A large spread is usually created by update timing and price logic, since fast-moving wearable categories can see meaningful quarterly shifts in feature mix and implied sensor ASPs across regions. In our refresh-led approach, currency timing and ASP updates are rechecked around major launch windows, followed by a variance review against attach rate signals and shipment direction. This is why the January 2026 refresh on the Mordor Intelligence page can land differently than older snapshots.
Benchmark comparison
| Source | Market Size | Gaps in Research Methodology |
|---|---|---|
| Mordor Intelligence | USD 2.09 B (2026) | |
| Global Consultancy A | USD 2.90 B (2022) | Uses an earlier base year and often blends wearable device revenue with sensor value, which can inflate totals when premium smartwatch pricing is treated as sensor-led growth. |
| Industry Publisher B | USD 2.50 B (2023) | Uses a broad definition of wearable health sensing devices and applies a steadier ASP curve over time, which can miss sharp feature-driven pricing changes and regional mix shifts. |
The table shows that even when the same market name is used, the outcome changes based on what is counted and how prices are updated over time. By keeping the unit base, attach rates, and sensor ASP steps explicit, the final number stays traceable, and it can be re-run consistently when new shipment and feature signals appear.


Key Questions Answered in the Report
How large is the wearable health sensors market in 2026 and how fast will it grow?
The market stands at USD 2.09 billion in 2026 and is projected to expand to USD 4.16 billion by 2031, reflecting a 14.78% CAGR.
Which sensor category is growing the fastest?
Optical/PPG sensors grow at a 15.28% CAGR between 2026 and 2031 as algorithms unlock new parameters such as blood pressure and early glucose signals.
Why is Asia-Pacific the fastest-growing region?
Government-funded chronic disease screening, rising healthcare spending, and local semiconductor capacity drive a 13.72% CAGR in Asia-Pacific.
What reimbursement policies support adoption in North America?
U.S. Medicare RPM codes allow billing of roughly USD 1,400 per patient per year for remote monitoring, accelerating prescription-grade wearable rollout.
What technical hurdle limits ultra-miniature patches?
Battery energy density remains near 300 Wh/L, below the 500 Wh/L needed for week-long multi-parameter sensing, constraining smaller form factors.
How are companies addressing accuracy gaps on darker skin tones?
Module suppliers recalibrate optical paths and multi-wavelength LEDs; Valencell’s latest PPG engine cuts error rates by 68% on Fitzpatrick Types V-VI.
Page last updated on:






