Market Overview
| Study Period | 2021 - 2031 |
|---|---|
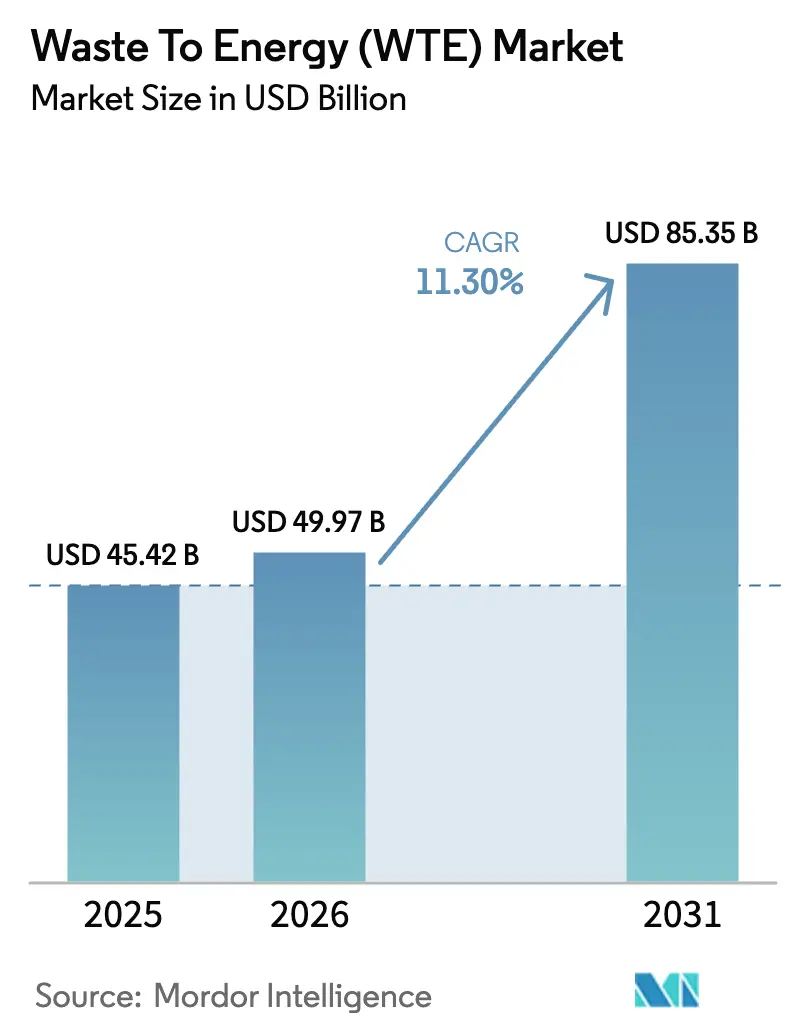
| Market Size (2026) | USD 49.97 Billion |
| Market Size (2031) | USD 85.35 Billion |
| Growth Rate (2026 - 2031) | 11.30% CAGR |
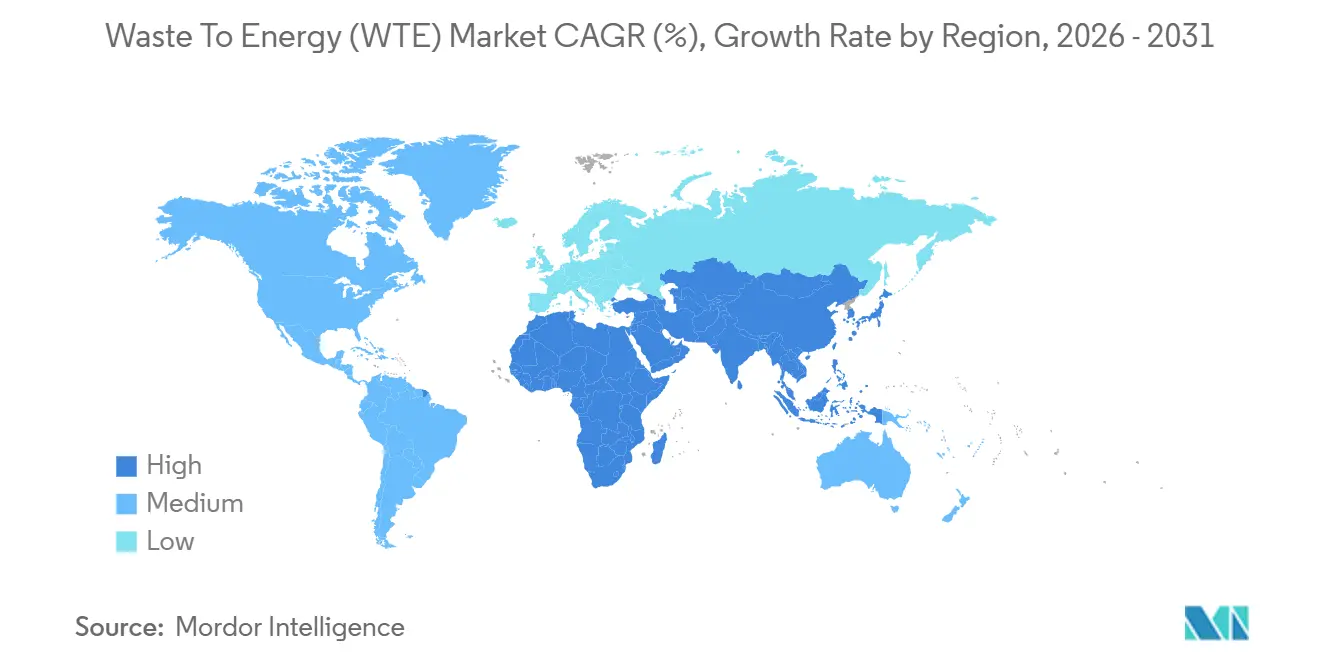
| Fastest Growing Market | Asia Pacific |
| Largest Market | Asia Pacific |
| Market Concentration | Medium |
Major Players *Disclaimer: Major Players sorted in no particular order Image © Mordor Intelligence. Reuse requires attribution under CC BY 4.0. | |
Waste To Energy (WTE) Market Analysis by Mordor Intelligence
The Waste To Energy Market is expected to grow from USD 45.42 billion in 2025 to USD 49.97 billion in 2026 and is forecasted to reach USD 85.35 billion by 2031 at 11.30% CAGR over 2026-2031.
Landfill-diversion mandates, carbon-credit upside, and technology upgrades are strengthening project economics, while public-private partnership structures accelerate financial close. Circular-economy agendas in Europe, Asia, and North America are nudging utilities to replace aging incinerators with high-efficiency gasification and biological plants that monetize metals, heat, and biofuels. Rising emissions-trading prices in South Korea, Sweden, and Canada are improving internal rates of return relative to solar or wind, prompting independent power producers to re-enter the procurement pipeline. Concurrently, corporate power-purchase agreements for biomethane in the Nordics and bio-liquefied natural gas bunkering contracts in Europe are underwriting long-term offtake, mitigating merchant-price risk, and deepening liquidity in the waste to energy market.
Key Report Takeaways
- By technology, incineration and combustion led with 65.1% waste to energy market share in 2025; plasma-arc gasification is projected to advance at a 16.6% CAGR through 2031.
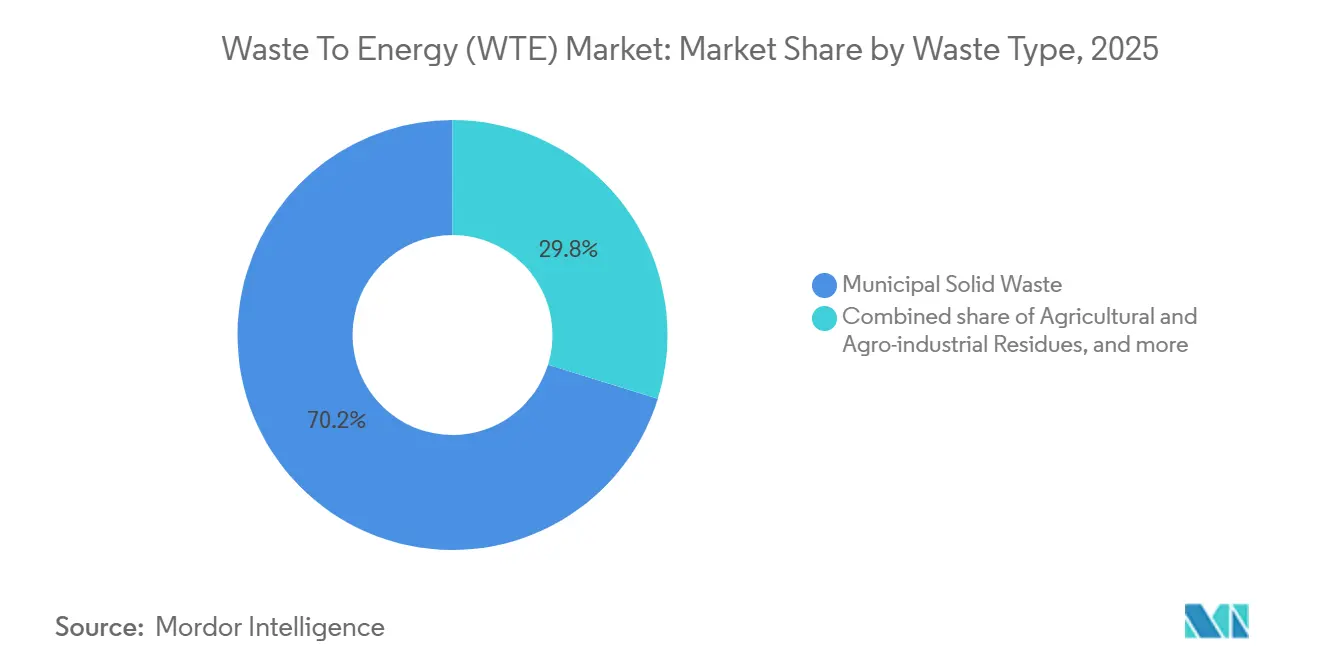
- By waste type, municipal solid waste accounted for 70.2% of feedstock in 2025 in waste to energy market, while agricultural residues are forecast to expand at a 14.4% CAGR on the back of Brazil’s and Vietnam’s biogas and pelletization mandates.
- By energy output, electricity generation held 55.3% of revenue in 2025 in waste to energy market; transport fuels are set to grow at a 17.3% CAGR as fleet operators in Europe and North America lock in Scope 3-aligned offtake.
- By end-user, utilities and independent power producers captured 60.2% of demand in 2025 within the waste to energy industry, whereas transport-fuel distributors represent the fastest trajectory at 17.2% CAGR through 2031.
- By geography, Asia-Pacific dominated with 45.1% share in 2025 in waste to energy industry and remains the quickest-expanding region at a 13.0% CAGR to 2031, buoyed by China’s 14th Five-Year Plan capacity targets and India’s landfill-ban time line.
Note: Market size and forecast figures in this report are generated using Mordor Intelligence’s proprietary estimation framework, updated with the latest available data and insights as of January 2026.
Global Waste To Energy (WTE) Market Trends and Insights
Drivers Impact Analysis*
| Driver | (~) % Impact on CAGR Forecast | Geographic Relevance | Impact Timeline |
|---|---|---|---|
| Rapid roll-out of EfW public-private partnership pipelines in China's Greater Bay Area | +1.8% | China, spill-over to ASEAN markets | Medium term (2-4 years) |
| EU Green Taxonomy incentives accelerating retrofit of legacy incineration fleets | +1.5% | European Union, particularly Germany, France, Nordic countries | Short term (≤ 2 years) |
| National bans on unsegregated landfill triggering MSW diversion in India's Tier-2 cities | +1.2% | India, with early gains in Indore, Surat, Pune | Medium term (2-4 years) |
| Soaring carbon credit prices improving WTE project IRRs in South Korea | +0.9% | South Korea, potential adoption in Japan | Short term (≤ 2 years) |
| Circular-economy led corporate power-purchase agreements for biogas in Nordics | +0.7% | Nordic countries (Sweden, Finland, Norway, Denmark) | Long term (≥ 4 years) |
| Mandatory calorific value thresholds for RDF exports in the UK post-Brexit | +0.6% | United Kingdom, affecting EU import markets | Short term (≤ 2 years) |
| Source: Mordor Intelligence | |||
Rapid Roll-Out of EfW Public-Private Partnership Pipelines in China’s Greater Bay Area
Provincial authorities earmarked CNY 45 billion between 2024 and 2027 to create 120,000 tonnes per day of new capacity backed by 25-year revenue guarantees that de-risk private capital.[1]National Development and Reform Commission, “Greater Bay Area Development Plan,” ndrc.gov.cn Bottom-ash recycling revenues add 8%-12% to cash flow, while stricter source-segregation rules have lifted lower-heating values to 2,400 kcal/kg, increasing net generation per tonne by 22%. The template is expanding to the Yangtze River Delta and Chengdu-Chongqing Economic Circle, where fourteen additional concessions reached financial close in 2025. Volume certainty and feedstock quality are shortening debt-service coverage break-evens from seven to five years. International lenders view the standardized concession model as bankable, unlocking multi-currency financing that amplifies the waste to energy market deal flow.
EU Green Taxonomy Incentives Accelerating Retrofit of Legacy Incineration Fleets
Delegated Regulation 2024/1214 re-tagged high-efficiency retrofits as sustainable investments, opening EUR 2.8 billion of green-bond proceeds for forty-seven plants in 2025.[2]European Commission, “Delegated Regulation 2024/1214,” ec.europa.eu Weighted average costs of capital dropped 120 basis points, pushing payback on flue-gas cleaning and heat-recovery upgrades below seven years. MVV Energie’s EUR 300 million bond financed a condensing economizer that elevates thermal efficiency to 68%, delivering district heat to 45,000 households. Co-firing incentives for refuse-derived fuel in cement kilns reduce coal demand by 420,000 tonnes annually, widening the waste to energy market valorization pathways.
National Bans on Unsegregated Landfill Triggering MSW Diversion in India’s Tier-2 Cities
The April 2024 amendment to India’s Solid Waste Management Rules bars mixed-waste landfilling in cities above 100,000 population by January 2026.[3]Ministry of Environment, Forest and Climate Change, “Solid Waste Management Rules Amendment 2024,” moefcc.in Twenty-two concessions totaling 14,500 tonnes per day closed between mid-2024 and early 2026, using viability-gap funding up to 40% of capex. Indore’s 600-tonnes-per-day biomethanation plant supplies compressed natural gas for 240 municipal buses, displacing 4.2 million liters of diesel each year. Mandatory ISO 14001 certification raised entry barriers, consolidating waste to energy market competition among technology-qualified EPC firms.
Soaring Carbon-Credit Prices Improving WTE Project IRRs in South Korea
Emissions-trading allowances jumped from KRW 18,000 to KRW 28,000 per tonne CO₂e between 2024 and early 2026, boosting avoided-emissions revenue to KRW 42/kWh and lifting equity IRRs by 180 basis points.[4]Korea Exchange, “KETS Allowance Price Data 2024-2026,” koreaexchange.com Seoul’s Mapo upgrade generates 185,000 tonnes CO₂e credits annually, adding KRW 5.2 billion to cash flows. Independent power producers are re-entering municipal tenders, expanding the waste to energy market footprint beyond legacy utilities.
Restraints Impact Analysis*
| Restraint | (~) % Impact on CAGR Forecast | Geographic Relevance | Impact Timeline |
|---|---|---|---|
| Stricter dioxin emission caps postponing permits for grate-furnace refurbishments in Germany | -0.8% | Germany, potential adoption in Austria, Netherlands | Short term (≤ 2 years) |
| Limited tipping-fee escalation clauses hurting project bankability in Indonesia | -0.6% | Indonesia, similar risks in Philippines, Vietnam | Medium term (2-4 years) |
| Anaerobic-digestion feedstock price volatility undermining margins in Brazil | -0.5% | Brazil, Argentina, Colombia | Medium term (2-4 years) |
| Community push-back against plasma-arc facilities in Australia's peri-urban regions | -0.4% | Australia, emerging in New Zealand | Long term (≥ 4 years) |
| Source: Mordor Intelligence | |||
Stricter Dioxin-Emission Caps Postponing Permits for Grate-Furnace Refurbishments in Germany
Germany’s July 2024 ordinance halved the dioxin limit to 0.05 ng/m³, obliging EUR 8-15 million retrofits per 100,000 tpy plant. Twenty-three facilities had permit renewals deferred in 2025, idling 1.2 million tpy and forcing exports to the Netherlands at GBP 35 per tonne. Mid-sized municipal utilities deferred upgrades, while large integrated operators such as Veolia absorbed contracts, capturing premium tipping fees. Austria signaled adoption of the stricter cap by 2027, front-loading EUR 110 million of planned capital expenditure, and constraining near-term growth in the waste to energy market.
Limited Tipping-Fee Escalation Clauses Hurting Project Bankability in Indonesia
Concessions signed before 2023 locked fees at IDR 250,000/tonne for fifteen years without inflation linkage. Real revenues eroded 18% amid 4.2% annual inflation, pushing Jakarta’s Bantar Gebang plant’s debt-coverage ratio to 1.08, below the 1.2 covenant. International developers withdrew from Surabaya and Bandung tenders unless clauses were indexed to CPI. Revised procurement guidelines now allow 2.5% caps, restoring 80-bp IRR yet still trailing regional precedents. Technology upgrades such as advanced flue-gas treatment remain sidelined, dampening the waste to energy market technology-mix evolution.
*Our forecasts treat driver/restraint impacts as directional, not additive. The impact forecasts reflect baseline growth, mix effects, and variable interactions.
Segment Analysis
By Technology: Plasma-Arc Gains Traction Despite Incineration Dominance
Incineration anchored 65.1% of the waste to energy market in 2025, reflecting the lower capital intensity of USD 450,000–650,000 per tonne-per-day capacity. In contrast, plasma-arc gasification, with capex north of USD 850,000 per tonne-per-day, is scaling because municipalities prize 98% volume reduction and vitrified slag suitable for aggregates. Seoul’s pilot plant demonstrated KRW 85,000-per-tonne landfill-avoidance savings, quickening payback for plasma retrofits. Retrofitting bottom-ash plasma torches at three U.S. facilities will recover 12% more ferrous metals and cut landfill costs by USD 18/tonne.
Gasification projects in Japan convert municipal solid waste to syngas, hitting electrical efficiencies up to 32% against 22% for grate incineration. Biological routes thrive in organic-rich geographies; India commissioned 3,200 tpd biomethanation in 2025 for compressed natural gas fleets. Mechanical-biological treatment (MBT) plants in the United Kingdom processed 4.8 million tonnes in 2025, raising calorific value for refuse-derived fuel exports by 14%. Technology selection now hinges on local emission caps, carbon-credit upside, and feedstock composition, collectively widening the Waste to Energy (WTE) market’s technology palette.
By Waste Type: Agricultural Residues Emerge as High-Growth Feedstock
Municipal solid waste comprised 70.2% of input volumes in 2025 in the waste to energy industry, yet agricultural residues will post a 14.4% CAGR through 2031 as Brazil’s sugar-bagasse biogas mandates and Vietnam’s rice-husk pelletization gain scale. Industrial waste delivers steady volumes in the waste-to-energy sector, especially from electronics and automotive plants seeking closed-loop plastics and metal recovery. Sewage sludge digestion accelerated in the waste-to-energy industry in Europe after the revised Urban Wastewater Directive, adding 112 digesters in 2025.
Construction-and-demolition streams are pre-treated to extract high-calorific fractions for MBT plants in the Netherlands, where 1.1 million tonnes of combustible material replaced coal in cement kilns. Hazardous-waste capacity rose in China to 680,000 tonnes in 2025, generating 420 GWh of electricity from medical and electronic residues. Feedstock logistics remain a brake; dispersed crop-residue collection costs of USD 25–40/tonne confine commercial radii to 50 km, driving consolidation around high-yield farm belts and influencing the waste to energy market spatial clustering.


By Energy Output: Transport Fuels Capture Fleet-Decarbonization Demand
Electricity accounted for 55.3% of 2025 revenue, yet curtailment in renewables-rich grids is nudging developers toward bio-synthetic natural gas, bio-liquefied natural gas, and cellulosic ethanol, which are forecast to outpace the wider waste to energy market at 17.3% CAGR. Enerkem’s Rotterdam plant illustrates scale feasibility, converting 360,000 tpy waste into 175 million m³ pipeline-grade gas and unlocking EUR 28 million of fuel credits.
Combined heat and power (CHP) remains attractive in district-heating economies; Denmark sourced 18% of network heat from waste-to-energy plants in 2025, cutting household tariffs by 12%. Heat-only solutions are niche but profitable in industrial parks; BASF’s Ludwigshafen plant supplies 420 GWh of steam annually, avoiding grid demand charges. Marine bunkering in the Nordics illustrates new offtake verticals, with 85,000 tonnes of bio-liquefied natural gas displacing sulfur-heavy marine diesel.
By End-User: Transport-Fuel Distributors Drive Renewable-Gas Adoption
Utilities and independent power producers captured 60.2% of 2025 demand but face softer growth amid grid-integration and price-volatility concerns. Transport-fuel distributors, backed by Renewable Energy Directive III and U.S. Renewable Fuel Standard credits, will grow 17.2% CAGR to 2031, the sharpest climb in the waste to energy market. Scania’s decade-long bio-liquefied natural-gas offtake secures 120 million m³ annually, trimming well-to-wheel CO₂ emissions by 85%.
Industrial captive plants intensify investment to hedge volatile gas prices; Siam Cement’s 150,000 tpy refuse-derived fuel boiler now offsets 22% natural-gas use. District-heating operators benefited from Denmark’s heat-tax exemption, saving DKK 420 million and adding 90,000 households in 2025. Exclusion of energy-from-waste in the United Kingdom’s 2025 Contracts for Difference round rerouted funding to Scottish auctions, where GBP 180 million supported 420,000 tpy of new capacity.

Geography Analysis
Asia-Pacific’s 45.1% share in 2025 crowns it the largest regional block of the waste to energy market; the region is tracking a robust 13.0% CAGR to 2031 as China’s 800,000 t-per-day capacity targets and India’s landfill-ban deadlines reach execution. China’s Greater Bay Area concession model, boasting CNY 45 billion funding and 25-year feedstock guarantees, lowered debt-service risk and may migrate to ASEAN, where Vietnam and Thailand closed eleven concessions in 2025. India’s Tier-2 cities added 14,500 t-per-day via viability-gap funding, with biomethanation replacing diesel in municipal fleets. Japan’s approval of eight syngas-gasification projects and South Korea’s KRW 28,000-per-tonne carbon allowance underscore the policy-tailwind narrative.
Europe’s waste to energy market momentum pivots on retrofit economics. The EU Green Taxonomy spurred EUR 2.8 billion in green-bond activity, yet Germany’s tighter dioxin cap idled 1.2 million t-per-year, curbing near-term throughput. Nordic corporate biogas PPAs totaled 1.8 TWh in 2025, boosting biomethane investment. The United Kingdom’s QP-RDF calorific-value floor imposed GBP 78 million in sorting upgrades, raising export fuel quality and tightening domestic supply.
North America’s build-out depends on U.S. D3 cellulosic credits that lifted project IRRs 12-15%, catalyzing six plants totaling 720,000 tpy. Canada’s CAD 80-per-tonne carbon price made waste-to-energy competitive, yielding projects in Ontario and British Columbia. Latin America’s traction centers on Brazil’s biomethane purchase mandate, the first of its kind in the region, guaranteeing floor prices that improve feedstock contracts.
The Middle East and Africa are emerging but strategic; the 300,000 t-per-year Sharjah plant is the region’s largest, while Saudi Arabia’s 2,400 t-per-day concessions underpin Vision 2030 waste-diversion targets. South Africa’s tariff of ZAR 1.80/kWh under REIPPP unlocked three urban plants, and Egypt’s EUR 420 million MoU with the EBRD signals growing multilateral appetite.

Competitive Landscape
The top-ten players held about 38% of installed capacity in 2025, indicating moderate concentration in the waste to energy market. Integrated conglomerates such as Veolia, Suez, and Waste Management bundle collection with thermal treatment to secure feedstock and energy-sale margins. Technology licensors such as Hitachi Zosen and Mitsubishi Heavy Industries capitalize on municipalities’ preference for proven performance guarantees. Covanta’s tie-up with Advanced Plasma Power exemplifies horizontal diversification into high-temperature slag-forming solutions, enhancing metal recovery and lowering disposal costs.
First-mover advantages accrue to bio-liquefied natural gas innovators; Enerkem’s gas-to-methane patents filed since 2023 support scale-up at its 360,000 tpy Rotterdam plant. Modular gasification vendors such as VINCI Construction are addressing sub-50,000-population municipalities, offering 20-t-per-day units that cost one-fifth of conventional installations. Digital carbon-tracking via blockchain debuted in China Everbright’s portfolio, allowing 18% premium voluntary-carbon prices and sharpening competitive positioning in the waste to energy industry.
District-heating markets are increasingly contested. Fortum lowered tariffs by 8% by co-firing refuse-derived fuel, adding 14,000 connections in Finland, while German and Danish operators respond with efficiency retrofits. Tender criteria now emphasize ISO 14001 and EN 15359 certification; 82% of European municipal bids in 2025 went to operators holding both accreditations, raising the stakes for smaller entrants. M&A remains active; Veolia’s January 2026 purchase of three Baden-Württemberg concessions consolidated feedstock under compliant plants, elevating tipping-fee yields 18%.
Waste To Energy (WTE) Industry Leaders
Veolia Environnement SA
Waste Management Inc.
Suez SA
Covanta Holding Corp.
China Everbright Environment Group
- *Disclaimer: Major Players sorted in no particular order

Recent Industry Developments
- November 2025: In a bid to combat waste and enhance tourism, Indonesia unveiled its blueprint to kick off construction on seven waste-to-energy (WTE) power plants in 2026. This initiative is a stepping stone towards the nation's ambitious target of establishing 33 such facilities by 2029. Key locations for these projects include Greater Jakarta, Denpasar, Medan, and Semarang, all backed by funding from the Danantara sovereign wealth fund.
- November 2025: JFE Engineering has completed a small-scale facility that utilizes gasification for both Waste-to-Energy (WtE) and next-generation Waste-to-Chemical (WtC) production. By merging their established WtE technology with innovative WtC processes, JFE Engineering is now offering a dual-pillar solution.
- June 2025: In a bid to tackle rising waste management challenges and reduce reliance on distant cement plants, the Lucknow Municipal Corporation (LMC) unveiled plans for a 15 MW Waste-to-Energy (WtE) plant in Shivri.
- March 2025: Iraq commenced construction on its inaugural major waste-to-energy (WTE) facility in Baghdad. This significant project, valued at USD 500 million and spearheaded by China's SUS Environment, aims to process 3,000 tons of waste daily. The facility is set to generate 100MW of electricity, curtail reliance on landfills, and produce green energy for the capital.


Research Methodology Framework and Report Scope
Market Definitions and Key Coverage
Our study defines the global waste-to-energy market as revenue generated from new facilities that thermally, physically, or biologically convert municipal solid waste, industrial residues, or sewage sludge into usable electricity, heat, combined heat and power, or transport fuels.
Scope Exclusion: Projects whose only output is landfill gas that is later upgraded off-site are not covered.
Segmentation Overview
- By Technology
- Physical (Refuse-Derived Fuel, Mechanical Biological Treatment)
- Thermal (Incineration/Combustion, Gasification, Pyrolysis and Plasma-Arc)
- Biological (Anaerobic Digestion, Fermentation)
- By Waste Type
- Municipal Solid Waste
- Industrial Waste
- Agricultural and Agro-industrial Residues
- Sewage Sludge
- Others (Commercial, Construction, Hazardous)
- By Energy Output
- Electricity
- Heat
- Combined Heat and Power (CHP)
- Transportation Fuels (Bio-SNG, Bio-LNG, Ethanol)
- By End-user
- Utilities and Independent Power Producers (IPPs)
- Industrial Captive Plants
- District Heating Operators
- Transport Fuel Distributors
- By Geography
- North America
- United States
- Canada
- Mexico
- Europe
- United Kingdom
- Germany
- France
- Spain
- Nordic Countries
- Russia
- Rest of Europe
- Asia-Pacific
- China
- India
- Japan
- South Korea
- ASEAN Countries
- Rest of Asia-Pacific
- South America
- Brazil
- Argentina
- Colombia
- Rest of South America
- Middle East and Africa
- United Arab Emirates
- Saudi Arabia
- South Africa
- Egypt
- Rest of Middle East and Africa
- North America
Detailed Research Methodology and Data Validation
Primary Research
We speak with plant developers, technology licensors, utility planners, and municipal waste officers across Asia-Pacific, Europe, and North America. These conversations help us confirm capacity factors, tipping fee escalation clauses, and discount rates that rarely appear in print and highlight policy shifts before they surface in statistics.
Desk Research
We start by extracting generation volumes, calorific values, and tariff benchmarks from open datasets maintained by the International Renewable Energy Agency, Eurostat, the US Energy Information Administration, and Japan's Ministry of the Environment. Our team then reviews trade statistics from UN Comtrade and equipment shipment logs collated by Volza to trace cross-border plant deliveries and component costs.
Next, patent records accessed through Questel signal emerging gasification designs, while annual reports, municipal tender notices, and news archived in Dow Jones Factiva let us map capital outlays and operating hours for each technology stream. The sources listed are illustrative; many additional public records were checked to collect, validate, and clarify data.
Market-Sizing and Forecasting
A top-down build traces national waste generation, applies documented collection rates, and aligns conversion yields to size the addressable energy pool, which we then cross-check through selective bottom-up roll-ups of operating plants multiplied by sampled average selling prices. Core variables include per capita waste growth, lower heating value, capacity factor, reference electricity tariff, and carbon credit incentives. Five-year forecasts use multivariate regression tied to permitted project pipelines and tariff step-downs; this is where Mordor Intelligence differentiates by blending thermal, physical, and biological routes within one consistent frame.
Data Validation and Update Cycle
Model outputs pass three analyst reviews and variance checks against independent price and volume signals. Reports refresh annually, with interim sweeps triggered when material policy or project announcements arise.
Why Mordor's Waste-to-Energy Baseline Commands Reliability
Published estimates often diverge because firms choose different waste streams, pricing dates, and escalation paths.
Key gap drivers here include contrasting scope choices, currency year alignment, and assumed capacity factors.
Benchmark comparison
| Market Size | Anonymized source | Primary gap driver |
|---|---|---|
| USD 45.42 B (2025) | Mordor Intelligence | - |
| USD 45.60 B (2025) | Global Consultancy A | Excludes biological pathways, uses 2024 tariff deck |
| USD 42.40 B (2024) | Trade Journal B | Applies static waste growth and omits Asia subsidy stack |
The comparison shows our disciplined variable selection, yearly refresh cycle, and transparent assumptions give decision-makers a balanced, traceable baseline.


Key Questions Answered in the Report
How large is the global Waste to Energy (WTE) market in 2026?
The Waste to Energy (WTE) market size stands at USD 49.97 billion in 2026 and is projected to grow at an 11.3% CAGR to 2031.
Which region leads in installed Waste to Energy (WTE) capacity?
Asia-Pacific holds 45.1% of installed capacity and is forecast to expand at a 13.0% CAGR through 2031.
What technology is gaining momentum over traditional incineration?
Plasma-arc gasification, expanding at a 16.6% CAGR, is gaining favor for its higher energy-recovery efficiency and lower residue volumes.
Why are transport-fuel distributors entering the sector?
Renewable-fuel mandates in the EU and United States support bio-synthetic natural gas and bio-liquefied natural gas offtake, driving a 17.2% CAGR for this end-user group.
How do carbon-credit markets influence project returns?
Rising allowance prices in South Korea and Canada have lifted internal rates of return by 1-2 percentage points, enhancing competitiveness against solar and wind.
What is the biggest regulatory risk in Europe?
Germany’s halved dioxin cap postpones refurbishments and idles capacity, potentially tightening feedstock markets and elevating tipping fees region-wide.
Page last updated on:


