
Waste Disposal Equipment Market Size and Share
Market Overview
| Study Period | 2020 - 2031 |
|---|---|
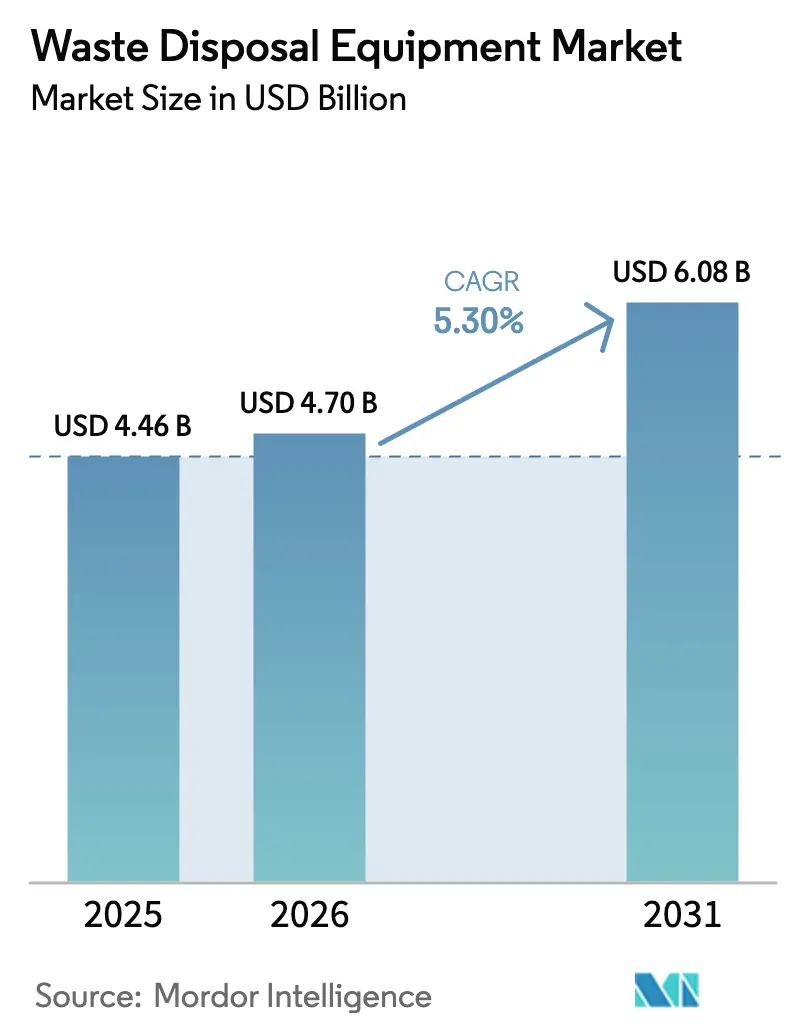
| Market Size (2026) | USD 4.7 Billion |
| Market Size (2031) | USD 6.08 Billion |
| Growth Rate (2026 - 2031) | 5.30 % |
| Fastest Growing Market | Middle East and Africa |
| Largest Market | Asia-Pacific |
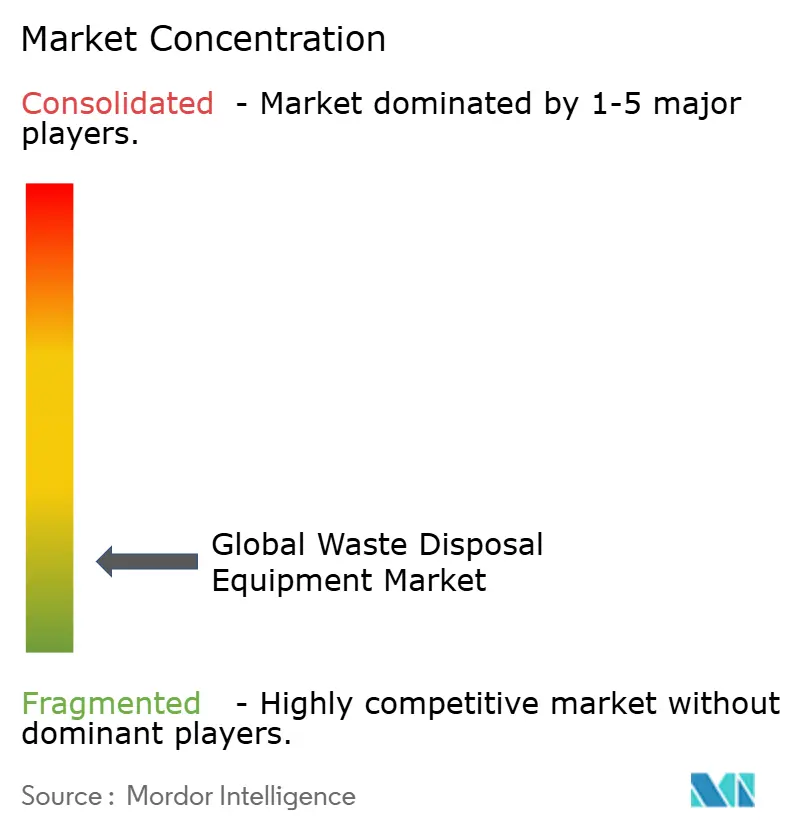
| Market Concentration | Low |
Major Players *Disclaimer: Major Players sorted in no particular order Image © Mordor Intelligence. Reuse requires attribution under CC BY 4.0. | |
Waste Disposal Equipment Market Analysis by Mordor Intelligence
Global Waste Disposal Equipment Market size in 2026 is estimated at USD 4.7 billion, growing from 2025 value of USD 4.46 billion with 2031 projections showing USD 6.08 billion, growing at 5.30% CAGR over 2026-2031. Demand resilience stems from rising waste volumes, stricter environmental rules, and continuous upgrades in collection, sorting, and processing technology. The Asia-Pacific region, holding the largest 47% revenue share, benefits from rapid urban growth and industrial expansion, while the Middle East and Africa post the fastest 7.2% CAGR as infrastructure spending and public environmental awareness accelerate equipment purchases. Waste recycling equipment currently leads with a 36% share of the Global waste disposal equipment market, although AI-enabled sorting systems are reshaping competitive dynamics. Manufacturers are adding electrified drivetrains and smart controls across product lines, and municipal buyers, now 45.1% of all end users, are prioritizing systems that facilitate source segregation and circular economy goals.
Key Report Takeaways
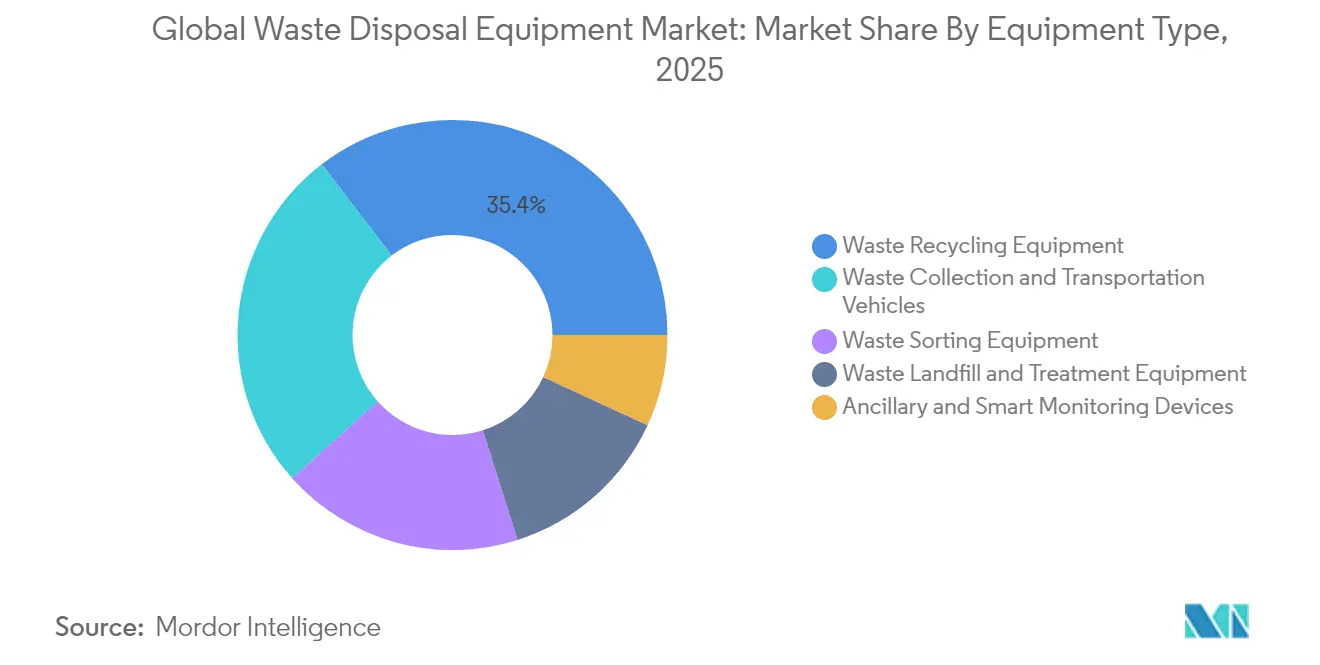
- By equipment type, waste recycling machinery led with 35.40% Global waste disposal equipment market share in 2025; AI-powered sorting solutions are projected to rise at a 11.9% CAGR through 2031.
- By waste type, non-hazardous streams accounted for 69.80% of the Global waste disposal equipment market size in 2025, while hazardous-waste systems are advancing at an 7.7% CAGR to 2031.
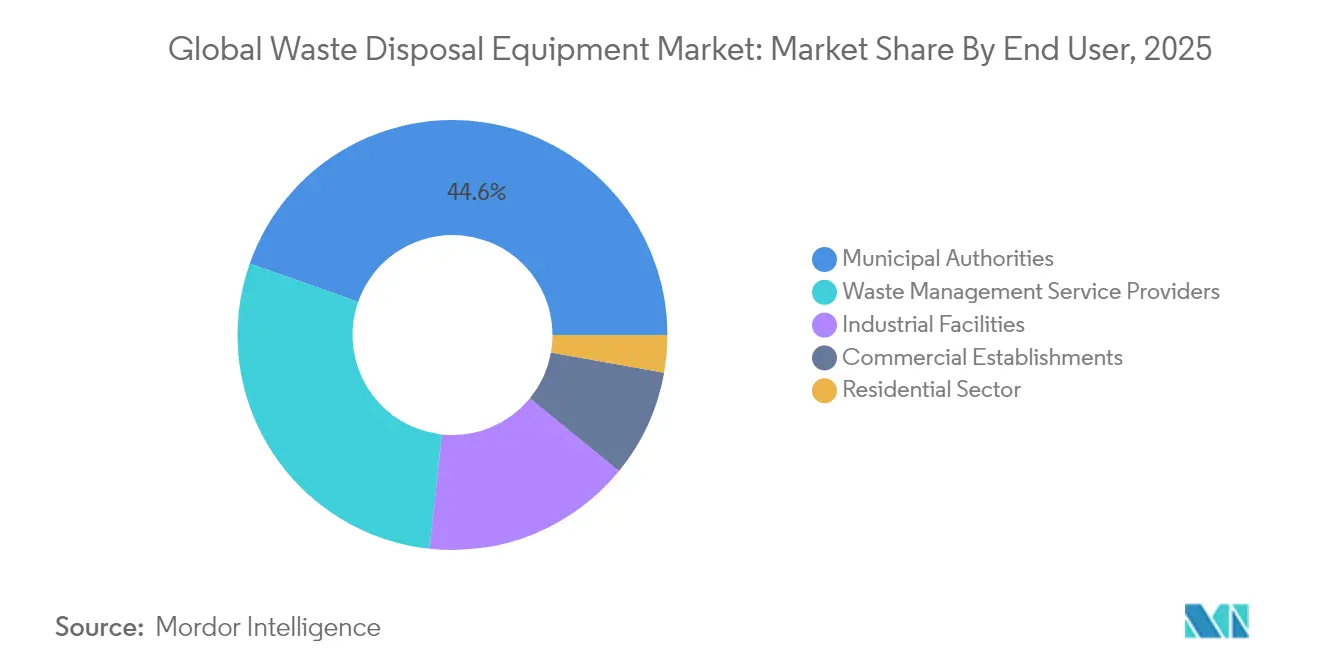
- By end user, municipal authorities commanded 44.60% of the 2025 revenue pool, yet industrial facilities are registering the quickest 6.05% CAGR over the forecast period.
- By mode of operation, stationary units held 77.60% share in 2025, while mobile equipment will grow 8.25% annually through 2031.
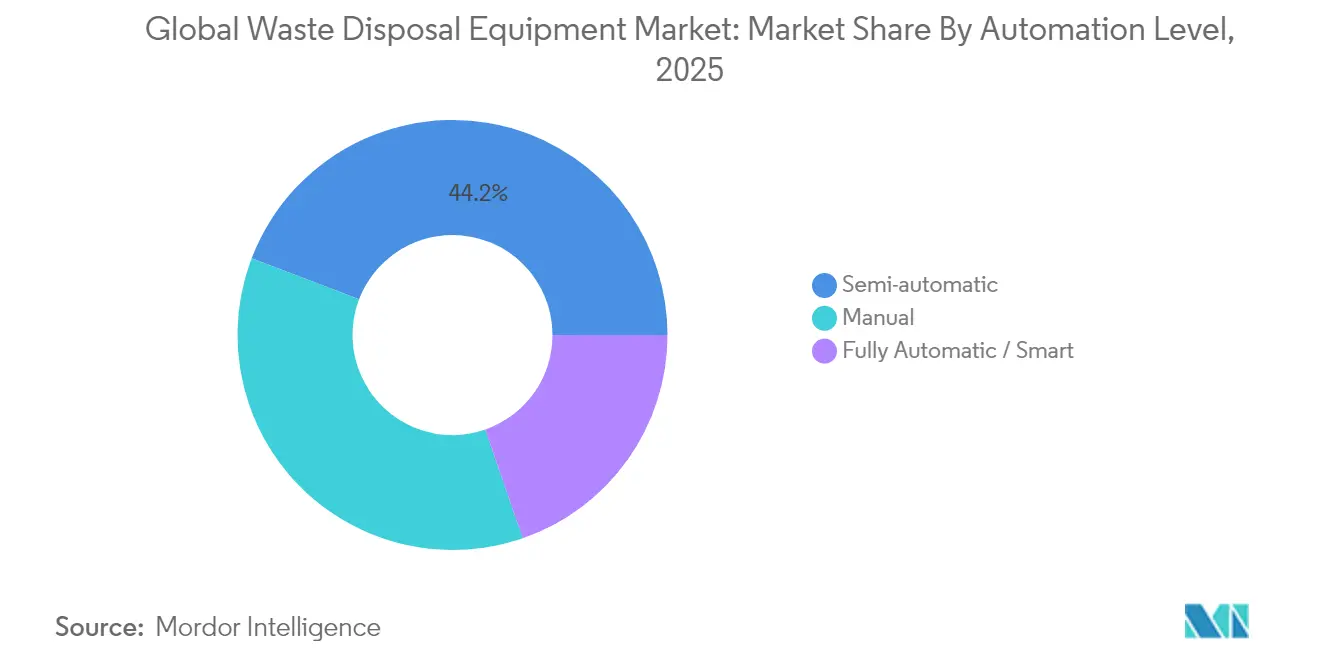
- By automation level, semi-automatic led the market with 44.20% share in 2025, while fully automatic / smart equipment is projected to grow at a 9.45% CAGR through 2031.
- By power source, diesel-powered units dominated with 66.90% share in 2025, whereas electric are expected to expand the fastest, registering a 9.8% CAGR over 2026-2031.
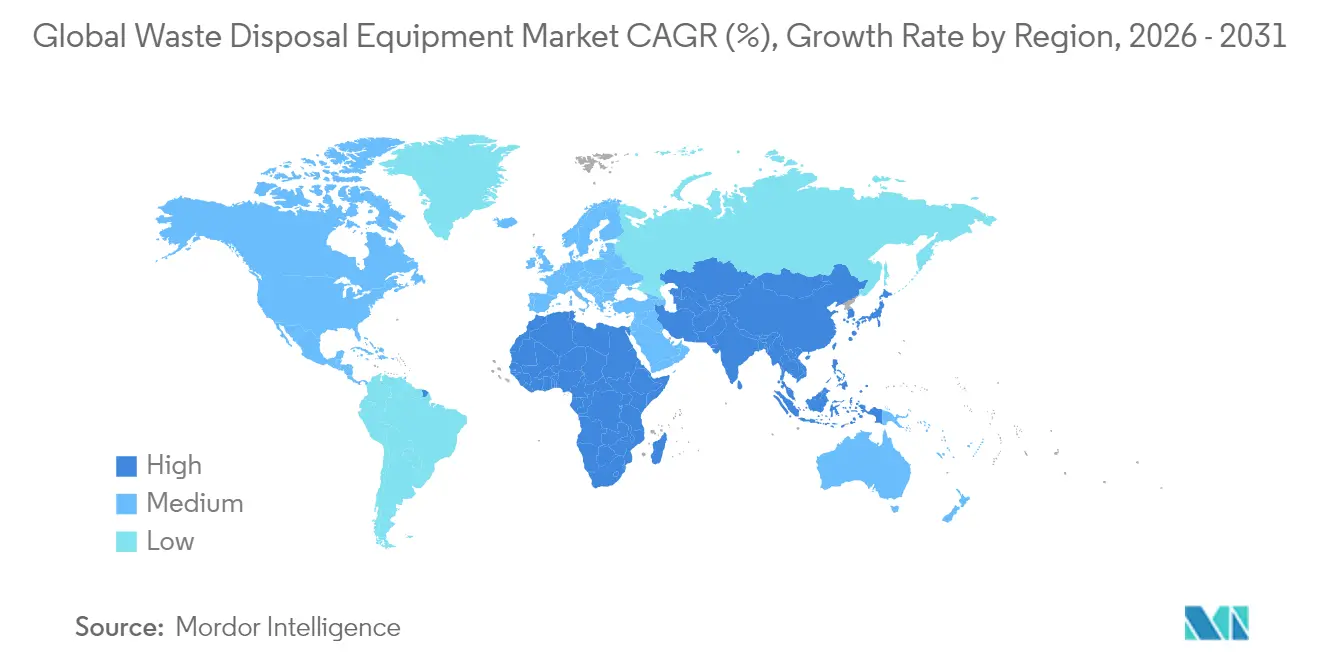
- By geography, Asia-Pacific controlled 46.50% of 2025 revenue, and Middle East Africa is forecast to expand 6.95% annually to 2031.
Note: Market size and forecast figures in this report are generated using Mordor Intelligence’s proprietary estimation framework, updated with the latest available data and insights as of 2026.
Market Trends and Insights
Drivers Impact Analysis of Waste Disposal Equipment Market*
| Driver | (~) % Impact on CAGR Forecast | Geographic Relevance | Impact Timeline |
|---|---|---|---|
| Accelerated adoption of AI-enabled optical sorters | +1.2% | Europe, North America, early uptake in Asia-Pacific | Medium term (2-4 years) |
| Post-ban e-waste recycling stimulus | +1.0% | Asia-Pacific, global spillover | Short term (≤ 2 years) |
| Escalating landfill-tax regimes | +0.9% | Nordic region, wider Europe | Short term (≤ 2 years) |
| Transition to electric refuse-collection fleets | +0.8% | North America, Europe | Medium term (2-4 years) |
| Mandatory source-segregation laws | +0.7% | South-Asian metros | Medium term (2-4 years) |
| EPR funds driving baler upgrades | +0.6% | Latin America, later Africa | Medium term (2-4 years) |
| Source: Mordor Intelligence | |||
Accelerated Adoption of AI-enabled Optical Sorters
AI-guided optical sorters now reach 99% material-recognition accuracy, unlocking higher recovery rates for metals and wood and trimming operating budgets for large material-recovery facilities. A seven-year cost comparison shows an automated plant all-in expense of USD 14.0 million, versus USD 23.6 million for a similarly sized manual operation, translating to a 40.6% life-cycle saving.[1]These financial gains, coupled with labor-shortage relief and tighter purity mandates, are propelling deployment across Europe’s high-labor-cost markets and spilling into North America and advanced Asian hubs.
Post-ban E-waste Recycling Stimulus
Regional bans on electronic waste imports and the domestic generation of 2.9 million tons of obsolete devices have galvanized Asia-Pacific governments to expand local processing. The Global e-Waste Monitor notes USD 62 billion in recoverable resources locked in unprocessed scrap.[2] Investment is flowing into shredders, depollution lines, and robotic dismantlers capable of safely extracting lithium batteries, encouraging faster uptake of specialized equipment across the region.
Transition to Electric Refuse Collection Fleets
Electric refuse trucks achieve 40-62% lower running costs than diesel units, as consistent stop-start routes exploit regenerative braking. Early fleets from leading OEMs demonstrate weekly route parity with diesel trucks while cutting maintenance through reduced brake wear. Municipal carbon-reduction targets and tighter urban air-quality standards hasten the procurement of battery-electric or hydraulic-hybrid drivetrains in cities from California to Scandinavia.
Mandatory Source Segregation Laws
Major South Asian metro areas are rolling out strict household separation rules. Dual-compartment collection vehicles and modular transfer stations capable of handling presorted streams lower downstream treatment expenses by up to 20%. This legislative push is expanding demand for compatible collection bodies, onboard bin sensors, and streamlined conveyor layouts that keep segregated fractions intact.
Restraints Impact Analysis of Waste Disposal Equipment Market*
| Restraint | (~) % Impact on CAGR Forecast | Geographic Relevance | Impact Timeline |
|---|---|---|---|
| Long payback for robotic pickers | -0.5% | Global, small & midsize MRFs | Short term (≤ 2 years) |
| Semiconductor shortages | -0.7% | Global, highest in emerging markets | Short term (≤ 2 years) |
| Fragmented municipal procurement | -0.3% | Africa, parts of Asia & Latin America | Long term (≥ 4 years) |
| Costly EU battery-safety certification | -0.4% | Europe, global spillover | Medium term (2-4 years) |
| Source: Mordor Intelligence | |||
Long Payback for Robotic Pickers
Smaller facilities struggle to justify multi-robot systems where throughput is modest and capital budgets are tight, prolonging break-even horizons beyond five years. Financing programs and equipment-as-a-service models are gradually easing this barrier, but uptake remains slow in developing regions.
Semiconductor Shortages
Persistent chip supply disruptions constrain deliveries of advanced sensors, drives, and control boards. Lead times have doubled for optical sorters and vehicle telematics units, complicating project schedules and inflating costs, especially in regions with limited inventory buffers.
*Our forecasts treat driver/restraint impacts as directional, not additive. The impact forecasts reflect baseline growth, mix effects, and variable interactions.
Waste Disposal Equipment Market Segment Analysis
By Equipment Type:
Recycling Machinery Maintains Lead while AI Sorting SurgesWaste recycling equipment held a 35.40% revenue share of the Global waste disposal equipment market in 2025. Manufacturers are integrating near-infrared sensors, machine learning, and robotics to raise purity and reduce labor costs. AI-driven systems are projected to post a 11.9% CAGR, outpacing conventional screen-and-magnet lines as facilities chase higher commodity yields and automate low-value tasks. Traditional brands are retrofitting optical detection kits into existing sorters to protect installed bases, while specialized startups push modular, trailer-mounted units for smaller municipalities.
The electric shift in collection and transfer vehicles mirrors broader decarbonization trends; battery packs, electric PTOs, and regenerative braking are now standard in new refuse-truck tenders. Ancillary smart devices, fill-level sensors, route-optimization software, and compactor-pressure monitors extend digital oversight beyond the tipping floor. Early adopters report preventive-maintenance savings and clearer material-flow data that underpin circular economy targets inside the Global waste disposal equipment market.

By Waste Type:
Hazardous Streams Drive Specialized Technology UptakeNon-hazardous streams generated 69.80% of 2025 revenue, yet hazardous-waste solutions are advancing fastest at 7.7% CAGR through 2031. Regulatory focus on medical, chemical, and electronic residues boosts demand for sealed shredders, negative-pressure feeding systems, and thermal destruction units. The Global waste disposal equipment market size for hazardous-waste treatment is expected to expand as lithium-battery recovery plants and solvent-recapture lines come online.
E-waste, with only 22.3% formal recycling, underlines a widening opportunity. Robotic depollution stations now remove batteries and capacitors at 98% purity, alleviating safety risks and retrieving high-value metals. Construction-and-demolition debris also prompts investments in mobile crushers and automated density-based separators, which reclaim concrete and metals for reuse.
By End User:
Industry Investments Accelerate AutomationMunicipal entities represented 44.60% of 2025 revenue owing to statutory waste-collection duties. However, industrial facilities are rapidly upgrading on-site processing to cut disposal fees and recover raw materials, delivering a 6.05% CAGR through 2031. Manufacturers in food, electronics, and chemicals are installing compactors, balers, and solvent-recovery units tailored to their specific waste profiles.
Waste-management service companies continue to broaden fleets with smart collection bodies and region-specific treatment hubs. Commercial premises—retail chains, office parks, and hotels—opt for vertical balers and small-foot-print compactors to curb hauling costs. Community-level drop-off points and decentralized composting illustrate how residential stakeholders now participate in source-segregated streams that feed into the wider Global waste disposal equipment market.
By Mode of Operation:
Mobile Platforms Strengthen Logistical FlexibilityStationary systems control 77.60% of revenue, reflecting entrenched capital assets at transfer stations, MRFs, and landfill sites. Yet mobile equipment registers an 8.25% CAGR, favored for disaster cleanup, rural deployments, and temporary project sites. Trailer-mounted sorters, skid-mounted compactors, and containerized balers reduce upfront civil works and enable redeployment as waste flows shift.
For waste-oil recovery, portable suction rigs offer fleet-maintenance shops an easy path to compliance, minimizing downtime compared with fixed pits. Real-time sensor suites installed on both stationary and mobile units feed asset-performance dashboards, steering predictive-maintenance schedules and fuel-saving initiatives across the Global waste disposal equipment market.
By Automation Level:
Smart Systems Enhance EfficiencyThe transition from manual to semi-automatic and fully autonomous systems gathers pace. Comparative studies show autonomous configurations trimming fuel use to 5 L/day and cutting overflows, while boosting carbon-emission reductions to 67%. Facilities unable to finance full automation embrace semi-automatic retrofits—optical sensors added to existing conveyors or hydraulically actuated gates that improve throughput for moderate cost.
Fully automated e-waste lines record 83-fold productivity versus hand-dismantling, with material-purity rates reaching at least 98%. These performance gains are compelling for processors handling hazardous fractions, where labor-safety benefits reinforce the spending case.
By Power Source:
Battery and Hybrid Drivetrains Gain GroundDiesel remains the dominant propulsion across heavy trucks and self-powered compactors, yet battery-electric and hydraulic-hybrid models are winning new tenders. Field data reveal refuse trucks achieving fuel-equivalent 3.2 mpg, 2,500 gal annual fuel savings, and up to 100% CO₂ reduction when electricity is derived from renewables. Hydraulic-hybrid units provide an interim step, posting 25% fuel-economy gains by storing braking energy in accumulators.
Lifecycle assessments caution that electric benefits vary by grid mix, prompting fleet managers to match technology choices with local power profiles. Smart-grid integrations and depot-level energy-storage systems are emerging to buffer peak-charging loads and lock in renewable electricity for vehicle charging.
Geography Analysis
APAC Waste Disposal Equipment Market
Asia-Pacific held 46.50% of the Global waste disposal equipment market revenue in 2025. China and India anchor this leadership as urban populations climb and industrial activity intensifies, fostering investments in MRF networks, source-segregated collection, and e-waste dismantling. National subsidies and technology partnerships drive AI-enabled sorters and lithium-battery recovery lines, enlarging the regional Global waste disposal equipment market size at above-average speed.
MEA Waste Disposal Equipment Market
The Middle East and Africa represent the most dynamic growth trajectory at 6.95% CAGR through 2031. The continent generated 125 million tons of municipal solid waste in 2024 and faces a projected 244 million tons load next year. Recycling lags at 4%, yet an 80-90% recyclable content signals latent demand. East African economies endorsed a ten-point action plan in 2025 to boost e-waste infrastructure, encouraging capital inflows and technology transfer that widen African participation in the Global waste disposal equipment market.
Europe Waste Disposal Equipment Market
Europe maintains a robust stance thanks to stringent directives on landfill diversion, producer responsibility, and carbon neutrality. Escalating landfill taxes and circular-economy policy packages fund compactor, baler, and depot refurbishment programs. Regions within Scandinavia lead adoption of high-density presses and electric refuse trucks, setting performance benchmarks that ripple across the continent.
North America and GCC Waste Disposal Equipment Market
North America continues steady equipment renewal, guided by a C+ infrastructure grade that highlights deferred asset replacement. Federal zero-emission vehicle targets and expanding extended-producer-responsibility statutes sustain investment in electrified fleets and smart MRF upgrades. The Middle East, led by GCC nations, channels oil-revenues into waste-to-energy plants, automated sorting, and advanced composting, adding a noteworthy niche within the Global waste disposal equipment market.
Regulatory Landscape
Regulation continues to shape equipment specifications across collection, recycling, thermal treatment, and hazardous-waste handling, with compliance requirements increasingly built into procurement criteria for municipal and industrial buyers (municipal authorities accounted for 44.6% of 2025 revenue). In the United States, EPA actions in 2026 added concrete compliance anchors for equipment: a March 2026 proposed rule advanced broader adoption of hazardous-waste electronic manifests (e-Manifest), and EPA also published model hazardous-waste permitting modules (January 2026) covering tanks and containers, including inspection and air-emissions provisions relevant to sealed handling, shredding, and storage systems.
Air and engine-emissions proposals in 2026 also influence disposal-equipment design and fleet upgrades. In March 2026, EPA proposed changes to consolidate requirements for air curtain incinerators (under Clean Air Act section 129 rules), and its Large Municipal Waste Combustor framework continues to support demand for upgraded emissions-control and monitoring systems at thermal-treatment sites. For collection and transportation vehicles, EPA proposed amendments in July 2026 to compliance provisions and test procedures for heavy-duty highway engines (model year 2027 and later), reinforcing tighter compliance documentation alongside newer drivetrains in refuse-fleet tenders.
Value Chain Analysis
The value chain covers upstream inputs such as steel and fabricated components, hydraulics, and electronics (PLCs, sensors, vision systems), as well as chassis and drivetrains. It then moves into OEM manufacturing of compactors, balers, shredders, sorters, and refuse collection vehicles, with distribution via direct sales and dealer networks. Installation and commissioning are usually handled through project engineering for transfer stations and MRFs, followed by ongoing support through aftermarket parts, field service, and software, especially for AI-enabled optical sorting, IoT monitoring devices, and fleet telematics where semiconductor-constrained components can extend lead times.
Industry bodies and trade associations help coordinate between technology providers, operators, and regulators. In Europe, FEAD represents a broad operating base across collection, sorting, recycling, energy recovery, and final disposal, aligning equipment demand with contractor-led service models and compliance-driven upgrades. In machinery and plant engineering, VDMA Waste Treatment and Recycling Technology links over 100 member companies, supporting standard-setting discussions across global supply chains. For energy recovery and alternative fuels, the RDF Industry Group connects RDF/SRF producers, logistics providers, and energy-from-waste operators, shaping specifications for shredding, densification, and quality-control equipment tied to waste-derived fuel production and trade.
Competitive Landscape
Competition is moderate, with diversified conglomerates and regional specialists sharing space across equipment niches. TOMRA Systems retains a lead in sensor-based sorting through continuous algorithm refinement and multi-spectral hardware offerings. In collection vehicles, Volvo CE and Mack Trucks rolled out production-ready electric platforms that support municipal decarbonization agendas.
Strategic mergers deepen product breadth; established players acquire AI-vision startups to shortcut development cycles. For example, firms targeting the recycling segment enhanced portfolios by integrating robotic end-of-arm tooling for lightweight packaging, safeguarding their 36% foothold within the Global waste disposal equipment market.
Startups introduce mobile and modular concepts that undercut civil works costs and bring advanced sorting to underserved areas. Early pilots show ton-per-hour output from trailer-based AI separators, encouraging municipal managers to test pay-by-ton service models. In response, incumbents adopt subscription pricing, remote-diagnostics platforms, and factory-trained service programs to defend share.
R&D budgets tilt toward electrification, autonomous operations, and predictive analytics. Component suppliers collaborate on next-generation battery packs and high-voltage safety systems suited to refuse-truck duty cycles. This innovation race nudges the Global waste disposal equipment market toward higher technological entry barriers, gradually consolidating share among players able to finance continuous upgrades.
Waste Disposal Equipment Industry Leaders
-
Wastequip
-
CP Manufacturing Inc.
-
Dover Corporation
-
Morita Holdings Corporation
-
JCB
- *Disclaimer: Major Players sorted in no particular order
Waste Disposal Equipment Market Companies Covered in this Report
- Wastequip
- CP Manufacturing Inc.
- Dover Corporation
- Morita Holdings Corporation
- JCB
- Caterpillar Inc.
- TOMRA Systems ASA
- Veolia Environment S.A.
- SUEZ Group
- Babcock & Wilcox Enterprises
- Metso Outotec
- Komptech GmbH
- Tana Oy
- McNeilus Truck and Manufacturing Inc.
- Kirchhoff Group
- Blue Group
- Sierra International Machinery
- Fujian Longma Environmental Sanitation Equipment
- Henan Winner Vibrating Equipment
- Danieli Centro Recycling
- Terex Corporation
- Covanta
- Bollegraaf Recycling Solutions
- Steinert GmbH
Market Opportunities and Future Outlook
Near-term opportunities cluster around automation, digital monitoring, and compliance-focused upgrades that reduce manual variability and improve traceability across waste streams. AI-enabled optical sorting and robotics support higher-purity output needs and labor constraints, while connected compaction and container-monitoring platforms can support route optimization and service-level enforcement for municipalities and haulers. Wastequip activity reinforces this direction, with its Guardian Control System and WasteConnect IoT solutions expanding smart-enabled offerings during 2025-2026, tied to a broader shift toward instrumented containers, compactors, and data-driven collection operations.
Regulatory and trade-policy change is also opening room for specialized systems in hazardous waste, e-waste, and thermal treatment. In the United States, EPA actions in 2026 around hazardous-waste e-Manifest and permitting modules increase the operational value of sealed handling, compliant storage, and track-and-trace capable equipment. Municipal waste combustor emissions standards continue to drive demand for advanced filtration and continuous monitoring retrofits in incineration assets. In Europe, implementation of the Waste Shipment Regulation (EU) 2024/1157 is affecting how cross-border material flows are managed, and continued advocacy by the e-waste value chain to keep certain non-hazardous e-waste under streamlined procedures after January 1, 2027 points to ongoing demand for compliant preprocessing, depollution, and high-recovery sorting systems that can meet shipment and documentation requirements. Skills development and collaboration also support adoption, illustrated by SWANA and the Environmental Research & Education Foundation (EREF) signing an MOU in February 2026 to advance research and education in waste and resource management, which can strengthen operational readiness for advanced equipment at facilities and fleets.
Recent Industry Developments in Waste Disposal Equipment Market
- June 2026: Wastequip opened a new 43,000-square-foot steel manufacturing facility in Salisbury, North Carolina to produce front-load dumpsters, roll-off containers, and compactors. The expansion supports supply chain resilience and broadens product coverage in North American markets.
- June 2026: CP Group installed and commissioned a 25-tph commercial processing line at the Mid-Valley Recycling facility in Fresno, California. The capacity addition increases throughput and expands CP Group's recycling line capabilities, enabling larger scale municipal/commercial projects.
- May 2026: CP Group expanded manufacturing and engineering capacity by relocating its UL 508A-certified panel fabrication shop to a new 13,400-square-foot facility in San Diego, California. The relocation improves integration of automation and control systems across CP Group's equipment offerings.
Waste Disposal Equipment Market Report Scope and Research Methodology
Market Definition and Coverage
This market covers the value of equipment used to collect, handle, sort, recycle, process, and dispose of waste across municipal, commercial, and industrial settings. Revenue is counted as equipment sales value by geography in USD.
Scope exclusions: services such as waste collection contracts, landfill operations, and recycling processing fees are excluded from the market values.
Segments Covered in This Report
- By Equipment Type
- Waste Sorting Equipment
- Mechanical Sorting Systems
- Optical / AI-based Sorting Systems
- Robotic Picking Systems
- Waste Recycling Equipment
- Shredders
- Balers & Compactors
- Crushers & Pulverizers
- Conveying & Screening Systems
- Waste Collection & Transportation Vehicles
- Refuse Collection Trucks
- Hook-lift & Skip Loaders
- Automated Vacuum Collection Systems
- Waste Landfill & Treatment Equipment
- Landfill Compactors & Dozers
- Incinerators & Thermal Treatment Units
- Composting & Anaerobic Digestion Units
- Ancillary & Smart Monitoring Devices
- Smart Bins & Fill-level Sensors
- Software & Digital Platforms
- Waste Sorting Equipment
- By Waste Type
- Municipal Solid Waste
- Industrial Waste (Non-Hazardous)
- Hazardous Waste
- Medical & Bio-hazardous Waste
- Electronic Waste (E-waste)
- Construction & Demolition Debris
- By End-user
- Municipal Authorities
- Waste Management Service Providers
- Industrial Facilities
- Commercial Establishments
- Residential Sector
- By Mode of Operation
- Stationary Equipment
- Mobile / Portable Equipment
- By Automation Level
- Manual
- Semi-automatic
- Fully Automatic / Smart
- By Power Source
- Diesel
- Electric
- Hybrid
- Hydraulic / PTO-driven
- By Geography
- North America
- United States
- Canada
- Mexico
- South America
- Brazil
- Argentina
- Colombia
- Rest of South America
- Europe
- Germany
- United Kingdom
- France
- Italy
- Spain
- NORDICS (Denmark, Finland, Iceland, Norway, and Sweden)
- Rest of Europe
- Middle East and Africa
- GCC
- Israel
- Turkey
- South Africa
- Egypt
- Rest of Middle East and Africa
- Asia-Pacific
- China
- Japan
- India
- South Korea
- ASEAN (Indonesia, Thailand, Philippines, Malaysia, Vietnam)
- Australia & New Zealand
- Rest of Asia-Pacific
- North America
Data Sources, Market Sizing, and Validation
Desk Research
Desk research begins by assembling a fact base using waste generation levels, collection coverage, and policy targets that influence equipment spending. We rely on public sources such as the World Bank (waste and urbanization indicators), OECD waste statistics, UN Comtrade trade flows for relevant machinery categories, US EPA materials and waste data, and Eurostat waste treatment series, which help anchor demand direction by region.
To convert these signals into a usable market model, we also review company annual reports and investor decks, tender portals, and credible press for plant expansions, municipal procurement, and technology shifts in sorting and recycling lines. For cross-checks on company footprints, product mix, and financial context, we use selective paid subscriptions focused on company financials and intelligence, news and financials, patents, and shipment-level import and export data. The sources listed above are illustrative rather than exhaustive, and additional public documents and datasets were also used for data collection, validation, and clarification.
Primary Interviews and Surveys
Primary work is used to confirm what gets counted as equipment value in practice, and to test assumptions on typical pricing, replacement cycles, and the share of automated versus manual setups. We speak with a mix of OEM-side roles, distributors and integrators, and buyer-side stakeholders such as municipalities, waste operators, and industrial waste managers across major regions, so gaps in public data can be filled with practical inputs.
Distribution of primary research fieldwork respondents
| Company type | Respondent position | Region |
|---|---|---|
| Top tier: 39% | CXOs: 15% | APAC: 43% |
| Mid tier: 40% | Functional/Unit leaders: 33% | EMEA: 30% |
| Smaller Players: 21% | Managers: 52% | Americas: 27% |
Market-Sizing & Forecasting
Sizing follows a top-down path where waste generation and treatment capacity signals are translated into a realistic regional equipment demand pool, then mapped to procurement intensity. To keep it grounded, we cross-check totals against selective bottom-up approximations such as sampled average selling price times shipment volumes for key equipment groups, plus distributor and channel checks, and adjust when the two views do not align.
Key inputs for this market include municipal solid waste growth and collection coverage, landfill diversion and recycling targets, new material recovery facility and waste-to-energy capacity additions, automation penetration in sorting lines, and replacement cycles for high wear equipment. Forecasts use scenario analysis, where base case demand is linked to these drivers, then stress tested using expert views on capex timing, policy enforcement pace, and inflation in steel-heavy equipment pricing. Where country-level data are thin, regional analogs and trade proxies are applied, followed by a re-check with interview feedback so the final numbers remain explainable and repeatable.
Data Validation & Update Cycle
Outputs are checked through multiple steps so unusual changes are explained before finalizing numbers. We compare model results against independent signals such as import trends for relevant machinery, publicly announced facility builds, and procurement activity in key cities and industrial clusters, and we follow up when any region appears inconsistent.
Before sign-off, the work is reviewed across analysts for calculation errors, scope consistency, and year-on-year logic, and assumptions are revisited when new information changes the underlying drivers. Reports are refreshed annually, with interim updates when material events occur, such as major regulation changes or sharp shifts in equipment pricing. Right before delivery, a final pass is completed so clients receive the latest updated view.
Mordor Intelligence's Global Waste Disposal Equipment Market Sizing Compared With Other Published Estimates
Published market values for waste disposal equipment often do not match because the included equipment set, the point of revenue capture, and the time frame can change across studies. Differences also come from how firms treat recycling and sorting lines versus broader waste management assets, and from whether estimates are updated when pricing or procurement cycles shift.
Some external estimates blend landfill, collection, and broader waste management equipment under one umbrella, which inflates the total. In the Mordor Intelligence approach, the value is counted only for dedicated waste disposal equipment categories within the study scope, and service revenues plus adjacent general-purpose machinery are not added into the total.
Benchmark comparison
| Source | Market Size | Gaps in Research Methodology |
|---|---|---|
| Mordor Intelligence | USD 4.70 B (2026) | |
| Industry Publisher A | USD 2.26 B (2024) | Uses an earlier base year and a tighter equipment grouping that splits sorting and recycling differently, which can undercount automated line installations and newer higher-priced systems. |
| Global Consultancy B | USD 58.40 B (2026) | Represents a broader waste management equipment universe that can include collection fleets and wider facility equipment, so the equipment value is not isolated to disposal-focused categories. |
The spread across figures is mainly explained by how wide the equipment basket is and whether non-equipment revenues get mixed into the number. By keeping the unit of analysis tied to clear equipment categories and checking totals against trade, capacity adds, and interview-based pricing reality, the final value stays easier to trace and update year to year.
Key Questions Answered in the Report
What is the current value of the Global waste disposal equipment market?
The current value of the Global Waste Disposal Equipment Market in 2026 is USD 4.7 billion.
Which region leads Global waste disposal equipment market revenue?
Asia-Pacific holds 46.50% of 2025 revenue due to rapid urbanization and industrial growth.
What equipment category has the highest Global waste disposal equipment market share?
Waste-recycling machinery led with a 35.40% share in 2025, supported by upgrades to AI-enabled sorters.
How fast is hazardous-waste equipment expected to grow?
Hazardous-waste processing systems are projected to expand at an 7.7% CAGR from 2026 to 2031.
Why are electric refuse trucks gaining popularity?
They provide 40-62% operating-cost savings and meet tightening emission targets, making them attractive to municipalities and private haulers.
What role do AI-powered optical sorters play in the industry?
They raise material-recovery accuracy to 99% and lower lifecycle costs by over 40%, accelerating automation in recycling facilities.