
Market Overview
| Study Period | 2020 - 2031 |
|---|---|
| Market Size (2026) | USD 26.1 Billion |
| Market Size (2031) | USD 33.38 Billion |
| Growth Rate (2026 - 2031) | 5.04 % |
| Fastest Growing Market | Asia-Pacific |
| Largest Market | North America |
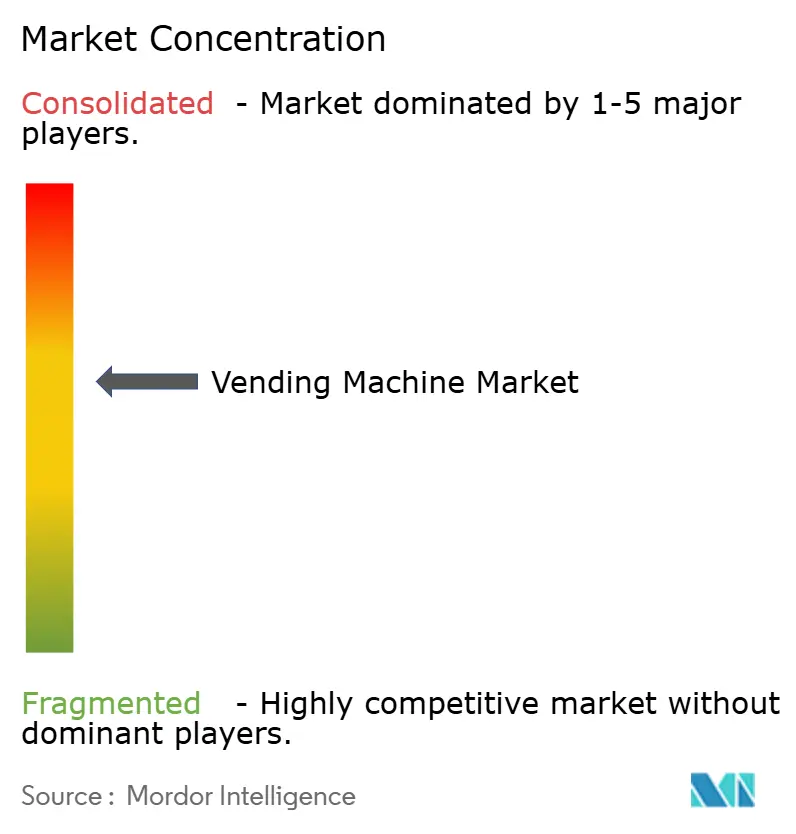
| Market Concentration | Medium |
Major Players.webp) *Disclaimer: Major Players sorted in no particular order Image © Mordor Intelligence. Reuse requires attribution under CC BY 4.0. | |
Vending Machine Market Analysis by Mordor Intelligence
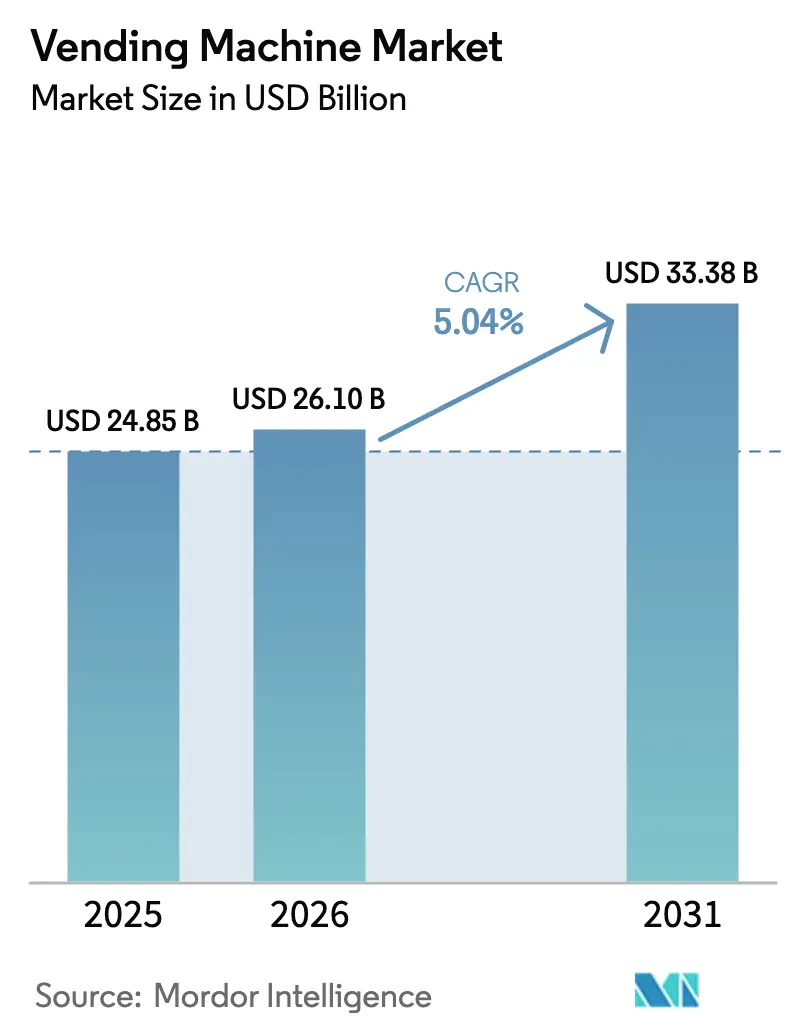
The vending machine market size is expected to grow from USD 24.85 billion in 2025 to USD 26.1 billion in 2026 and is forecast to reach USD 33.38 billion by 2031 at 5.04% CAGR over 2026-2031. The current expansion of the global vending machine market is powered by AI-driven assortment optimization, predictive maintenance, and the rapid migration from coin-based mechanisms to cashless and contact-free payments. Regulatory triggers—particularly extended-producer-responsibility (EPR) mandates in Europe and workplace ESG scorecards in North America—push operators to deploy reverse-vending and healthy-product formats, reshaping the competitive playbook. Operators that marry connected fleets with data-rich software layers now monetize insights, rather than margin-squeezed hardware, catalyzing an ecosystem where payment processors, fleet-management platforms, and service integrators capture a growing share of profit pools. Asia–Pacific’s urbanization boom and mobile-wallet ubiquity provide outsized white-space potential; simultaneous labor-cost pressures in mature markets lead enterprises to automate micro-retail at transit hubs, hospitals, and industrial campuses.
Key Report Takeaways
- By technology, automatic systems held 55.12% of global vending machine market share in 2025, yet smart/IoT-enabled units are projected to expand at a 9.78% CAGR to 2031.
- By product type, beverages captured 32.85% revenue share in 2025, while reverse-vending machines are forecast to grow at an 10.71% CAGR through 2031.
- By application, commercial buildings and offices led with 22.18% share of the global vending machine market size in 2025; healthcare facilities record the fastest 9.47% CAGR to 2031.
- By payment mode, cash led with 68.72% share of the global vending machine market size in 2025; Mobile wallet and QR record the fastest 12.05% CAGR to 2031.
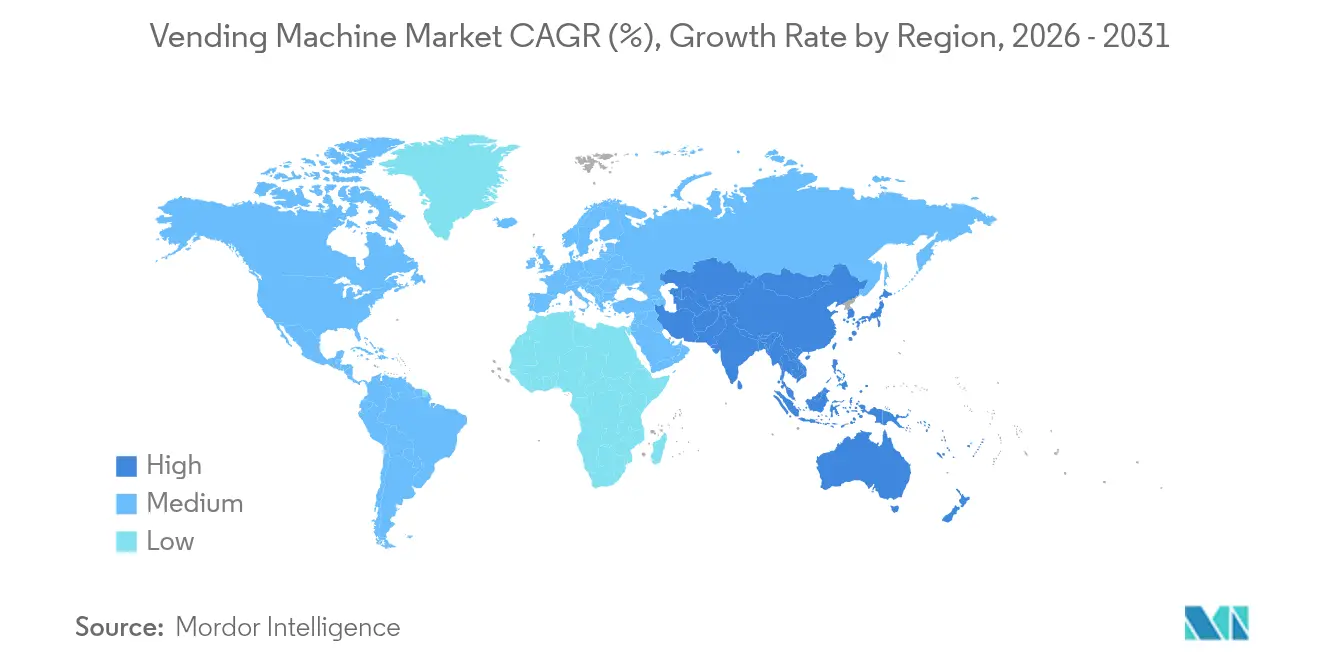
- By geography, North America commanded 32.74% share of the global vending machine market in 2025, whereas Asia-Pacific is projected to post a 9.86% CAGR over the same horizon.
Note: Market size and forecast figures in this report are generated using Mordor Intelligence’s proprietary estimation framework, updated with the latest available data and insights as of 2026.
Market Trends and Insights
Drivers Impact Analysis of Vending Machine Market*
| Driver | (~) % Impact on CAGR Forecast | Geographic Relevance | Impact Timeline |
|---|---|---|---|
| Increasing demand for packaged and fresh food for on-the-go consumption | +1.2% | Global, with concentration in urban centers | Medium term (2-4 years) |
| Rapid adoption of cashless and contactless payment technologies | +0.9% | North America & EU leading, APAC accelerating | Short term (≤ 2 years) |
| Deployment of IoT-enabled smart vending fleets for predictive maintenance | +0.8% | Developed markets initially, emerging market spillover | Medium term (2-4 years) |
| Extended-producer-responsibility rules spurring reverse-vending installations | +0.7% | Europe core, expanding to North America | Long term (≥ 4 years) |
| Workplace ESG targets boosting healthy and sustainable vending offerings | +0.5% | Corporate hubs in North America, Europe, APAC | Medium term (2-4 years) |
| Medicine and PPE vending in rural healthcare networks | +0.4% | Rural and underserved regions globally | Long term (≥ 4 years) |
| Source: Mordor Intelligence | |||
Increasing Demand for Packaged and Fresh Food for On-the-Go Consumption
Food-service convenience continues to lift the global vending machine market as commuters, office staff, and students prioritize speed and accessibility over traditional retail. The U.S. Bureau of Labor Statistics recorded a 140.66% jump in vending-food prices between 1997 and 2025, with a notable 14.81% increase in 2023, confirming the category’s pricing power.[1] Tokyo’s AI-equipped salad units adjust prices dynamically to minimize shrinkage and elevate margins.[2] Operators overlay predictive-demand models that fine-tune SKUs by micro-location, cutting waste and boosting revenue per square foot. Partnerships with controlled-atmosphere-packaging suppliers now make fresh produce viable for five-day shelf lives, broadening product scope at transportation hubs and higher-education campuses.
Rapid Adoption of Cashless and Contactless Payment Technologies
A second tailwind for the global vending machine market is the steady replacement of coins and bills with tap-and-go or QR-based options, advancing 12.65% CAGR through 2030. Cantaloupe processed more than 1.15 million connected endpoints across the Americas and Europe in 2024, underscoring scale economics behind payment modernization. Japan’s July 2024 banknote redesign illustrates the retro-fit complexity: only 30% of machines were reconfigured at launch, forcing operators to weigh upgrade costs against possible sales disruption. In India, the Reserve Bank’s QR-coin pilot places digital wallets at high-footfall locations, an early indication that emerging markets may leapfrog physical cash. Although processor fees of 2-5% compress gross margins, operators recoup value via higher average tickets and lower cash-handling overhead.
Deployment of IoT-Enabled Smart Vending Fleets for Predictive Maintenance
Connected-device roll-outs push the global vending machine market toward a service-first model. More than 6.5 million networked units were active worldwide in 2023, according to IoT Business News.[3] Academic work in Applied Sciences demonstrated downtime drops of over 40% when machine-learning algorithms flagged motor failures before breakdowns. Early adopters cite double-digit energy-cost reductions from adaptive compressor cycling, aiding ESG targets. By coupling telemetry with route-optimization software, fleet managers shrink truck rolls and lower labor ratios, freeing capital for growth segments such as healthcare PPE distribution.
Extended-Producer-Responsibility Rules Spurring Reverse-Vending Installations
European EPR statutes compel beverage brands to underwrite recovery infrastructure, catalyzing the fastest expansion lane within the global vending machine market. The UK launches its Deposit Return Scheme in October 2027, aiming for 90% bottle-can recovery. TOMRA already operates 87,000 reverse-vending units that collected 48 billion containers in 2024. Envipco’s revenue surged 164% year-on-year to EUR 27.4 million (USD 29.8 million) in Q1 2024, validating robust order pipelines. Retailers that deploy reverse vending meet regulatory targets and attract footfall, justifying premium floor-space economics despite higher capex.
Restraints Impact Analysis of Vending Machine Market*
| Restraint | (~) % Impact on CAGR Forecast | Geographic Relevance | Impact Timeline |
|---|---|---|---|
| High capital, installation and maintenance expenditures | -0.8% | Global, particularly impacting emerging markets | Short term (≤ 2 years) |
| Sugary-drink and calorie restrictions in public institutions | -0.7% | North America & EU with strict health regulations | Medium term (2-4 years) |
| Cyber-security and data-privacy risks for connected machines | -0.6% | Developed markets with strict data protection regulations | Medium term (2-4 years) |
| Hygiene and vandalism concerns in certain public areas | -0.5% | Urban centers and high-crime areas globally | Short term (≤ 2 years) |
| Source: Mordor Intelligence | |||
High Capital, Installation, and Maintenance Expenditures
Up-front investment remains a gating factor for new entrants to the global vending machine market. Modern smart units with refrigeration, vision sensing, and multi-payment modules require meaningfully higher capital outlays than legacy coil machines. Operators must also budget for software licences, connectivity, and regulatory compliance upgrades such as EMV-co-certified readers. Raw-material volatility adds further strain; the U.S. Department of the Treasury’s 2024 copper cost review highlighted margin pressure on coin mechanisms that still serve 69.5% of 2024 transactions. Tight lending standards in many emerging economies elongate payback periods, causing smaller route owners to defer fleet renewal.
Cyber-Security and Data-Privacy Risks for Connected Machines
The pivot to always-connected fleets widens the threat landscape. Recent U.S. deployments of facial-recognition ammunition dispensers exposed how peripheral use-cases can attract sophisticated hacking attempts. Operators must encrypt payment tokens, anonymize biometrics, and comply with GDPR-style opt-in frameworks, elevating both compliance overhead and insurance premiums. A single breach can freeze revenue streams if acquirers suspend merchant IDs, compounding financial exposure. Consequently, risk-averse corporate landlords occasionally limit connected installations, dampening near-term penetration rates.
*Our forecasts treat driver/restraint impacts as directional, not additive. The impact forecasts reflect baseline growth, mix effects, and variable interactions.
Vending Machine Market Segment Analysis
By Technology:
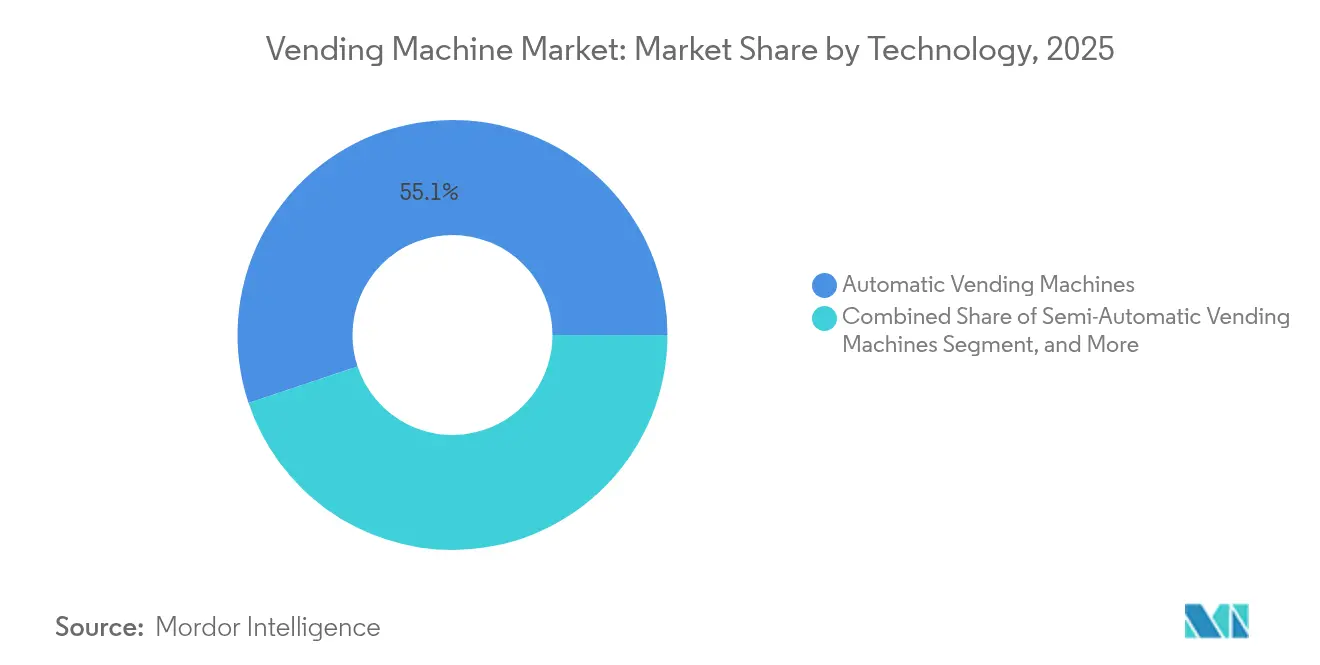
IoT Connectivity Rewires OperationsAutomatic machines, long the workhorse of the global vending machine market, held 55.12% global vending machine market share in 2025. Their wide installed base anchors predictable revenue but offers fewer upside levers. Smart/IoT units, meanwhile, are scaling at a 9.78% CAGR, signaling a secular shift toward software-centric business models. The global vending machine market size attributed to connected machines is projected to expand from USD 7.9 billion in 2025 to USD 13.84 billion by 2031. This growth unlocks ancillary revenue for cloud-based fleet dashboards and programmatic advertising, cushioning hardware margin compression.
Patent filings corroborate the innovation runway. Coca-Cola’s micro-ingredient management patents enable remote flavor tweaks, lowering service calls. Algorithmic planograms that localize assortments at street-block granularity are hitting commercial viability as cellular data prices fall. Early adopters report double-digit upticks in sales conversion when AI modules reorder the SKU face according to real-time demand. Against that backdrop, semi-automatic machines are tapering as a transitional form factor with limited ROI.

By Product Type:
Circular-Economy Units Gain MomentumBeverages remained kingpin at 32.85% of 2025 revenues; nevertheless, sustainability legislation positions reverse-vending machines as the fastest clip at 10.71% CAGR. Their contribution to global vending machine market size is forecast to triple by 2031 as more jurisdictions introduce mandatory deposit schemes. Traditional snack and packaged-food machines continue to serve core meal occasions, yet salt- and sugar-content regulations require portfolio revamps. Non-food essentials—think PPE and phone accessories—are no longer niche, aided by price elasticity that offsets lower volume throughput.
TOMRA’s 48 billion annual container capture underscores how scale addresses waste-management economics. During 2025, several EU grocers integrated on-site compactors, pulling logistics costs out of the return loop and raising operator ROI. Parallel to that, AI-driven fresh-food units in Tokyo are proving that perishables can beat shrinkage headwinds with dynamic pricing engines, validating broader menu diversification.
By Application:
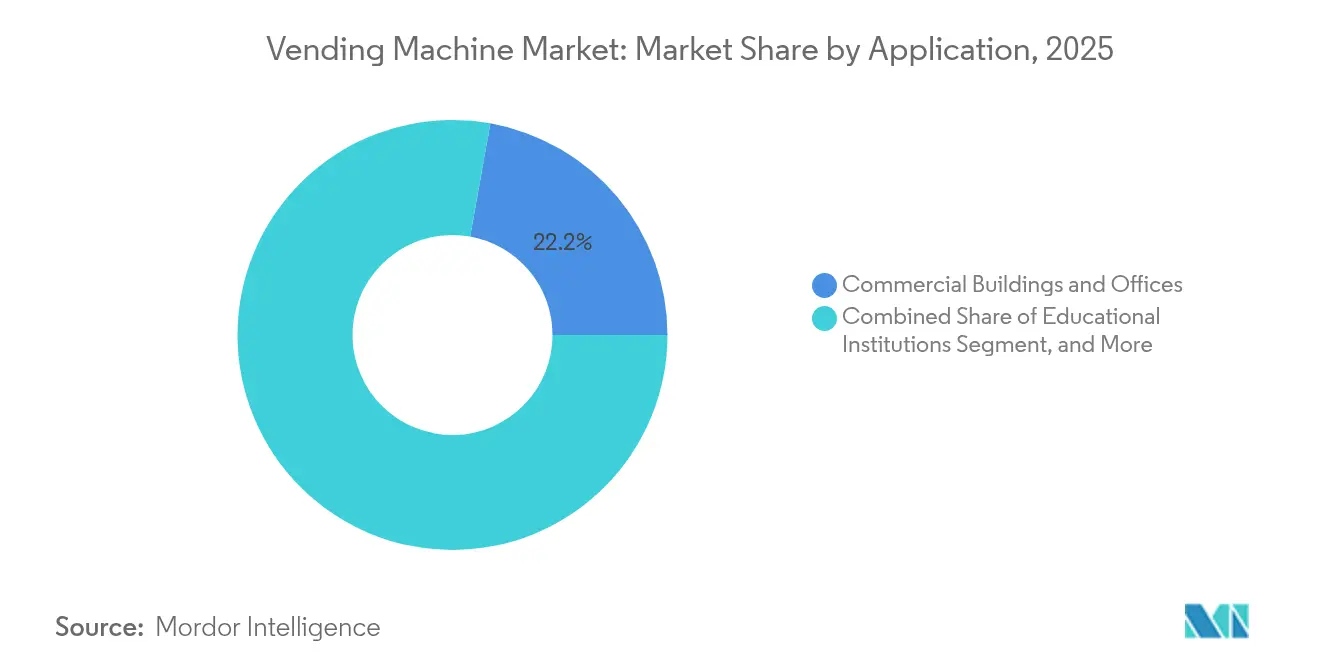
Healthcare Networks Accelerate AdoptionCommercial offices commanded 22.18% of transaction value in 2025, benefiting from captive foot traffic and facility-management contracts. Healthcare sites, however, are projecting the quickest 9.47% CAGR as hospitals digitize PPE compliance audits and medicine access. The global vending machine market size for healthcare-specific units is set to cross USD 2.18 billion by 2031. Round-the-clock availability and audit-ready dispensing logs justify higher price points, narrowing payback to under three years for large hospital systems.
Transportation hubs remain volume engines due to long dwell times, but premium rent increases squeeze margin. Industrial campuses deploy IoT-tagged safety-gear machines that automatically re-order based on issuance counts, illustrating how compliance can subsidize automation budgets. Educational institutions provide seasonal but sticky revenue cycles via multi-year concessions, provided healthier-option quotas are met.
By Payment Mode:
Mobile Wallets Outpace PlasticCash still held 68.72% of 2025 transaction volume, yet its share of the global vending machine market continues to erode. Mobile wallet and QR payments are advancing at a 12.05% CAGR, well ahead of overall market velocity. Itoen’s 20,000-unit cashless network in Japan seeks a 40% cashless mix by 2025. The global vending machine market size linked to app-enabled purchases is forecast to exceed USD 10.46 billion by 2031.
Debit and credit card NFC transactions fill an interim gap where mobile adoption lags, especially among older demographics in Western Europe. Biometrics and facial recognition remain pilot-stage, constrained by privacy legislation and hardware cost. However, operators see rising conversion where checkout takes less than five seconds, positioning contactless flows as table stakes in high-footfall corridors.
Geography Analysis
North America Vending Machine Market
North America accounted for 32.74% of 2025 global vending machine market revenue, leveraging ubiquitous broadband and card-payments infrastructure. The United States channeled post-pandemic hygiene priorities into contact-free PPE dispensers across government buildings, while Canada’s carbon-reduction targets incentivized energy-efficient refrigeration retrofits. Mexico, though smaller, is scaling reverse-vending pilots as beverage majors prepare for anticipated EPR laws. Labor-cost inflation hastens automation uptake across all three markets, sustaining mid-single-digit growth despite maturity pressures.
APAC Vending Machine Market
Asia-Pacific registered the highest 9.86% CAGR outlook, adding critical mass to the global vending machine market through urban migration and mobile money ubiquity. China’s QR-first consumer culture accelerates smart-unit penetration, while Japan wrestles with currency redesigns that have rendered 70% of older machines temporarily non-compliant. Thailand’s Tao Bin network sells 200,000 drinks daily via 6,000 machines, a poster child for labor substitution economics. India’s Reserve Bank QR-coin initiative signals a state-sponsored push to modernize micro-retail payments.
Europe Vending Machine Market
Europe’s trajectory is steadier but underpinned by regulatory catalysts. The UK’s 2027 Deposit Return Scheme ramps reverse-vending installations, while Germany’s Bremen Airport opened an AI-policed autonomous store in June 2025. Scandinavian operators, already largely cashless, now market ESG-compliant snack lines to corporate campuses. Southern Europe lags on mobile-wallet density yet catches up via tourism-linked deployments in airports and railway stations, ensuring the region maintains a high-single-digit growth clip.
Regulatory Landscape
Regulation touching vending machines spans food disclosure, electrical safety, payment security, and circular-economy compliance. In the United States, FDA vending machine labeling requirements under 21 CFR 101.8 apply to operators with 20 or more machines and require calorie disclosures at the point of purchase, shaping product labeling, UI prompts, and planogram governance for multi-site operators.
On product safety and sustainability, standards updates and EU frameworks influence design and documentation. ANSI/UL 751 revisions finalized on December 18, 2024 take effect on June 12, 2026 for self-contained, payment-accepting vending machines, while IEC 60335-2-75:2024 (published December 18, 2024) sets an updated international safety baseline for commercial dispensing appliances and vending machines. In Europe, the Ecodesign for Sustainable Products Regulation (EU) 2024/1781 establishes the Digital Product Passport framework, and the European Commission launched the Digital Product Passport Registry on July 20, 2026, signaling a shift toward standardized product-level sustainability data infrastructure that suppliers and importers will need to align with as delegated acts are rolled out by product group.
Value Chain Analysis
The vending machine value chain begins with raw materials and critical components (sheet metal, refrigeration systems, electronics, payment readers), then moves through OEM design and assembly. From there, channel partners and operators manage deployment, merchandising, and service. Hardware OEMs such as Azkoyen, Fuji Electric, and Crane (including payment systems capabilities) source microcontrollers, touch displays, and wireless modules to enable smart/IoT functionality, while payment and telemetry specialists such as Cantaloupe, Nayax, and Ingenico supply the acceptance stack and device management layers that increasingly shape uptime and consumer experience.
Downstream, integrators and operators monetize through recurring services, including connectivity, software subscriptions, remote monitoring, route optimization, and cashless processing. The connected installed base provides a measurable anchor for this shift, with industry reporting pointing to 8.1 million connected vending machines in operation globally in 2025. Compliance and redesign cycles also affect upstream lead times and cost structure, including refrigerant-driven redesign pressure under European F-Gas rules, alongside raw-material volatility and logistics delays that can disrupt build schedules and parts availability for installed fleets.
Competitive Landscape
Competitive intensity in the global vending machine market remains moderate, with technology capabilities—not just machine counts—dictating leadership. Fuji Electric, Azkoyen, and Crane NXT each leverage vertically integrated manufacturing and multi-continent service networks. Crane NXT’s Security and Authentication Technologies arm delivered 6.9% revenue growth to USD 1.49 billion in 2024 after integrating a bolt-on IoT telemetry platform. Azkoyen channels approximately 16% of its workforce into R&D and holds 36 active patents, reinforcing differentiation in payment validation and beverage compounding.
Software-first insurgents pursue recurring SaaS revenue rather than capital-heavy machine ownership, creating a dual-speed marketplace. Selecta’s intentional churn—exiting low-margin contracts while scaling its Foodtech segment 46%—illustrates a pivot toward premium, telemetry-enabled footprints. Payment-processor alliances further blur traditional boundaries: Mastercard’s 2025 gateway expansion allows operators to unify terminal management, fraud analytics, and loyalty schemes under one roof.
Regional fragmentation also invites consolidation. Private-equity vehicles accumulate small route portfolios across Southeast Asia, betting on operational synergies once standardized software stacks replace manual scheduling. Hardware vendors respond by bundling machine leases with end-to-end service contracts, locking in aftermarket parts and telemetry subscriptions. Optionality around advertising real estate —particularly on high-resolution touch displays—adds a nascent but promising monetization stream.
Vending Machine Industry Leaders
-
Westomatic Vending Services Ltd.
-
Seaga Manufacturing, Inc.
-
Royal Vendors, Inc.
-
Fuji Electric Co., Ltd.
-
Azkoyen Group
- *Disclaimer: Major Players sorted in no particular order
Vending Machine Market Companies Covered in this Report
- Fuji Electric Co., Ltd.
- Crane Merchandising Systems (Crane NXT)
- Azkoyen Group
- Evoca Group
- SandenVendo GmbH
- Westomatic Vending Services Ltd.
- Royal Vendors, Inc.
- Seaga Manufacturing, Inc.
- Jofemar S.A.
- Selecta Group
- Cantaloupe Inc. (USA Technologies)
- 365 Retail Markets LLC
- TCN Vending Machine Co., Ltd.
- Guangzhou Baoda Intelligent Technology Co., Ltd.
- Daalchini Technologies Pvt. Ltd.
- Canteen Vending Services (Compass Group)
- Aramark Corporation
- FAS International S.p.A.
- Vending.com (Federal Machine Corp.)
- Vendekin Technologies Pvt. Ltd.
Market Opportunities and Future Outlook
Interoperability and secure connectivity create a tangible whitespace for operators and OEMs seeking to reduce integration friction across mixed fleets. In May 2026, the European Vending and Coffee Service Association (EVA) introduced the SmartLink architecture at Venditalia 2026, positioning an open standard based on OPC UA to connect machines, payment systems, and management software. This approach supports multi-vendor deployments and lowers switching costs for adopting new telemetry, media, or payment modules without replacing the entire machine.
Payments modernization and compliance-driven retrofits continue to expand replacement and upgrade demand across geographies. The UL 751 effective date (June 12, 2026) and the industry move toward cashless-first architectures increase demand for certified readers, secure device management, and software updates, while high cashless penetration in markets such as the United Kingdom (with operators reporting widespread cashless enablement) indicates a large installed base where loyalty, dynamic pricing, and data monetization can be layered on top. On the sustainability side, EU Digital Product Passport infrastructure going live in July 2026 under ESPR creates opportunities for vendors that can provide product data management and traceability across machine components, refurbishments, and end-of-life programs, aligning with circular-economy formats such as reverse vending.
Recent Industry Developments in Vending Machine Market
- May 2026: Seaga Manufacturing acquired Three Square Market from 365 Retail Markets, adding micromarket kiosks, software platforms, and payment technology to its unattended retail portfolio. The divestiture was tied to an FTC-mandated remedy related to 365 Retail Markets' acquisition of Cantaloupe, reshaping platform ownership and competitive positioning in micromarkets and connected vending ecosystems.
- June 2025: Micromarket24 launched MarktGo, an AI-monitored autonomous store inside Bremen Airport, operating 16+ hours daily with predictive theft analytics. The deployment highlights how travel hubs are adopting unattended retail formats that blend vending, micro-market merchandising, and computer-vision driven loss prevention.
- November 2024: Selecta reported a year-on-year revenue decline alongside strong growth in its Foodtech unit, underscoring a shift toward telemetry-enhanced micro-markets and higher-value footprints. The results reinforced the strategic pivot from traditional vending routes toward connected, premium formats where software and service layers contribute more to economics.
Vending Machine Market Report Scope and Research Methodology
Market Definition and Coverage
This market covers revenue generated from vending machines sold and installed for automated dispensing of products and services across public and private locations, measured in current US dollars and tracked across major regions.
Scope exclusions: We exclude non-vending self-checkout retail systems and simple honor-box or unmanned shelf formats that do not use a vending mechanism.
Segments Covered in This Report
- By Technology
- Automatic Vending Machines
- Semi-Automatic Vending Machines
- Smart / IoT-Enabled Vending Machines
- By Product Type
- Snacks and Packaged Food
- Beverages
- Tobacco and Nicotine Products
- Non-Food Essentials (PPE, Electronics, Personal Care)
- Reverse Vending Machines (Recycling)
- By Application / Deployment Location
- Commercial Buildings and Offices
- Transportation Hubs (Airports, Rail, Bus, Metro)
- Educational Institutions
- Healthcare Facilities
- Hospitality and Leisure Venues
- Industrial and Manufacturing Sites
- Others (Residential, Retail Malls)
- By Payment Mode
- Cash
- Card-Based Cashless (Credit/Debit, NFC)
- Mobile Wallet and QR
- Biometric and Facial Recognition
- By Geography
- North America
- United States
- Canada
- Mexico
- Europe
- Germany
- United Kingdom
- France
- Italy
- Spain
- Russia
- Rest of Europe
- Asia-Pacific
- China
- Japan
- India
- South Korea
- Australia
- Rest of Asia-Pacific
- South America
- Brazil
- Argentina
- Rest of South America
- Middle East
- Saudi Arabia
- UAE
- Turkey
- Rest of Middle East
- Africa
- South Africa
- Nigeria
- Rest of Africa
- North America
Data Sources, Market Sizing, and Validation
Desk Research
Desk work started with mapping the installed base and shipment signals by region, and then aligning them with what operators and location owners typically stock. To keep assumptions grounded, we referenced public sources such as the US Census Bureau, Eurostat, UN Comtrade, the International Labour Organization, and central bank FX and inflation series, since these help explain demand pools and pricing movement.
We also reviewed company annual reports, investor decks, and reputable press coverage to understand product mix shifts (food versus beverages, and cashless upgrades) and how service models affect reported revenue. Where needed, paid database subscriptions were used for company financials and intelligence, patent lookups, and shipment-level trade checks to reduce gaps in coverage. The sources listed here are illustrative, and many other public documents and datasets were also referred to for data collection, validation, and research clarification.
Primary Interviews and Surveys
Primary conversations were completed with machine manufacturers, component suppliers, vending operators, route managers, and site owners across key end-use locations, and then used to confirm price bands, restocking economics, and adoption of cashless and smart features. Expert feedback also helped us sanity-check regional mix, typical machine lifetimes, and how revenue is split between new placements and replacements.
Distribution of primary research fieldwork respondents
| Company type | Respondent position | Region |
|---|---|---|
| Top tier: 32% | CXOs: 14% | APAC: 47% |
| Mid tier: 51% | Functional/Unit leaders: 42% | EMEA: 33% |
| Smaller Players: 17% | Managers: 44% | Americas: 20% |
Market-Sizing & Forecasting
Sizing was built using a top-down and bottom-up blend, where top-down demand is reconstructed from the estimated installed base by region and location type, and then multiplied by typical replenishment velocity and value per vend to reach annual revenue. After that, selective bottom-up checks were used, such as sampling average selling price (ASP) by machine type, combining it with shipment volumes and replacement cycles, and then testing totals against operator route density and placement activity.
Key inputs that materially move the model include installed base growth, share of cashless-enabled units, average machine ASP by type, machine life and replacement rate, location penetration in offices and transit hubs, and product mix tilt between beverages and packaged food. When primary inputs came in as ranges, we handled gaps by applying region-specific midpoints and then tightening them using follow-up calls and cross-checks with trade and macro indicators.
For forecasting, scenario analysis was used because the market is sensitive to a few clear drivers, including cashless adoption, labor costs affecting route economics, and consumer traffic recovery patterns. The final outlook was adjusted only when multiple signals pointed the same direction, which keeps the forecast explainable and repeatable.
Data Validation & Update Cycle
Outputs were checked against independent signals such as import trends for vending equipment, regional retail footfall direction, and operator commentary on placement and servicing intensity. Any outliers were reviewed at the region and segment level, and the assumptions behind them were re-tested before sign-off.
Reports are refreshed annually, and interim updates are made when a material event changes pricing, demand, or supply availability. Before delivery, a last-pass review is completed so clients receive the latest updated view.
Mordor Intelligence's Global Vending Machine Market Size Measured Against Other Published Estimates
Published vending machine market values often differ because the counted revenue line is not the same, and the base year can shift depending on when assumptions were last refreshed. Differences also show up when firms mix machine sales with operator services, apply different currency timing, or use aggressive adoption curves for smart and cashless upgrades.
Some estimates bundle operator-side vending sales and broader automated retail revenues into the same total. For Mordor Intelligence, the market total is limited to vending machines and related equipment revenue, and it is anchored to installed base, replacement cycles, and ASP bands confirmed through interviews.
Benchmark comparison
| Source | Market Size | Gaps in Research Methodology |
|---|---|---|
| Mordor Intelligence | USD 26.10 B (2026) | |
| Industry Publisher A | USD 19.41 B (2024) | Uses an earlier base year and a different growth window, and it can apply a narrower equipment definition with limited adjustment for cashless retrofit pricing. |
| Trade Journal B | USD 72.80 B (2024) | Likely reflects operator-side vending sales and broader automated retail activity, which inflates the number versus equipment-focused accounting and can blur revenue attribution across channels. |
Taken together, the spread is mostly explained by what revenue is counted and how the base year is set. Our approach keeps assumptions visible, links totals to repeatable variables like installed base and replacement rate, and then uses primary checks to keep regional totals within realistic operating economics.
Key Questions Answered in the Report
What is the current size of the global vending machine market?
The global vending machine market is valued at USD 26.1 billion in 2026 and is projected to reach USD 33.38 billion by 2031, growing at a 5.04% CAGR.
Which technology segment is expanding the fastest?
Smart/IoT-enabled units post the quickest 9.78% CAGR as operators adopt predictive maintenance, real-time inventory analytics, and cashless payments.
How are sustainability regulations influencing product evolution?
Extended-producer-responsibility laws drive reverse-vending machine deployments, pushing that niche to an 10.71% CAGR and encouraging beverage brands to underwrite collection infrastructure.
Why is Asia-Pacific considered the most attractive growth region?
High urbanization rates, mobile-payment penetration, and supportive government digital-retail initiatives contribute to a 9.86% CAGR outlook across Asia-Pacific.
What role do cashless payments play in market growth?
Mobile wallet and QR transactions are rising at 12.05% CAGR, enhancing customer convenience and enabling richer data analytics for operators, despite higher processing fees.
How concentrated is the competitive landscape?
A market concentration score of 6 suggests moderate consolidation: the top five players control roughly 60% of global revenue, leaving room for regional specialists and software-first disruptors.