
Size and Share of Chemical Industry Valves Market
Market Overview
| Study Period | 2020 - 2031 |
|---|---|
| Market Size (2026) | USD 15.4 Billion |
| Market Size (2031) | USD 18.87 Billion |
| Growth Rate (2026 - 2031) | 4.15% CAGR |
| Fastest Growing Market | Asia-Pacific |
| Largest Market | Asia-Pacific |
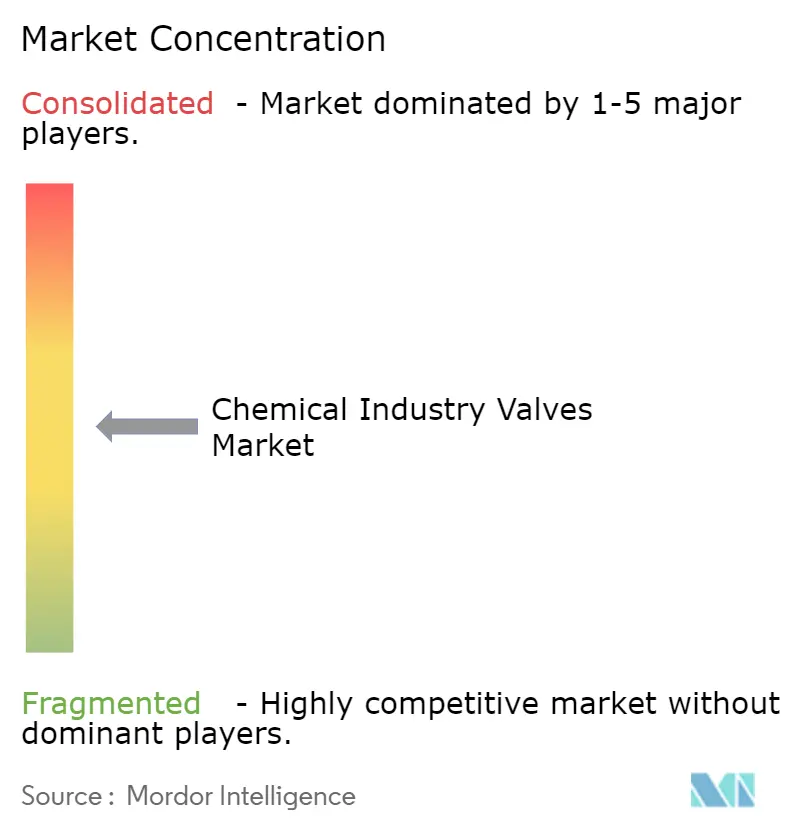
| Market Concentration | Medium |
Major Players *Disclaimer: Major Players sorted in no particular order Image © Mordor Intelligence. Reuse requires attribution under CC BY 4.0. | |
Analysis of Chemical Industry Valves Market by Mordor Intelligence
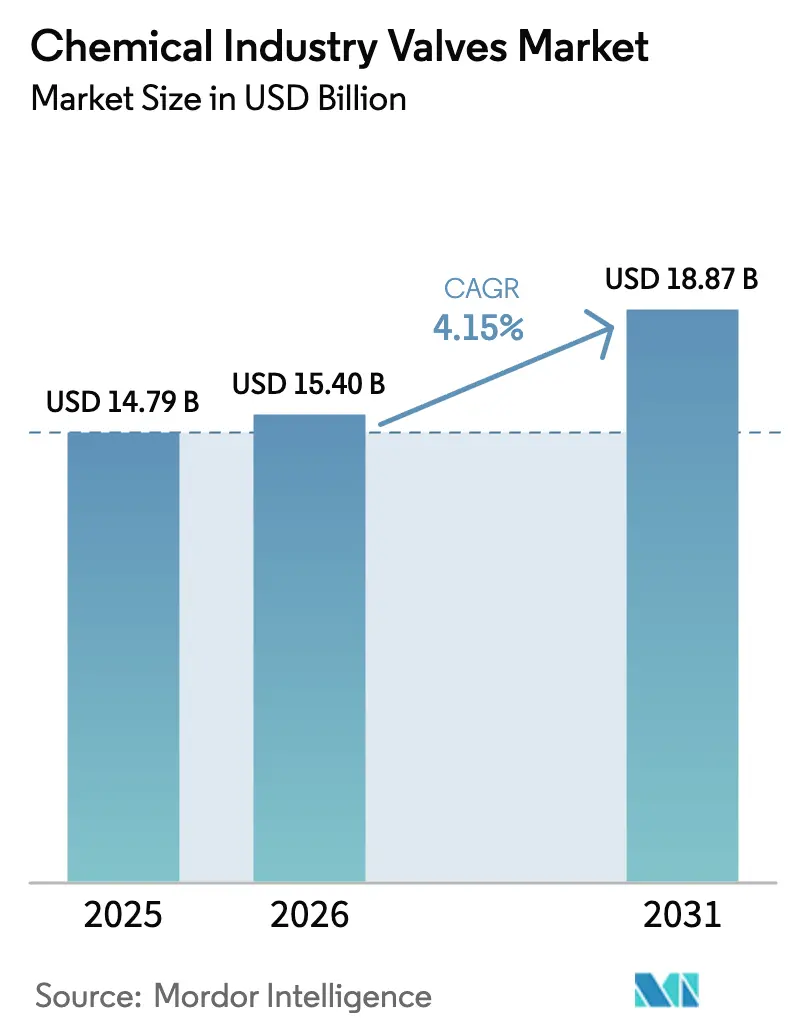
The chemical industry valves market size is expected to grow from USD 14.79 billion in 2025 to USD 15.4 billion in 2026 and is forecast to reach USD 18.87 billion by 2031 at 4.15% CAGR over 2026-2031. Robust capital expenditure on specialty-chemical capacity in Asia-Pacific, accelerating digitization of plant assets, and stricter fugitive-emission standards collectively underpin the expansion path. Suppliers that couple broad valve portfolios with smart IoT-enabled diagnostics are securing long-term frame agreements as producers pursue predictive maintenance strategies. Meanwhile, hydrogen-ready specifications and exotic-alloy demand are reshaping product mixes, even as raw-material price swings and cybersecurity costs temper near-term adoption of fully connected valve architectures.
Key Report Takeaways
- By valve type, ball valves commanded 18.44% of chemical industry valves market share in 2025, whereas vacuum valves are set to deliver the fastest 4.92% CAGR through 2031, buoyed by semiconductor and pharmaceutical uses.
- By material, stainless steel captured 41.29% share in 2025 in chemical industry valves market, yet exotic alloys led by titanium and Hastelloy are expanding at a 5.58% CAGR as green-hydrogen projects require superior corrosion resistance.
- By valve size, vid-range 1-6 inch products accounted for 52.27% of the chemical industry valves market size in 2025, but above-50 inch valves will post the strongest 5.79% CAGR on the back of mega-petrochemical plant builds.
- By actuation technology, pneumatic actuation held 59.19% share in 2025 in chemical industry valves market, while smart IoT-enabled systems are projected to grow 6.12% annually as operators link assets to plant-wide analytics platforms.
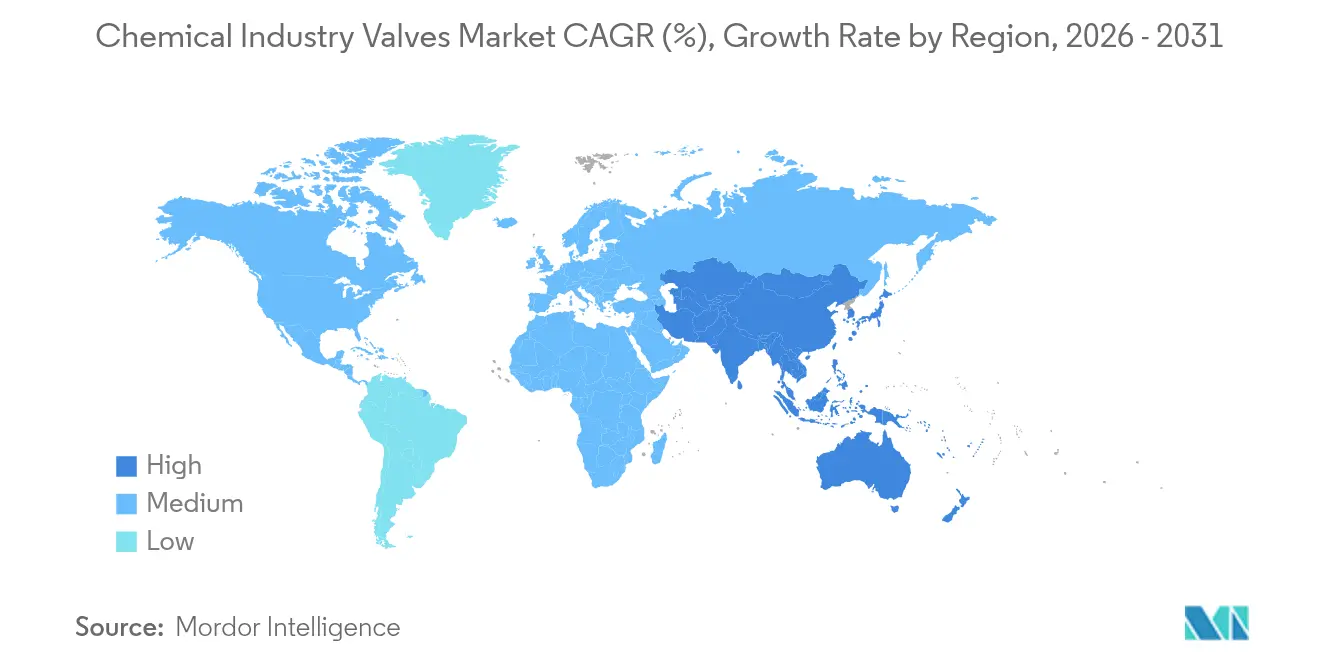
- By geography, Asia-Pacific generated 38.75% of 2025 revenue and is anticipated to compound at 5.35% through 2031 in chemical industry valves market, powered by China’s fine-chemical investments and India’s API production scale-up
Note: Market size and forecast figures in this report are generated using Mordor Intelligence’s proprietary estimation framework, updated with the latest available data and insights as of 2026.
Insights and Trends of Chemical Industry Valves Market
Drivers Impact Analysis*
| Driver | (~) % Impact on CAGR Forecast | Geographic Relevance | Impact Timeline |
|---|---|---|---|
| Rising automation in water and wastewater facilities | +1.2% | Global, with APAC and North America leading adoption | Medium term (2-4 years) |
| Tightening discharge-quality limits drive upgrades | +0.8% | North America and EU, expanding to APAC | Long term (≥ 4 years) |
| Ageing municipal infrastructure replacement cycle | +0.9% | North America and Europe core, emerging in APAC urban centers | Long term (≥ 4 years) |
| Surge in desalination CAPEX, esp. GCC and Australia | +0.7% | GCC, Australia, with spillover to Mediterranean and California | Medium term (2-4 years) |
| Low-power IIoT actuators cut OPEX | +0.4% | Global, concentrated in developed markets initially | Short term (≤ 2 years) |
| Circular-economy push for recyclable valve bodies | +0.3% | EU leading, North America following, APAC selective adoption | Long term (≥ 4 years) |
| Source: Mordor Intelligence | |||
Accelerating Adoption of Industry 4.0 and Smart Control
Digitally enabled valves equipped with pressure, vibration, and position sensors now integrate seamlessly with distributed control systems, allowing predictive maintenance that cuts unplanned downtime by 25–30% while providing the audit trail demanded under API 624 low-emission rules.[1]Emerson Electric Co., “DeltaV Distributed Control System Integration,” Emerson, emerson.com Operators are layering blockchain-based authentication on valve firmware to deter cyber-intrusions, yet annual cyber-insurance outlays ranging from USD 50,000 to 200,000 remain a barrier for smaller chemical plants.[2]Flowserve Corporation, “Smart Valve Technologies and Cybersecurity Solutions,” Flowserve, flowserve.com Vendors are responding with air-gapped architectures that isolate critical safety loops from enterprise networks, balancing performance with risk mitigation. Smart-valve retrofits also streamline workforce allocation as aging technicians retire, easing the chemical industry valves market’s chronic skills shortage. As proof-of-concept pilots convert into multi-site rollouts, the addressable installed base grows rapidly across Asia-Pacific and North America.
Tightening Global HSE Regulations and Emission Norms
API 641, ISO 15848, and the European Union Industrial Emissions Directive have reframed procurement criteria, elevating triple-offset butterfly and metal-seated ball valves capable of leakage rates below 100 ppm.[3]European Commission, “Industrial Emissions Directive 2010/75/EU,” European Commission, europa.eu Fines of USD 100,000-500,000 per violation push operators toward fully certified portfolios, widening the competitive gap between multinationals with extensive qualification data and niche firms facing test costs surpassing USD 2 million per valve family. Compliance mandates are shortening replacement cycles in mature plants and stimulating greenfield demand for hydrogen-ready solutions in Europe and North America. Premium pricing of 20–30% on low-emission designs is offset by avoided penalties and reduced fugitive-emission taxes, reinforcing spec-in momentum.
Specialty-Chemical Capacity Surge in APAC
Asia-Pacific’s fine-chemical build-out features landmark investments such as BASF-PETRONAS’s USD 3.1 billion Malaysian complex that installed more than 15,000 valves, and Rongsheng Petrochemical’s USD 12.2 billion Zhejiang refinery-petrochemical integration consuming nearly 25,000 units. Output of electronic and pharmaceutical intermediates rose 8.2% in China during 2024, fueling demand for exotic alloys tolerant of aggressive media. Although smart-valve penetration lags due to maintenance-skill gaps, rising production complexity is nudging operators toward condition-based monitoring, splitting the regional market between cost-focused pneumatic products and premium digital offerings.
Lifecycle-Cost Optimization Favoring Corrosion-Resistant Valves
Total cost-of-ownership models that capture 15-20-year asset lifecycles reveal that exotic alloys cost 300-400% more than stainless steel yet deliver 5–7× service life in high-acid or chlor-alkali streams. Digital twins simulate degradation paths, enabling valve replacement before wall-thickness thresholds are reached, while extending service intervals by up to 50%. With continuous-process shutdowns costing USD 500,000–2 million per day, the economics favor corrosion-resistant designs, pushing the chemical industry valves market toward lifecycle-value pricing rather than upfront cost comparisons.
Restraints Impact Analysis*
| Restraint | (~) % Impact on CAGR Forecast | Geographic Relevance | Impact Timeline |
|---|---|---|---|
| Supply-chain volatility in nickel and copper alloys | -0.6% | Global, with particular impact on stainless steel and duplex alloy valve production | Short term (≤ 2 years) |
| Skilled-labour shortage delays retrofits | -0.4% | North America and Europe primarily, emerging in APAC developed markets | Medium term (2-4 years) |
| Cyber-security concerns slow smart-valve adoption | -0.3% | Global, concentrated in developed markets with advanced infrastructure | Medium term (2-4 years) |
| Rising PFAS-focused regulations increase qualification costs | -0.2% | North America and EU leading, expanding to APAC regulatory frameworks | Long term (≥ 4 years) |
| Source: Mordor Intelligence | |||
Volatile Nickel/Molybdenum Prices Inflating Alloy Costs
Nickel prices swung 35–40% and molybdenum 25–30% during 2024, driving an 18% hike in nickel-alloy valve quotations according to Shanghai Metals Market. With raw materials representing up to 70% of exotic valve manufacturing cost, suppliers have adopted quarterly price escalators and minimum order sizes to preserve margins. End-users counter by lengthening bid cycles and forward-buying during price dips, injecting demand volatility that complicates production planning. The restraint constrains the uptake of corrosion-resistant materials in cost-sensitive projects, marginally diluting the chemical industry valves market growth trajectory in the short term.
Cyber-Insurance Premiums Curbing Full IoT Adoption
Annual cyber-insurance policies now run USD 50,000–200,000 for chemical facilities deploying connected valve networks, often adding 15–20% to smart-valve total project costs. Carriers also mandate extensive audits and network segmentation that stretch implementation schedules. Smaller producers with limited OT security staff favor partial connectivity and air-gapped critical loops, delaying comprehensive digitization and constraining the installed base for analytics software. Industry groups such as the Chemical Industry Data Exchange are drafting standardized frameworks to lower premiums, but near-term rollout pace remains uneven across regions.
*Our forecasts treat driver/restraint impacts as directional, not additive. The impact forecasts reflect baseline growth, mix effects, and variable interactions.
Segment Analysis
By Valve Type: Ball Valves Retain Leadership Amid Vacuum-Valve Momentum
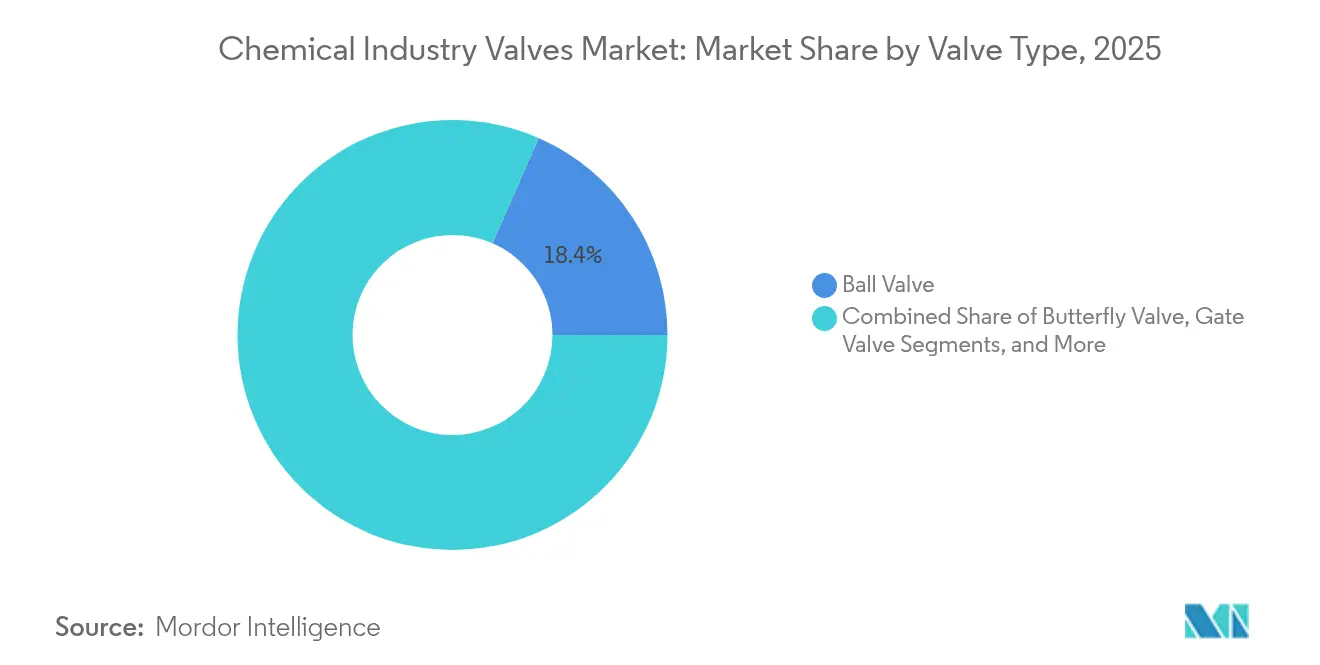
The chemical industry valves market size for ball valves represented USD 2.73 billion in 2025 and held the highest 18.44% share, sustained by reliable shut-off across corrosive media and broad ANSI pressure classes. Multiport and cryogenic variants have further entrenched presence in continuous and batch processes. Vendors bundle ball valves with smart digital positioners that trim maintenance labor by 20%, cementing loyalty among large petrochemical accounts.
Vacuum valves however are projected to outpace all other categories at a 4.92% CAGR through 2031. Semiconductor chemical vapor deposition lines and pharmaceutical freeze-drying chambers demand ultra-low leak rates that gate valves or traditional shuts cannot deliver. Flowserve’s spring-less designs featuring high-purity stainless internals illustrate the capability leap favored by fabs targeting parts-per-billion contamination thresholds. The surge is further supported by governments courting chip investments in China, Japan, and the United States, priming a multiyear vacuum-valve upgrade cycle.


By Material: Stainless Steel Dominance Faces Exotic-Alloy Upswing
Stainless steel retained a commanding 41.29% of chemical industry valves market share in 2025 on its balance of corrosion resistance and cost efficiency. 316L remains the default in neutral-pH organics, while duplex grades expand in chloride-laden streams. Combined spare-parts commonality and global stocking networks reinforce preference among multi-plant operators.
Exotic-alloy demand, particularly titanium and Hastelloy, is set to register a 5.58% CAGR, reflecting green-hydrogen electrolyzer requirements and sulfuric-acid based specialty production. Titanium’s biocompatibility aligns with active pharmaceutical ingredient lines, whereas Hastelloy C-276 delivers longevity in mixed-acid reactors. NACE MR0175 compliance further drives uptake in sour-gas derivatives. The shift widens revenue pools even as price premiums exceed 300%, elevating the chemical industry valves market size for high-alloy categories.
By Valve Size: Mid-Range Volumes Dominate as Mega-Diameter Demand Accelerates
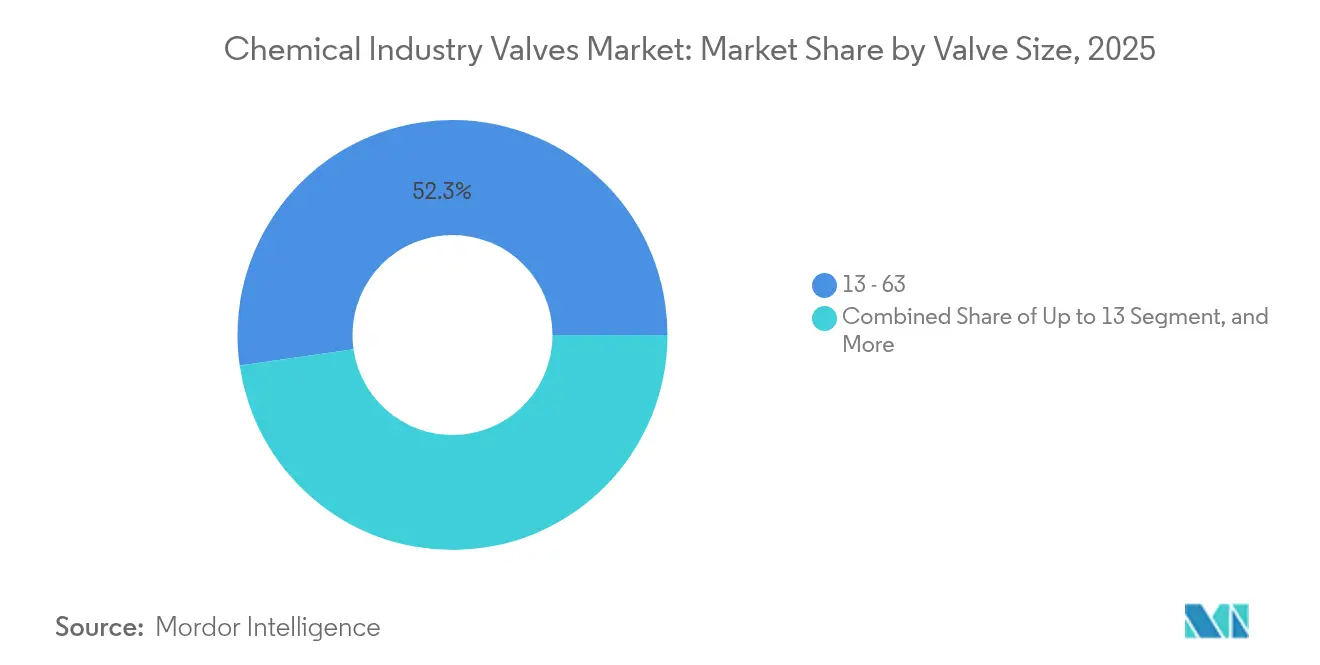
Valves sized 1-6 inches generated over half of 2025 revenue at a 52.27% share, straddling feedstock transfer, utility lines, and auxiliary dosing duties. Their ubiquity enables economies of scale, fostering brisk aftermarket parts turnover and bundled service contracts.
Above-50 inch valves, though niche in unit volume, are forecast to log a 5.79% CAGR, propelled by mega-integrated complexes such as BASF’s acrylic acid lines and Middle East PDH projects. Handling requirements exceeding 10,000 m³/h spur investment in heavy-fabrication shops with robotic submerged-arc welding cells, erecting barriers to entry and raising the chemical industry valves market size premium for large-bore products.
By Actuation Technology: Pneumatic Control Prevails While Smart Platforms Surge
Pneumatic systems represented 59.19% of 2025 revenue thanks to inherent safety in volatile atmospheres and plant-wide compressed-air availability. Fail-safe spring-return designs support safety-integrity-level nodes, while cost points remain attractive in bulk commodity chemicals.
Smart IoT-enabled actuation is forecast for a 6.12% CAGR through 2031. Integrated sensors capture stem-torque trends and seat-wear signatures, enabling operators to defer overhauls by up to 18 months. WirelessHART and ISA-100 gateways lower installation labor, broadening appeal despite cyber-insurance friction. As analytic platforms mature, hardware revenue is increasingly tied to software-as-a-service subscriptions, recalibrating long-term monetization models in the chemical industry valves market.
Geography Analysis
Asia-Pacific generated 38.75% of 2025 revenue, driven by China’s 8.2% rise in specialty-chemical output and India’s pharmaceutical build-out. State-backed projects such as Rongsheng Petrochemical’s Zhejiang complex specify MRI-compliant low-leak valves, while Japanese and South Korean fabs favor ultra-high-purity vacuum variants. Regional OEMs are localizing actuator and casting operations to sidestep import duties, further cementing supply-chain heft.
North America represents the second-largest region, anchored by shale-gas derived petrochemical investments on the U.S. Gulf Coast. Replacement cycles focus on API 624 certified options to satisfy Environmental Protection Agency LDAR programs, with predictive-maintenance retrofits bundling analytics into 2030 budgets. Canada’s blue-hydrogen projects add demand for embrittlement-resistant alloys.
Europe is characterized by regulatory-driven upgrade expenditure under the Industrial Emissions Directive, leading to steady replacement demand for low-fugitive valves. German and Scandinavian chemical clusters are early adopters of additive-manufactured spare parts, while United Kingdom sites prioritize cybersecurity- fortified actuators post-NIS 2 directive.

Regulatory Landscape
Compliance in chemical service valves is increasingly shaped by fugitive-emissions control and pressure-safety conformity requirements that affect specification and documentation. In the United States, the Environmental Protection Agency finalized amendments to the NESHAP Chemical Manufacturing Area Sources (CMAS) rule (published in the Federal Register on April 1, 2026). The update includes requirements for annual leak detection and repair monitoring for valves in gas/vapor and light liquid service, alongside electronic reporting via EPA systems for key compliance submissions.
In Europe, the Pressure Equipment Directive (PED) 2014/68/EU continues to anchor conformity assessment for metallic valves used as pressure accessories, with harmonized standards serving as the main route to demonstrate essential safety requirements. The European Commission Implementing Decision (EU) 2026/79 (January 2026) updated the list of harmonized standards supporting PED compliance and explicitly referenced EN 16668:2025, reinforcing the role of standardized testing and traceable technical files for market access across EU chemical processing projects.
Value Chain Analysis
The value chain starts with raw-material inputs, including stainless steels and nickel-based and exotic alloys such as titanium and Hastelloy, as well as sealing materials and coatings. It then moves through foundry/casting and forging, machining and finishing, and finally assembly with actuation and controls, such as pneumatic/electric actuators, positioners, solenoids, and sensor-enabled controllers. Qualification against low-emission and pressure-equipment requirements, together with documentation packages and traceability, is a midstream step that can extend lead times for severe-service and specialty-material valves used in corrosive or hazardous chemical duties.
On the downstream side, distribution and fulfillment increasingly blend EPC and greenfield project supply with aftermarket services, spares, and digital maintenance programs that help keep installed bases compliant and operational. Service-led agreements show how value is moving with the installed base: Valmet signed a nationwide strategic agreement with Petrobras in August 2025 to supply spare parts for Neles valves, actuators, and positioners across operational units. TotalEnergies and Emerson announced a July 2025 collaboration to deploy Emersons AspenTech Inmation industrial data fabric across global sites, reinforcing integration of valve and asset data into plant performance workflows. Chemical operators are also using supply chain digitization and orchestrated procurement models, including the September 2025 Agilis and Elemica partnership for integrated digital commerce and supply chain execution, which supports real-time consumption visibility and inventory optimization for maintenance-driven demand.
Competitive Landscape
Competitive intensity in the chemical industry valves market remains moderate. Emerson, Flowserve, and Schlumberger collectively hold a combined 42% revenue share, leveraging digital twin platforms that cut bid-to-delivery lead times by 30%. Flowserve’s 2024 acquisition of Mogas expanded severe-service coverage, underpinning its strategy to upsell high-temperature coking valves. Emerson’s DeltaV integration embeds analytics at the control-system layer, boosting switching costs for end users.
Mid-tier specialists such as Metso, Alfa Laval, and HEROSE target niche growth pockets. Metso’s 2024 purchase of Jindex brought advanced actuator IP, while HEROSE capitalizes on early hydrogen-ready certifications. Additive manufacturing disruptors provide rapid spare-part fulfillment, compressing aftermarket response times and challenging traditional stocking models.
Strategic partnerships between valve OEMs and cloud-platform providers like Microsoft Azure or AWS extend asset-performance dashboards across multi-site portfolios. Vendors that demonstrate certified cybersecurity stacks alongside API 6A, 6D, and ISO 15848 credentials are winning preferred-supplier status. Consequently, inorganic expansion and digital-service layering will shape competitive positioning through 2030.
Leaders of Chemical Industry Valves Market
Emerson Electric Co.
Schlumberger Limited
Alfa Laval Corporate AB
Flowserve Corporation
Crane Holdings, Co.
- *Disclaimer: Major Players sorted in no particular order

Market Opportunities and Future Outlook
Leak monitoring, digital documentation, and compliance-centric retrofits remain a measurable whitespace across the installed base, since regulatory requirements emphasize structured LDAR routines and auditable reporting. The April 2026 US EPA final CMAS amendments, which include annual LDAR monitoring for valves in gas/vapor and light liquid service and electronic reporting, raise the practical value of smart positioners, diagnostics, and data capture that reduce manual inspection load and consolidate compliance records across multi-unit chemical sites.
Smart control capabilities are also moving closer to the valve through embedded analytics, creating room for suppliers to package controllers, connectivity, and services without requiring full plantwide IT overhauls. In May 2026, Valmet introduced Neles valve controllers using Edge AI calculations to generate pre-calculated performance summaries and support fleet monitoring via HART communication, highlighting a pathway for condition-based maintenance in mixed pneumatic installed bases. Hydrogen, cryogenics, and severe service portfolio premiumization is another active pocket, supported by new product introductions such as Emersons Fisher IC2 cryogenic top-entry control valve (April 2026) for cold box applications, which aligns with hydrogen-ready and low-leak performance specifications being written into chemical and adjacent process projects.
Recent Industry Developments
- April 2026: Emerson introduced the Fisher IC2 cryogenic top-entry control valve for cold box applications used in air separation and hydrogen liquefaction services. The launch expands options for low-leakage performance in cryogenic duties where chemical and energy-transition value chains require tighter containment and repeatable control.
- November 2025: Emerson enhanced the ASCO Series 327C solenoid valve with Intrinsically Safe and Manual Reset constructions positioned for chemical processing environments. These configurations support hazardous-area installation needs while improving the robustness of shutdown and reset behavior in safety-critical pneumatic control loops.
- November 2024: Crane Company completed the acquisition of Technifab Products, Inc., expanding its cryogenic valve and vacuum insulated pipe capabilities. The deal strengthens coverage for cryogenic and low-temperature process applications that intersect with specialty chemicals and hydrogen-related infrastructure.


Research Methodology Framework and Report Scope
Market Definition and Coverage
For this report, the market covers valves sold for use inside chemical industry plants and units where fluids and gases are handled, controlled, or isolated during production, storage, and transfer. We count market value at the point of sale for valve products used for chemical processing duties across regions.
Scope exclusions: We exclude broader plant spending such as piping, pumps, instrumentation-only fittings, and installation labor unless it is priced as part of the valve product sale.
Segmentation Overview
- By Valve Type
- Ball
- Butterfly
- Gate
- Globe
- Check
- Plug
- Diaphragm
- Vacuum
- Hybrid
- Other Valve Types
- By Material
- Stainless Steel
- Cast Iron
- Alloy-Based
- Plastic / PVC
- Cryogenic-Grade
- Exotic Alloys (Ti, Hastelloy)
- By Valve Size (Inches)
- Up to 1″
- 1″ – 6″
- 6″ – 25″
- 25″ – 50″
- Above 50″
- By Actuation Technology
- Manual
- Pneumatic
- Electric
- Hydraulic
- Smart (IoT-enabled)
- By Geography
- North America
- United States
- Canada
- Mexico
- South America
- Brazil
- Argentina
- Rest of South America
- Europe
- Germany
- United Kingdom
- France
- Italy
- Spain
- Rest of Europe
- Asia-Pacific
- China
- India
- Japan
- South Korea
- ASEAN
- Rest of Asia-Pacific
- Middle East and Africa
- Middle East
- United Arab Emirates
- Saudi Arabia
- Rest of Middle East
- Africa
- South Africa
- Nigeria
- Rest of Africa
- Middle East
- North America
Data Sources, Market Sizing, and Validation
Desk Research
Desk research starts by mapping where chemical-industry demand is coming from, and how it links to valve consumption by type, material, and actuation needs. We used public references such as the US EPA (air rules that influence fugitive emissions control), Eurostat (chemical production indicators), UN Comtrade (trade flows for relevant valve HS codes), and OECD industry statistics to understand regional output patterns.
To keep the model grounded in real buying behavior, we also reviewed sources like USGS mineral and alloy references for metal inputs, peer-reviewed corrosion and process safety literature, plus annual reports and investor presentations from valve makers and distributors. Where available, we supplemented with paid subscriptions for company financials, news and filings, and patent databases to verify product mix shifts like automation features or specialty alloys. These desk sources are not exhaustive, and we used additional public documents to compile data, validate assumptions, and clarify edge cases.
Primary Interviews and Surveys
Primary work focused on checking what is actually being specified and purchased in chemical plants, and then stress testing pricing and replacement cycles. We spoke with a mix of valve manufacturers, channel partners, EPC-linked experts, and end-user maintenance and reliability teams to fill data gaps around material upgrades, automation adoption, and typical lead times across regions.
Distribution of primary research fieldwork respondents
| Company type | Respondent position | Region |
|---|---|---|
| Top tier: 38% | CXOs: 12% | APAC: 52% |
| Mid tier: 44% | Functional/Unit leaders: 39% | EMEA: 30% |
| Smaller Players: 18% | Managers: 49% | Americas: 18% |
Market-Sizing & Forecasting
Sizing is built using a top-down and bottom-up blended logic, where chemical production and capacity additions are translated into valve demand pools and then reconciled with supplier and channel signals. The top-down side uses regional chemical output trends, plant capacity utilization, and capex cycles to estimate new-build needs, followed by a maintenance and replacement layer that reflects installed base intensity.
To keep the numbers realistic, we corroborate totals with selective bottom-up checks such as sampled price bands by valve type and size, mix splits for corrosion-resistant materials (like stainless and higher alloy grades), and the share of automated or smart actuation used in critical services. Other practical inputs that improve fit include emission control compliance activity, typical shutdown and turnaround schedules, and trade flows for valve categories that often backfill local production gaps. Forecasts are built using scenario analysis supported by expert consensus on the direction of capex, alloy price pass-through, and automation penetration, and then we test the outcome year by year so the growth path stays consistent with what buyers report.
Data Validation & Update Cycle
Validation happens in layers, starting with internal checks for outliers by region, valve type, and major input assumptions, and then comparing results against independent demand signals like chemical output trends and trade movement. When a variance looks large, we revisit the drivers behind it, and we re-contact relevant interviewees if the issue ties to pricing, mix shifts, or timing of large projects.
Before sign-off, the model goes through analyst review steps to confirm unit logic, currency conversion treatment, and the reasonableness of the implied average selling prices. Reports are refreshed annually, and interim updates are made when material events occur such as sharp raw material moves, regulatory enforcement shifts, or sudden capex slowdowns. Right before delivery, we run a final pass so clients receive an updated view that reflects the latest public releases and field feedback.
Mordor Intelligence's Chemical Global Valves Market Size Measured Against Other Published Estimates
Different published market sizes can look far apart even when they talk about valves for chemical plants, because the refresh date, currency timing, and how pricing is averaged across materials often change the final value. We also see gaps when some studies lean heavily on one demand signal, like trade or production, without checking if it matches replacement cycles and project timing.
Key gap drivers in this market usually come from how specialty alloys and automated actuation are priced, and whether the boundary includes adjacent categories like fittings or bundled service work. The table points to this spread, and it is reduced when assumptions are rechecked close to publication and exchange rate timing is aligned, a cadence and pricing logic applied by Mordor Intelligence.
Benchmark comparison
| Source | Market Size | Gaps in Research Methodology |
|---|---|---|
| Mordor Intelligence | USD 14.79 B (2025) | |
| Trade Journal A | USD 15.40 B (2026) | Uses the next-year value as the headline and often carries forward a single blended global ASP, which can overstate regions with lower alloy and automation mix in a given year. |
| Industry Data Publisher B | USD 13.00 B (2025) | More restrictive scope around what qualifies as chemical-industry demand, and limited adjustment for higher-priced corrosion services, thereby pulling down the implied ASP for the same year. |
Across the three figures, most of the difference comes from year labeling and the way average prices are built up from material and actuation mix. Our approach keeps assumptions traceable to chemical output, replacement needs, and interview-verified pricing bands, which makes the final market value easier to reproduce and explain.


Key Questions Answered in the Report
How fast is the chemical industry valves market expected to grow through 2031?
Revenue is forecast to rise from USD 15.4 billion in 2026 to USD 18.87 billion by 2031, posting a 4.15% CAGR.
Which valve type contributes the most revenue today?
Ball valves lead with 18.44% share of 2025 sales, owing to versatile shut-off performance across corrosive chemistries.
What is driving demand for exotic-alloy valves?
Green-hydrogen electrolyzer build-outs and aggressive acid processes demand titanium and Hastelloy designs that last 5–7× longer than stainless steel.
Why are cyber-insurance costs a concern for smart-valve adoption?
Policies run USD 50,000-200,000 annually and add 15-20% to project budgets, pushing smaller plants toward partial connectivity.
Which region offers the strongest growth outlook?
Asia-Pacific is projected to record a 5.35% CAGR through 2031, powered by specialty-chemical and pharmaceutical investments.
Page last updated on:






