Market Overview
| Study Period | 2017 - 2030 |
|---|---|
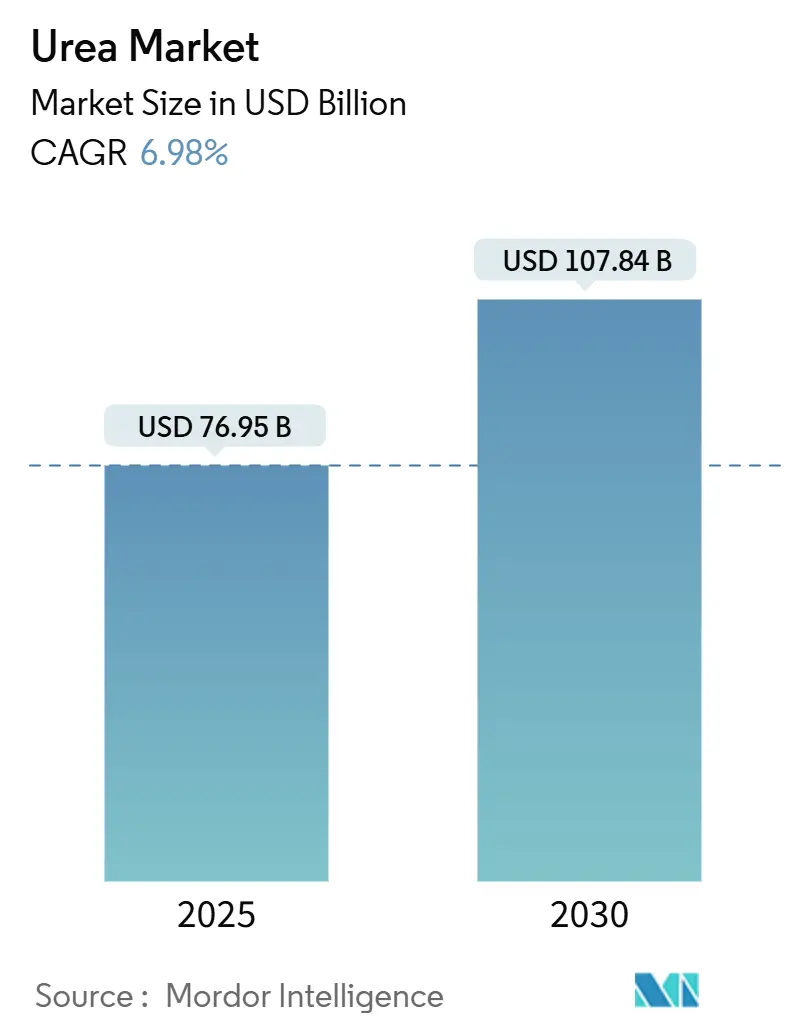
| Market Size (2025) | USD 76.95 Billion |
| Market Size (2030) | USD 107.84 Billion |
| Growth Rate (2025 - 2030) | 6.98% CAGR |
| Fastest Growing Market | Middle East and Africa |
| Largest Market | Asia-Pacific |
| Market Concentration | Low |
Major Players*Disclaimer: Major Players sorted in no particular order Image © Mordor Intelligence. Reuse requires attribution under CC BY 4.0. |
|
Urea Market Analysis by Mordor Intelligence
The urea market size is USD 76.95 billion in 2025 and is forecast to reach USD 107.84 billion in 2030, advancing at a 6.98% CAGR during the period. Rapid cereal acreage expansion and the first commercial green hydrogen projects are reshaping production economics while keeping demand on an upward trajectory.[1]Source: Food and Agriculture Organization, “World Food Situation – Cereal Supply and Demand Brief,” FAO, fao.org Producers with long-term natural gas contracts protect margins during price spikes, yet distributed port-side plants and renewable-powered ammonia units are beginning to reset regional cost curves. In parallel, governments tighten runoff rules, which steer demand toward coated and stabilized products that command higher average selling prices. These converging forces encourage strategic hedging in feedstock sourcing, deeper integration with logistics assets, and accelerated R&D in enhanced‐efficiency fertilizer formulations.
Key Report Takeaways
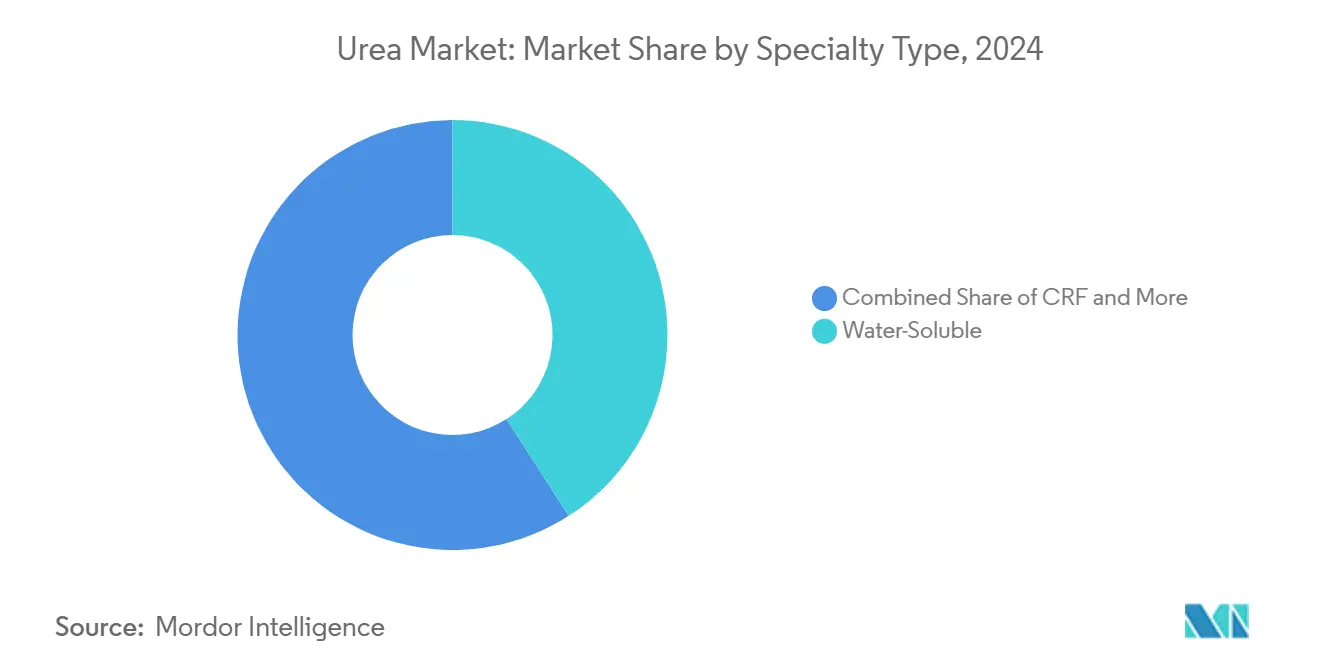
- By Specialty Type, water-soluble captured 40.9% of the specialty urea market share in 2024, and Controlled Release Fertilizer is projected to expand at a 7.6% CAGR through 2030.
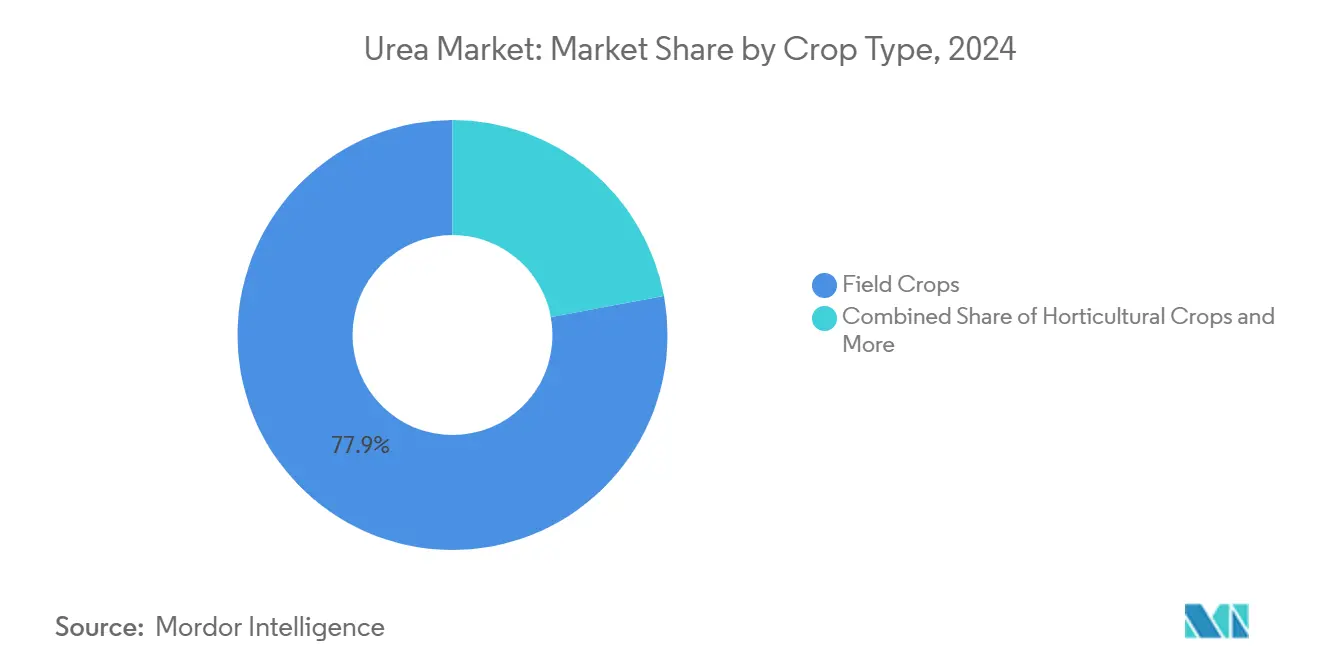
- By Crop Type, field crops held 77.9% of the urea market size in 2024, while horticultural crops demand is forecast to rise at an 8.8% CAGR to 2030.
- By Form, conventional fertilizer accounted for a 93.2% share of the urea market size in 2024 and is advancing at a 7.0% CAGR through 2030.
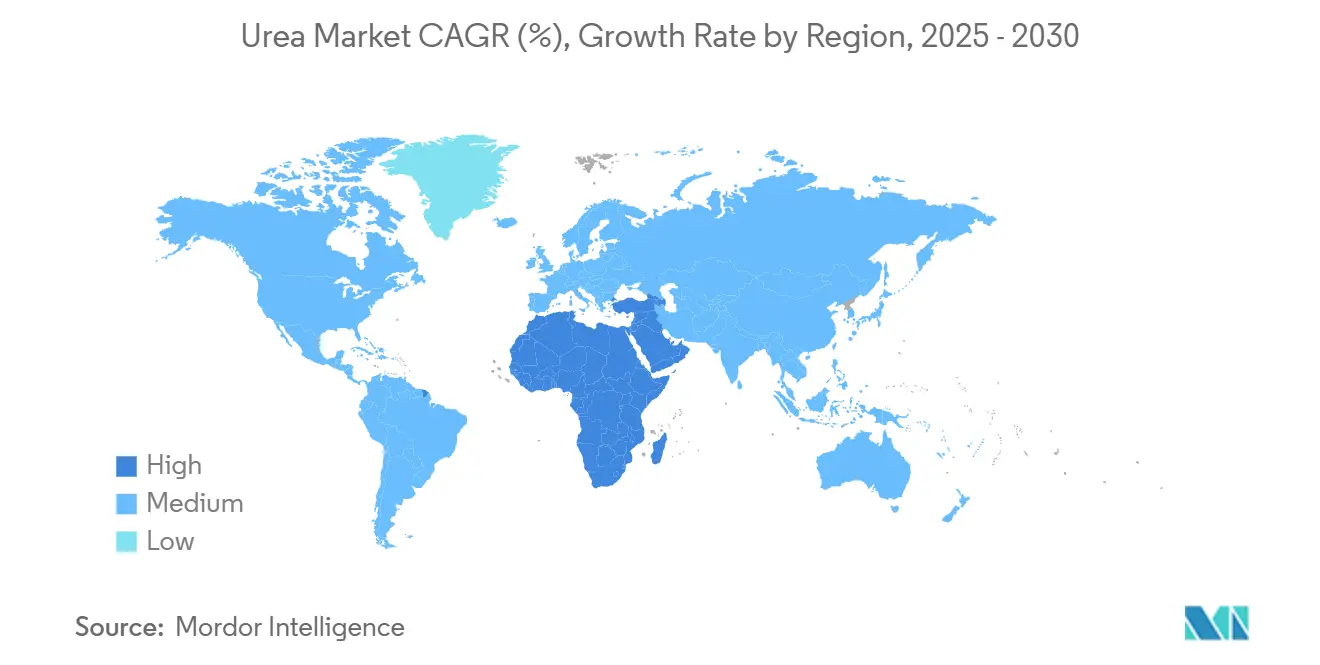
- By Geography, Asia-Pacific commanded 45.3% of 2024 revenue, while the Middle East and Africa region is set to post the fastest 9.46% CAGR between 2025 and 2030.
Global Urea Market Trends and Insights
Drivers Impact Analysis
| Driver | (~) % Impact on CAGR Forecast | Geographic Relevance | Impact Timeline |
|---|---|---|---|
| Intensifying cereal crop cultivation | +1.8% | Asia-Pacific and Africa | Medium term (2-4 years) |
| Fertilizers reliance on nitrogen as a key nutrient | +1.2% | North America and Europe, expanding to Asia-Pacific | Short term (≤2 years) |
| Cost advantage of urea versus other nitrogen fertilizers | +1.0% | Global | Long term (≥4 years) |
| Growing preference for granular urea in precision farming | +0.8% | North America and Europe, expanding to Asia-Pacific | Medium term (2-4 years) |
| Renewable-hydrogen-based green urea capacity additions | +0.6% | Europe and the Middle East | Long term (≥4 years) |
| Port-side modular urea plants lowering logistics costs | +0.4% | Coastal regions worldwide | Medium term (2-4 years) |
| Source: Mordor Intelligence | |||
Understand The Key Trends Shaping This Market
Download PDF
Intensifying Cereal Crop Cultivation Worldwide
Escalating global cereal acreage keeps nitrogen demand on a solid climb as farmers strive to meet a 28% production increase by 2030. High‐yield wheat, rice, and maize programs in India, China, and parts of Africa absorb large volumes of granular urea that are compatible with GPS-guided spreaders. India’s nano urea rollout shows how dosage optimization can reduce environmental load without cutting nutrient supply. Government input subsidies in Sub-Saharan Africa further lift application rates and introduce smallholder farmers to coated products that slow nitrogen release. Brazil’s Plano Nacional de Fertilizantes backs domestic capacity to curb import reliance while supporting expanding soybean and corn acreages. Favorable commodity prices sustain acreage gains, strengthening long-run consumption fundamentals for the urea market.
Fertilizers reliance on nitrogen as a key nutrient
Globally, crops such as corn, rapeseed, cotton, sorghum, rice, wheat, and soybeans are major consumers of essential nutrients. In 2024, these key crops exhibit varying nutritional requirements, with an average application rate of primary nutrients ranging from 120.97 kg/ha to 255.75 kg/ha. These nutrients are critical for supporting plant metabolic processes and the development of essential tissues, including cells, membranes, and chlorophyll. Nitrogen remains the most widely applied nutrient, with an average application rate of 224.6 kg/ha. As the cultivation area for field crops continues to expand, particularly in South America and the Asia-Pacific regions, regions such as Europe and North America, facing nutrient deficiencies, are increasingly adopting urea specialty fertilizers due to their efficiency.
Cost Advantage of Urea Versus Other Nitrogen Fertilizers
Urea delivers every kilogram of nitrogen at 15-20% lower cost than ammonium nitrate and 25-30% below UAN, according to IFA benchmark calculations. The 46% nutrient concentration trims freight costs per nutrient unit, which is especially vital for landlocked importers. Middle Eastern exporters maintain structural cost leadership through subsidized gas and scale economies. Conversely, Europe’s gas price spikes above EUR 300 per MWh (USD 324 per MWh) in 2022 forced temporary shutdowns that underscored exposure for stand-alone producers. Carbon pricing and emerging green hydrogen routes may narrow the differential, yet urea’s favorable cost profile sustains its first-choice status in price-sensitive regions.
Growing Preference for Granular Urea in Precision Farming
Granular formulations offer tighter size uniformity and lower caking tendencies, which align with variable-rate spreaders that now cover 70% of U.S. corn and soybean hectares. Yield gains of 8-12% from precise placement offset higher product costs, and polymer-coated granular variants further reduce leaching losses. European Union nutrient directives accelerate this transition by rewarding enhanced-efficiency fertilizers with compliance credits. The technology split creates a two-tier market where commodity prills continue serving broadcast applications while premium granular urea meets precision agriculture demand at a 10-15% price uplift.
Restraints Impact Analysis
| Restraint | (~) % Impact on CAGR Forecast | Geographic Relevance | Impact Timeline |
|---|---|---|---|
| Natural gas price volatility raising production costs | -1.5% | Europe and Asia | Short term (≤2 years) |
| Tightening runoff and greenhouse gas regulations on nitrogen use | -1.0% | Europe and North America | Long term (≥4 years) |
| Substitution threat from ammonium nitrate and UAN | -0.6% | North America and Europe | Medium term (2-4 years) |
| Geopolitical trade-route disruptions | -0.4% | Import-dependent regions | Short term (≤2 years) |
| Source: Mordor Intelligence | |||
Natural Gas Price Volatility Raising Production Costs
Feedstock accounts for up to 80% of ex-works urea pricing. When European benchmark gas cleared EUR 300 per MWh (USD 324 per MWh) in 2022, several plants idled rather than operate at negative margins. Producers with upstream integration, such as SABIC in Saudi Arabia, preserve profitability through captive gas. Others deploy hedging programs, yet still confront cash burn when spot spikes surpass hedge coverage. This volatility quickens the shift toward regions with stable gas supply, stimulates adoption of ammonia imports for modular plants, and rekindles interest in renewable hydrogen at declining power tariffs.
Tightening Runoff and Greenhouse Gas Regulations on Nitrogen Use
The European Nitrates Directive caps total nitrogen application at 170 kg per hectare, and new farm-to-fork rules add soil testing and closed-period spreading bans. California sets groundwater protection limits, while China pilots mandatory nutrient management plans. These policies curb bulk urea volumes in mature markets but open windows for coated products that optimize uptake. Compliance raises farming costs, which nudges growers toward integrated nutrient service packages that pair data analytics with reduced-rate fertilizers.
Segment Analysis
Speciality Type: Water-Soluble Urea Leads, Controlled-Release Urea Exhibits Rapid Growth
Water-soluble urea fertilizers have emerged as the dominant segment in the specialty urea fertilizers market, commanding 40.9% market share in 2024. Urea, being rich in nitrogen and easily soluble in water, significantly enhances nitrogen uptake by plant roots, thereby stimulating growth. The segment's dominance is primarily driven by shifting climatic patterns, including droughts, heatwaves, and escalating water scarcity worldwide, which have curtailed nitrogen availability in soils. Farmers increasingly prefer water-soluble urea fertilizers as they ensure a consistent nitrogen supply while mitigating nitrogen leaching, volatilization, and associated risks of environmental pollution and groundwater contamination.
Controlled-release urea is the fastest-growing segment with a CAGR of 7.6% during the forecast period 2025-2030, as farmers and agribusinesses increasingly adopt efficiency-enhancing inputs to reduce nitrogen losses and comply with sustainability standards. Polymer-coated and polymer sulfur-coated formulations provide extended nutrient release, minimizing leaching and volatilization while improving labor efficiency through reduced application frequency. This growth is further driven by regulatory requirements for nutrient management and the rising use of controlled-release fertilizers in cereals, oilseeds, and specialty crops. The demand for controlled-release urea is accelerating year-on-year as growers aim to achieve higher productivity with reduced environmental impact.
Note: Segment shares of all individual segments available upon report purchase
Get Detailed Market Forecasts at the Most Granular Levels
Download PDF
Crop Type: Field Crops Lead Urea Use, Horticulture Drives Fastest Growth
Field crops represent the dominant segment in the global urea market, accounting for approximately 77.9% of the total market value in 2024. This substantial market share is primarily attributed to the extensive cultivation of field crops worldwide, which occupies more than 95% of global agricultural land. Rice, wheat, and corn are the major field crops driving urea consumption, collectively accounting for about 38% of total agricultural land. The segment's dominance is further reinforced by the higher nitrogen requirements of field crops compared to other crop types, with rapeseed being a major urea-consuming crop requiring an average nutrient application rate of 347.4 kg/ha. In countries like Canada, about 32% of field crop growers utilize urea fertilizers in their cultivation practices, highlighting the segment's strong market presence.
The horticultural segment is experiencing the fastest growth in urea consumption, with a projected CAGR of 8.8% during the forecast period. Farmers are placing greater emphasis on quality, nutrient balance, and precision feeding. High-value horticultural crops require more frequent and calibrated nitrogen applications, often delivered through fertigation or controlled irrigation systems, driving increased urea usage. Additionally, the rising demand for premium produce, the expansion of protected cultivation, and a shift toward input-efficient nutrient management are contributing to horticulture's position as the fastest-growing consumer of urea in recent years.
Note: Segment shares of all individual segments available upon report purchase
Get Detailed Market Forecasts at the Most Granular Levels
Download PDF
Form: Conventional Leads, Specialty Urea Grows Fastest
Conventional urea fertilizers maintain their dominant position in the global urea market, commanding approximately 93.2% of the total market value in 2024. This dominance can be attributed to several key factors, including their significantly lower cost compared to specialty variants, widespread availability across agricultural markets, and substantial government subsidies in major agricultural nations. The segment's strong market position is further reinforced by the extensive distribution networks established by major manufacturers and the familiarity of farmers with conventional urea application methods. Additionally, conventional urea's high nitrogen content of 46%, which is the highest among solid nitrogenous fertilizers, makes it a cost-effective choice for farmers seeking to optimize their crop yields while managing input costs effectively.
Specialty urea products are the fastest-growing segment, with a CAGR of 7.6% during the forecast period, driven by the market's focus on efficiency and environmentally sustainable nutrient solutions. These fertilizers enhance nitrogen-use efficiency, minimize losses, and improve crop responsiveness, making them particularly appealing for high-value crops and precision farming systems. Increased regulatory scrutiny on nitrogen emissions, combined with growers' emphasis on optimizing returns through targeted nutrition, is significantly boosting the adoption of specialty urea products.

Note: Segment shares of all individual segments available upon report purchase
Get Detailed Market Forecasts at the Most Granular Levels
Download PDF
Geography Analysis
Asia-Pacific accounted for 45.3% of 2024 revenue, driven by intensive cereal cultivation in China and India. Growth is further supported by expanding acreage and the adoption of mechanized fertilizing equipment in Vietnam, Indonesia, and the Philippines. In China, fertilizer reduction mandates are encouraging the use of nano urea and coated products, leading to higher spending per hectare despite stable total nutrient tonnage. In India, subsidy reforms promote balanced nutrient management, increasing demand for higher-value formulations over generic prills. Additionally, the ASEAN hydrogen roadmap is preparing the region for low-carbon ammonia imports, which could support future green urea production.
The Middle East and Africa are the fastest-growing regions, with a projected CAGR of 9.4%. Growth is driven by capacity expansions in Saudi Arabia, the UAE, and Nigeria, supported by low-cost gas that enhances export competitiveness. Local farm subsidy programs are also boosting demand in inland areas. Nigeria’s Dangote complex serves both domestic and West African markets, reducing dependency on offshore imports. Gulf Cooperation Council countries are exploring solar-powered electrolyzers for green ammonia production, positioning themselves to attract carbon-conscious buyers in Europe and Asia. However, infrastructure gaps and political instability in parts of Sub-Saharan Africa pose challenges, though donor-backed agronomic extension programs continue to support fertilizer adoption.
North America and Europe exhibit mature but steady growth trajectories. In North America, shale gas ensures that fertilizer plants remain among the first-quartile cost producers, sustaining export flows to Latin America. In Europe, stricter farm policies on nutrient caps are driving the adoption of granular coated products. Import terminals in Germany and Belgium are expanding sourcing options, with ammonia imports from North Africa and the Middle East compensating for reduced local production during periods of high gas prices.
Get Analysis on Important Geographic Markets
Download PDF
Competitive Landscape
The competition in the market is fragmented, with Yara International leading through its extensive global terminal network and early initiatives in green ammonia projects. OCI NV follows closely, leveraging its integrated ammonia production capacity. CF Industries has strengthened its position as the largest North American exporter by increasing output through debottlenecking efforts in Louisiana. Nutrien has expanded its presence in South America by acquiring Agrichem, enhancing downstream demand for its Canadian production. SABIC Agri-Nutrients has improved process technology at its Al Jubail facility, reducing energy intensity by 15% and enhancing its cost competitiveness.
Emerging markets are witnessing significant consolidation, driven by a surge in mergers and acquisitions. Companies are not only pursuing acquisitions but are also focusing on vertical integration. By incorporating upstream raw material suppliers and downstream distribution networks, they are solidifying their market positions. Additionally, manufacturers are increasingly collaborating with agricultural service providers to offer comprehensive solutions tailored to farmers' needs.
Established companies are focusing on sustainable production methods and innovative product formulations to maintain their market leadership. Investments in research and development, particularly in controlled-release technologies for more efficient fertilizers, have become critical. Companies are also strengthening their distribution networks and establishing direct-to-farmer channels to enhance market penetration. Furthermore, building strong partnerships with agricultural cooperatives and implementing farmer education programs have become essential strategies for sustaining market presence.
Urea Industry Leaders
-
CF Industries Holdings, Inc.
-
Nutrien Ltd.
-
OCI NV
-
SABIC Agri-Nutrients Co.
-
Yara International ASA
- *Disclaimer: Major Players sorted in no particular order
Need More Details on Market Players and Competitors?
Download PDF
Recent Industry Developments
- November 2024: National Fertilizers (NFL), India, a government-owned enterprise, has announced the commencement of nano urea production at its Nangal plant. The company plans to produce 150,000 bottles, each containing 500 ml, daily at this facility.
- July 2023: Urea Gold, an innovative fertilizer with a sulfur coating, is touted to be more economical and efficient than its neem-coated counterpart. It boosts nitrogen use efficiency in plants, curtails fertilizer consumption, and elevates crop quality.
- April 2023: SABIC Agri-Nutrients Company acquired the ETC Group (ETG) with a 49% stake in the ETG Inputs Holdco Limited for a transaction value of USD 320 million. The agreement is part of SABIC Agri-Nutrients Company's strategy to integrate the value chain and distribution of agri-nutrients markets.
Global Urea Market Report Scope
The Urea Market Report Segments the Industry Into Speciality Type (CRF, Liquid Fertilizer, SRF, and Water Soluble), Crop Type (Field Crops, Horticultural Crops, and Turf & Ornamental), Form (Conventional and Speciality), and Region (Asia-Pacific, Europe, Middle East & Africa, North America, and South America). The Market Size is Provided in Terms of Value(USD) and Volume(Metric Tons).
Speciality Type
| CRF | Polymer Coated |
| Polymer-Sulfur Coated | |
| Others | |
| Liquid Fertilizer | |
| SRF | |
| Water Soluble |
Crop Type
| Field Crops |
| Horticultural Crops |
| Turf & Ornamental |
Form
| Conventional |
| Speciality |
Region
| Asia-Pacific | Australia |
| Bangladesh | |
| China | |
| India | |
| Indonesia | |
| Japan | |
| Pakistan | |
| Philippines | |
| Thailand | |
| Vietnam | |
| Rest of Asia-Pacific | |
| Europe | France |
| Germany | |
| Italy | |
| Netherlands | |
| Russia | |
| Spain | |
| Ukraine | |
| United Kingdom | |
| Rest of Europe | |
| Middle East & Africa | Nigeria |
| Saudi Arabia | |
| South Africa | |
| Turkey | |
| Rest of Middle East & Africa | |
| North America | Canada |
| Mexico | |
| United States | |
| Rest of North America | |
| South America | Argentina |
| Brazil | |
| Rest of South America |
| Speciality Type | CRF | Polymer Coated |
| Polymer-Sulfur Coated | ||
| Others | ||
| Liquid Fertilizer | ||
| SRF | ||
| Water Soluble | ||
| Crop Type | Field Crops | |
| Horticultural Crops | ||
| Turf & Ornamental | ||
| Form | Conventional | |
| Speciality | ||
| Region | Asia-Pacific | Australia |
| Bangladesh | ||
| China | ||
| India | ||
| Indonesia | ||
| Japan | ||
| Pakistan | ||
| Philippines | ||
| Thailand | ||
| Vietnam | ||
| Rest of Asia-Pacific | ||
| Europe | France | |
| Germany | ||
| Italy | ||
| Netherlands | ||
| Russia | ||
| Spain | ||
| Ukraine | ||
| United Kingdom | ||
| Rest of Europe | ||
| Middle East & Africa | Nigeria | |
| Saudi Arabia | ||
| South Africa | ||
| Turkey | ||
| Rest of Middle East & Africa | ||
| North America | Canada | |
| Mexico | ||
| United States | ||
| Rest of North America | ||
| South America | Argentina | |
| Brazil | ||
| Rest of South America | ||
Need A Different Region or Segment?
Customize Now
Market Definition
- MARKET ESTIMATION LEVEL - Market Estimations for various types of fertilizers has been done at the product-level and not at the nutrient-level.
- NUTRIENT TYPES COVERED - Urea: Conventional Fertilizer, Controlled-release Urea Fertilizers, and Slow-Release Urea Fertilizer
- AVERAGE NUTRIENT APPLICATION RATE - This refers to the average volume of nutrient consumed per hectare of farmland in each country.
- CROP TYPES COVERED - Field Crops: Cereals, Pulses, Oilseeds, and Fiber Crops Horticulture: Fruits, Vegetables, Plantation Crops and Spices, Turf Grass and Ornamentals
| Keyword | Definition |
|---|---|
| Fertilizer | Chemical substance applied to crops to ensure nutritional requirements, available in various forms such as granules, powders, liquid, water soluble, etc. |
| Specialty Fertilizer | Used for enhanced efficiency and nutrient availability applied through soil, foliar, and fertigation. Includes CRF, SRF, liquid fertilizer, and water soluble fertilizers. |
| Controlled-Release Fertilizers (CRF) | Coated with materials such as polymer, polymer-sulfur, and other materials such as resins to ensure nutrient availability to the crop for its entire life cycle. |
| Slow-Release Fertilizers (SRF) | Coated with materials such as sulfur, neem, etc., to ensure nutrient availability to the crop for a longer period. |
| Foliar Fertilizers | Consist of both liquid and water soluble fertilizers applied through foliar application. |
| Water-Soluble Fertilizers | Available in various forms including liquid, powder, etc., used in foliar and fertigation mode of fertilizer application. |
| Fertigation | Fertilizers applied through different irrigation systems such as drip irrigation, micro irrigation, sprinkler irrigation, etc. |
| Anhydrous Ammonia | Used as fertilizer, directly injected into the soil, available in gaseous liquid form. |
| Single Super Phosphate (SSP) | Phosphorus fertilizer containing only phosphorus which has lesser than or equal to 35%. |
| Triple Super Phosphate (TSP) | Phosphorus fertilizer containing only phosphorus greater than 35%. |
| Enhanced Efficiency Fertilizers | Fertilizers coated or treated with additional layers of various ingredients to make it more efficient compared to other fertilizers. |
| Conventional Fertilizer | Fertilizers applied to crops through traditional methods including broadcasting, row placement, ploughing soil placement, etc. |
| Chelated Micronutrients | Micronutrient fertilizers coated with chelating agents such as EDTA, EDDHA, DTPA, HEDTA, etc. |
| Liquid Fertilizers | Available in liquid form, majorly used for application of fertilizers to crops through foliar and fertigation. |
Need More Details on Market Definition?
Ask a Question
Research Methodology
Mordor Intelligence follows a four-step methodology in all our reports.
- Step-1: IDENTIFY KEY VARIABLES: In order to build a robust forecasting methodology, the variables and factors identified in Step-1 are tested against available historical market numbers. Through an iterative process, the variables required for market forecast are set and the model is built on the basis of these variables.
- Step-2: Build a Market Model: Market-size estimations for the forecast years are in nominal terms. Inflation is not a part of the pricing, and the average selling price (ASP) is kept constant throughout the forecast period for each country.
- Step-3: Validate and Finalize: In this important step, all market numbers, variables and analyst calls are validated through an extensive network of primary research experts from the market studied. The respondents are selected across levels and functions to generate a holistic picture of the market studied.
- Step-4: Research Outputs: Syndicated Reports, Custom Consulting Assignments, Databases & Subscription Platforms

Get More Details On Research Methodology
Download PDF


