| Study Period | 2017 - 2029 |
| Base Year For Estimation | 2024 |
| Forecast Data Period | 2025 - 2029 |
| Market Size (2025) | USD 706 Billion |
| Market Size (2029) | USD 777.2 Billion |
| CAGR (2025 - 2029) | 2.43 % |
| Market Concentration | Medium |
Major Players*Disclaimer: Major Players sorted in no particular order |

Two-Wheeler Market Analysis
The Two-Wheeler Market size is estimated at 706 billion USD in 2025, and is expected to reach 777.2 billion USD by 2029, growing at a CAGR of 2.43% during the forecast period (2025-2029).
The global two-wheeler industry is experiencing significant transformation driven by technological advancements and changing consumer preferences. Major manufacturers are investing heavily in research and development to enhance their product offerings and maintain a competitive advantage. This is evidenced by substantial investments in the sector, such as Toyota's USD 1.29 billion commitment to a battery manufacturing facility in North Carolina, announced in December 2022. The industry landscape is dominated by established players, with Honda Motor Co. Ltd. maintaining its position as the market leader with approximately 26.5% global market share in 2023, demonstrating the concentrated nature of market leadership among traditional manufacturers.
Manufacturing dynamics are evolving rapidly with an increased focus on sustainable production methods and electric two-wheeler technology. The industry has witnessed remarkable progress in battery technology, with lithium-ion battery prices declining by approximately 80% over the past decade, reaching around USD 220 per kilowatt-hour. This significant reduction in battery costs has made electric two-wheelers more commercially viable and attractive to consumers. Major automotive companies are forming strategic partnerships to strengthen their position in the electric vehicle segment, exemplified by Ford and SK Innovations' USD 11.4 billion investment in manufacturing facilities in Tennessee and Kentucky.
Consumer preferences are increasingly shifting toward environmentally conscious transportation solutions, particularly in urban areas where two-wheelers offer practical mobility solutions. The market is witnessing a growing demand for electric and hybrid models, especially in developed regions where environmental regulations are more stringent. This shift is supported by the global average gasoline price of USD 1.22 per liter in 2022, which has prompted consumers to consider more fuel-efficient alternatives. The industry is responding to these changing preferences by introducing innovative features and smart connectivity options in newer models, including electric motorcycles and scooters.
The future outlook for the two-wheeler market is characterized by accelerating technological innovation and sustainability initiatives. Manufacturers are increasingly focusing on developing advanced electric powertrains, lightweight materials, and enhanced safety features. The industry is witnessing a significant transformation in its supply chain, with companies establishing regional manufacturing hubs to ensure better market responsiveness and cost efficiency. This evolution is particularly evident in the electric two-wheeler segment, where continued technological advancements and increasing consumer acceptance are driving growth. The market is expected to see further integration of digital technologies, including connected vehicle features and advanced diagnostic capabilities, enhancing the overall riding experience and vehicle maintenance.
Global Two-Wheeler Market Trends
The rising global demand and government support propel electric vehicle market growth
- Electric vehicles (EVs) have become indispensable in the automotive industry, driven by their potential to enhance energy efficiency and reduce greenhouse gas and pollution emissions. This surge is primarily attributed to growing environmental concerns and supportive government initiatives. Notably, global EV sales witnessed a robust 10.82% growth in 2022 compared to 2021. Projections indicate that annual sales of electric passenger cars will surpass 5 million by the end of 2025, accounting for approximately 15% of total vehicle sales.
- Leading manufacturers and organizations, like the London Metropolitan Police & Fire Service, have been actively pursuing their electric mobility strategies. For instance, they have set a target of a zero-emission fleet by 2025, with a goal of electrifying 40% of their vans by 2030 and achieving full electrification by 2040. Similar trends are expected globally, with the period from 2024 to 2030 witnessing a surge in demand and sales of electric vehicles.
- Asia-Pacific and Europe are poised to dominate electric vehicle production, driven by their advancements in battery technology and vehicle electrification. In May 2020, Kia Motors Europe unveiled its "Plan S," signaling a strategic shift toward electrification. This decision came on the heels of record-breaking sales of Kia's EVs in Europe. Kia has ambitious plans to introduce 11 EV models globally by 2025, spanning various segments like passenger vehicles, SUVs, and MPVs. The company aims to achieve annual global EV sales of 500,000 by 2026.

Understand The Key Trends Shaping This Market
Download PDF
OTHER KEY INDUSTRY TRENDS COVERED IN THE REPORT
- Africa's demographic evolution demonstrates consistent growth with a notable acceleration in recent years
- Several European countries are facing population declines, while others are growing, indicating a need for targeted policy interventions
- North America's demographic story highlights steady growth and adaptability, with each nation contributing uniquely to the region's vibrant mosaic, underlining its continued global significance
- Despite a GDP per capita decline in 2022-2023, Africa shows potential for future economic stability through trade agreements and infrastructure development
- Europe's GDP per capita is on track for steady growth, reflecting resilience and strategic policies
- Despite challenges in 2020, by 2023, the US experienced growth, Mexico displayed a robust recovery, while Canada witnessed a dip
- South Africa's consumer vehicle population shows signs of stabilization
- European countries are experiencing growth in CVP, driven by government incentives for eco-friendly vehicles
- North America exhibits diverse trends in CVP, with Canada experiencing a slight decrease, the US seeing an increase, and Mexico showing significant growth
- South Africa, Kenya, and Morocco exhibit declining inflation rates, while Nigeria faces a sharp inflation increase
- Europe is poised for economic stability, with concerted efforts to manage inflation and foster a balanced economic landscape
- From 2017 to 2023, North America, particularly countries like the US and Canada, navigated inflationary spikes, especially post-pandemic in 2022
- Auto interest rates across Africa, Asia-Pacific, and North America showed significant regional diversity, influenced by a combination of economic policies, market dynamics, and global conditions
- Battery pack prices in Africa continued to decline from USD 186 in 2022 to USD 176 in 2023, driven by technological advancements and increased market competition
- Declining battery prices and government initiatives drive demand for electric vehicles in Europe
- Declining prices of lithium-ion batteries drive the demand for electric vehicles in North America
- The global automotive industry will undergo a transformative phase, with a pronounced shift toward electrification from 2023 to 2025, followed by a period of refinement and consolidation in the subsequent years
- Countries like Australia, India, and Indonesia project a steady upward trajectory in GDP per capita, suggesting robust economic strategies and potential investment in the automotive industries
- Saudi Arabia and UAE, both pivotal nations in the Middle East, demonstrated population growth from 2017 to 2023. While there were slight dips for both countries in between, the overarching upward trend indicates their significant roles and attractions in the region
- South America's demographic narrative, represented by Brazil and Colombia, showcases a story of consistent growth, with Brazil experiencing a pronounced surge
- Asia-Pacific displays a panorama of economic evolution: from the relentless pursuits of emerging economies to the recalibrations of established ones, painting a picture of resilience, adaptation, and ambition
- Projections for the coming years indicate a steady growth trajectory for both the UAE's diversified sectors and its role as a regional business hub. This growth can be attributed to the country's focus on diversification efforts and strategic partnerships
- During 2017-2030, Brazil and Colombia displayed contrasting economic paths. While both faced downturns around 2020, Brazil's GDP per capita showed recovery by 2023, whereas Colombia witnessed a slight decline
- The Asia-Pacific's diverse consumer spending trends on vehicle purchases not only reflect the region's evolving economic conditions but also highlight the shifting consumer preferences and vehicular market dynamics across countries
- In the short term (2022-2023), Saudi Arabia maintained stable consumer spending for vehicle purchases, while the UAE experienced a slight decline, suggesting differing market dynamics
- Brazil and Colombia are expected to see an increase in consumer spending for vehicle purchases (CVP), indicating a recovering automotive market and growing consumer confidence
- Asia-Pacific’s varied inflation rates reflect the diverse economic challenges and responses of each nation, from battling pandemic-induced fluctuations to aiming for future stability through strategic economic policies
- From 2017 to 2030, the Middle East is expected to display varied inflationary patterns, with countries like Iran facing significant challenges, while others like Saudi Arabia and the UAE expected to show stability
- Projections indicate a trend toward economic stabilization and controlled inflation in the region, highlighting a concerted push to restore equilibrium and foster growth
- Global efforts to expand and enhance EV infrastructure are signaling a collective push toward electrification
- The demand for EVs in Asia-Pacific is fueled by falling battery prices
- The Middle East's battery market: A continuous descent in prices and promising energy trends
- South America’s surging demand for electric vehicle batteries: falling costs and strategic alliances
- For over a year, Russia's invasion of Ukraine disrupted global crude oil and petroleum product markets
Segment Analysis: Propulsion Type
ICE Segment in Global Two-Wheeler Market
The Internal Combustion Engine (ICE) segment continues to dominate the global two-wheeler market, commanding approximately 76% market share in 2024. This substantial market presence is attributed to the segment's well-established manufacturing infrastructure, widespread availability of fuel stations, and consumer familiarity with traditional combustion engines. The segment's strength is particularly evident in emerging markets where factors such as lower initial purchase costs, established maintenance networks, and proven reliability continue to drive consumer preference. Additionally, recent technological advancements in ICE engines have led to improved fuel efficiency and reduced emissions, helping maintain their appeal despite growing environmental concerns.
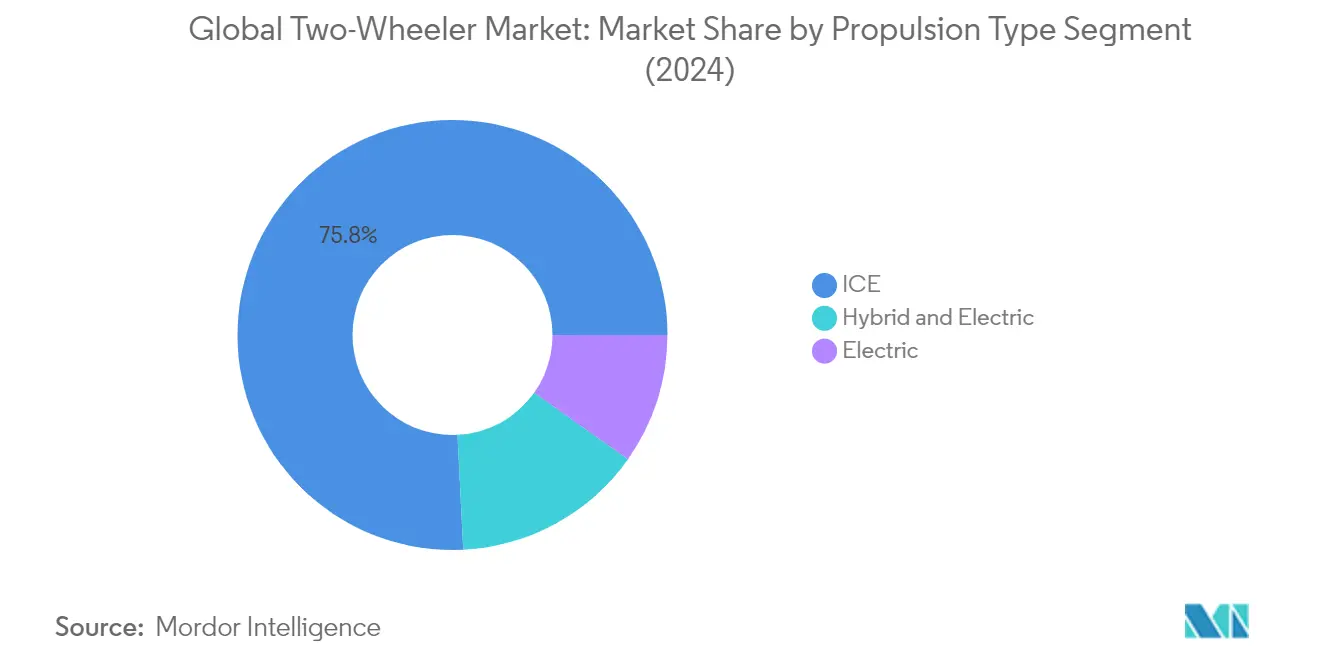
Hybrid and Electric Vehicles Segment in Global Two-Wheeler Market
The Hybrid and Electric Vehicles segment is experiencing remarkable growth, projected to expand at approximately 17% during 2024-2029. This impressive growth trajectory is driven by increasing environmental consciousness, government incentives for electric two-wheelers adoption, and significant improvements in battery technology and charging infrastructure. Manufacturers are introducing innovative features such as enhanced range capabilities, faster charging times, and smart connectivity options, making these vehicles more attractive to consumers. The segment's growth is further supported by urbanization trends, rising fuel costs, and stringent emission regulations across major markets, positioning hybrid and electric two-wheelers as sustainable mobility solutions for the future.
Remaining Segments in Propulsion Type
The pure electric segment represents a distinct category in the two-wheeler market, offering zero-emission vehicles that cater to environmentally conscious consumers and markets with strict emission regulations. This segment is characterized by continuous innovations in battery technology, motor efficiency, and charging solutions. While currently representing a smaller portion of the market compared to ICE and hybrid vehicles, pure electric two-wheelers are gaining traction in urban areas where charging infrastructure is more developed and government incentives are strongest. The segment's growth is complemented by increasing consumer awareness about environmental issues and the overall shift towards sustainable transportation solutions, including the rise of electric motorcycles and electric scooters.
Two-Wheeler Market Geography Segment Analysis
Two-Wheeler Market in Africa
The African two-wheeler market demonstrates significant regional variations in consumer preferences and market dynamics. South Africa leads the region's premium segment with a strong presence of international brands and a well-developed dealer network. The rest of Africa shows increasing adoption of two-wheelers as essential transportation, particularly in urban areas where they provide an affordable mobility solution. Infrastructure development and urbanization across the continent are driving market expansion, while growing environmental awareness is gradually shifting interest toward electric two-wheelers in major cities.
Two-Wheeler Market in South Africa - Regional Leader
South Africa dominates the African two-wheeler market share, holding approximately 40% of the regional market share in 2024. The country's market is characterized by a diverse product range, from entry-level commuter bikes to premium motorcycles. Urban centers like Johannesburg and Cape Town show particularly strong demand, supported by a robust financing ecosystem and established service networks. The market benefits from the country's relatively advanced infrastructure and higher disposable incomes compared to other African nations. Local dealerships and distribution networks have expanded significantly, offering both new and used two-wheelers to cater to different consumer segments.
Two-Wheeler Market in South Africa - Growth Leader
South Africa is also the fastest-growing market in the region, with a projected growth rate of approximately 5% from 2024 to 2029. This growth is driven by increasing urbanization and the rising need for cost-effective transportation solutions. The country's expanding middle class and growing interest in recreational motorbikes contribute to market momentum. Government initiatives to improve road infrastructure and promote sustainable transportation options are creating favorable conditions for market expansion. The emergence of new financing options and the introduction of electric two-wheelers are expected to further accelerate market growth.
Two-Wheeler Market in Asia-Pacific
The Asia-Pacific two-wheeler market represents a diverse landscape with varying consumer preferences and market maturity levels across countries. China and India dominate the regional market with their massive production capabilities and domestic demand. Japan and South Korea lead in technological innovation, particularly in electric two-wheelers, while emerging markets like Indonesia and Thailand show strong growth potential. The region's market is characterized by a mix of utilitarian use in developing countries and recreational riding in more developed nations.
Two-Wheeler Market in China - Regional Leader
China maintains its position as the largest two-wheeler market in Asia-Pacific, commanding approximately 45% of the regional market share in 2024. The country's market is driven by its vast urban population and well-developed manufacturing infrastructure. Chinese manufacturers have established strong domestic and international presence, offering a wide range of products from basic commuter vehicles to premium electric two-wheelers. The market benefits from extensive government support for electric mobility and a comprehensive supply chain ecosystem that enables competitive pricing and rapid product development.
Two-Wheeler Market in India - Growth Leader
India emerges as the fastest-growing market in Asia-Pacific, with an expected growth rate of approximately 5% from 2024 to 2029. The Indian two-wheeler market is driven by a young demographic, rising disposable incomes, and increasing urbanization. Government initiatives promoting electric mobility and improving road infrastructure contribute to market expansion. The presence of major global manufacturers and strong domestic players creates a competitive environment that drives innovation and product development. Rural market penetration and the growing adoption of electric two-wheelers are expected to sustain this growth momentum.
Two-Wheeler Market in Europe
The European two-wheeler market exhibits sophisticated consumer preferences with a strong focus on premium segments and environmental sustainability. Countries like France, Germany, and the UK lead in market development, while Eastern European nations show emerging potential. The region's strict emission regulations and urban mobility challenges drive innovation in electric two-wheelers. The market benefits from well-developed infrastructure and a strong recreational riding culture across countries.
Two-Wheeler Market in France - Regional Leader
France stands as the largest two-wheeler market in Europe, characterized by a strong urban mobility culture and growing environmental consciousness. The country's market benefits from extensive government support for sustainable transportation and well-developed infrastructure. Urban centers like Paris lead in two-wheeler adoption, supported by favorable policies and expanding charging networks for electric vehicles. The market shows a balanced mix of commuter vehicles and recreational motorcycles, with strong dealer networks and after-sales support.
Two-Wheeler Market in France - Growth Leader
France also leads European market growth, driven by increasing adoption of electric two-wheelers and supportive government policies. The country's urban mobility challenges and environmental goals create strong incentives for two-wheeler adoption. Investment in charging infrastructure and urban planning favorable to two-wheelers supports market expansion. The growing popularity of shared mobility services and increasing interest in sustainable transportation options contribute to market momentum.
Two-Wheeler Market in Middle East
The Middle Eastern two-wheeler market shows distinct characteristics across different countries, with the UAE and Saudi Arabia leading in premium segment adoption. The region's market is influenced by extreme weather conditions and varying regulatory frameworks across countries. While recreational riding dominates in Gulf countries, practical commuting purposes drive demand in other parts of the region. The UAE leads both in market size and growth rate, benefiting from advanced infrastructure and strong purchasing power, while also showing increasing interest in electric two-wheelers.
Two-Wheeler Market in North America
The North American two-wheeler market is characterized by a strong recreational riding culture and growing interest in premium segments. The United States dominates the regional market, followed by Canada and Mexico, each with distinct consumer preferences and market dynamics. The region shows increasing adoption of electric two-wheelers, particularly in urban areas, with Canada emerging as the fastest-growing market. The presence of major global manufacturers and strong dealer networks supports market development across all three countries.
Two-Wheeler Market in South America
The South American two-wheeler market demonstrates strong growth potential, with Brazil leading both in market size and growth rate. Argentina and other countries show varying levels of market development, influenced by economic conditions and infrastructure development. The region's market is primarily driven by practical transportation needs, particularly in urban areas with traffic congestion. Growing environmental awareness and improving economic conditions support the gradual adoption of electric two-wheelers across the region.
Get Analysis on Important Geographic Markets
Download PDF
Two-Wheeler Industry Overview
Top Companies in Two-Wheeler Market
The global two-wheeler market is characterized by intense competition and continuous innovation among major players like Honda Motor Co., Hero MotoCorp, Yamaha Motor Company, TVS Motor Company, and Bajaj Auto. These industry leaders are increasingly focusing on electric two-wheeler development, with substantial investments in research and development to enhance battery technology and charging infrastructure. Companies are also expanding their manufacturing capabilities while simultaneously strengthening their distribution networks across emerging markets. Strategic partnerships, particularly in the electric mobility space, have become increasingly common as companies seek to leverage complementary strengths and accelerate market penetration. Additionally, manufacturers are emphasizing product customization and digital integration features to meet evolving consumer preferences, while also investing in sustainable production practices to align with global environmental regulations.
Market Dominated by Established Global Players
The two-wheeler market exhibits a relatively consolidated structure, with major global manufacturers commanding significant two-wheeler market share through their established brand presence and extensive distribution networks. These dominant players benefit from economies of scale, strong research and development capabilities, and well-established supplier relationships, creating substantial barriers to entry for new competitors. The market is characterized by a mix of global conglomerates with diverse product portfolios and specialized two-wheeler manufacturers, each leveraging their unique strengths to maintain market position. Regional players, particularly in emerging markets, maintain competitive positions through local market knowledge and targeted product offerings.
The industry has witnessed strategic consolidations through mergers and acquisitions, particularly as companies seek to expand their geographic presence and technological capabilities. Traditional manufacturers are increasingly acquiring or partnering with electric vehicle startups to accelerate their transition towards sustainable mobility solutions. Joint ventures and technology partnerships have become common, especially in developing markets where local manufacturing and distribution expertise are crucial for success. The market also sees collaboration between automotive and technology companies, particularly in developing connected vehicle solutions and advanced electric powertrains.
Innovation and Sustainability Drive Future Success
Success in the two-wheeler industry increasingly depends on companies' ability to innovate while maintaining cost competitiveness. Incumbent players must focus on developing advanced electric powertrains, implementing smart connectivity features, and expanding their charging infrastructure networks to maintain their market leadership. Companies need to balance premium offerings with affordable solutions to address diverse market segments while investing in digital capabilities to enhance customer experience. Manufacturing efficiency, supply chain optimization, and strategic sourcing have become critical factors in maintaining profitability amid increasing competition and regulatory requirements.
For emerging players and contenders, success lies in identifying and exploiting niche market segments while building a strong local presence and distribution networks. Companies must focus on developing innovative financing solutions and after-sales service networks to attract and retain customers. The increasing emphasis on environmental regulations and emission standards presents both challenges and opportunities, requiring manufacturers to invest in sustainable technologies and production processes. Market players must also consider potential disruptions from shared mobility solutions and changing consumer preferences, particularly in urban areas where alternative transportation options are expanding. Building a strong brand identity while maintaining operational flexibility will be crucial for long-term success in this evolving market landscape.
Two-Wheeler Market Leaders
-
Bajaj Auto Ltd.
-
Hero MotoCorp Ltd.
-
Honda Motor Co. Ltd.
-
TVS Motor Company Limited
-
Yamaha Motor Company Limited
- *Disclaimer: Major Players sorted in no particular order

Need More Details on Market Players and Competiters?
Download PDF
Two-Wheeler Market News
- October 2023: Piaggio and Foton Motor Group signed a contract for the joint development of a new range of electrically powered porter vehicles. The new range of electric porter models will be manufactured in Italy, in the Piaggio Group’s Pontedera factory.
- October 2023: KTM stepped up its mini-cross offering with the 2024 KTM SX mini range.
- October 2023: TVS Motor Company sought to broaden its product line in the Venezuelan market by introducing a range of 14 products, which included both two-wheelers and three-wheelers. The line-up also featured high-end bikes like RR 310, Apache RTR 200 FI, Apache RTR 160, and Apache RTR 200, as well as commuter vehicles such as TRAK 150, Sport 100, and HLX.
Free With This Report
For the Vehicle Hub report, we provide an extensive collection of over 150 free charts, delivering detailed insights on regional and country-level dynamics within the vehicle industry. This encompasses in-depth analyses of vehicle registrations, usage patterns in both consumer and business segments, and evaluations of various vehicle configurations and body types. The report delves into critical industrial trends such as shifts in vehicle production and distribution centers, changes in vehicle ownership costs, and advancements in automotive technologies. Further, our report offers comprehensive market segmentation by vehicle type, body type, propulsion, and fuel categories, providing a nuanced understanding of the market landscape. It also explores the adoption rate of new technologies, the impact of regulatory changes, and the influence of economic factors on the vehicle market. We include a thorough examination of key industry players, regulatory frameworks, and market size in terms of both revenue and unit sales, leading to strategic projections and forecasts that account for emerging trends and potential shifts in the industry.


Two-Wheeler Market Report - Table of Contents
1. EXECUTIVE SUMMARY & KEY FINDINGS
2. REPORT OFFERS
3. INTRODUCTION
- 3.1 Study Assumptions & Market Definition
- 3.2 Scope of the Study
- 3.3 Research Methodology
4. KEY INDUSTRY TRENDS
-
4.1 Population
- 4.1.1 Africa
- 4.1.2 Asia-Pacific
- 4.1.3 Europe
- 4.1.4 Middle East
- 4.1.5 North America
- 4.1.6 South America
-
4.2 GDP Per Capita
- 4.2.1 Africa
- 4.2.2 Asia-Pacific
- 4.2.3 Europe
- 4.2.4 Middle East
- 4.2.5 North America
- 4.2.6 South America
-
4.3 Consumer Spending For Vehicle Purchase (cvp)
- 4.3.1 Africa
- 4.3.2 Asia-Pacific
- 4.3.3 Europe
- 4.3.4 Middle East
- 4.3.5 North America
- 4.3.6 South America
-
4.4 Inflation
- 4.4.1 Africa
- 4.4.2 Asia-Pacific
- 4.4.3 Europe
- 4.4.4 Middle East
- 4.4.5 North America
- 4.4.6 South America
- 4.5 Interest Rate For Auto Loans
- 4.6 Impact Of Electrification
- 4.7 EV Charging Station
-
4.8 Battery Pack Price
- 4.8.1 Africa
- 4.8.2 Asia-Pacific
- 4.8.3 Europe
- 4.8.4 Middle East
- 4.8.5 North America
- 4.8.6 South America
- 4.9 New Xev Models Announced
- 4.10 Fuel Price
- 4.11 Regulatory Framework
- 4.12 Value Chain & Distribution Channel Analysis
5. MARKET SEGMENTATION (includes market size in Value in USD and Volume, Forecasts up to 2029 and analysis of growth prospects)
-
5.1 Propulsion Type
- 5.1.1 Electric
- 5.1.2 Hybrid and Electric Vehicles
- 5.1.3 ICE
-
5.2 Region
- 5.2.1 Africa
- 5.2.1.1 South Africa
- 5.2.1.2 Rest-of-Africa
- 5.2.2 Asia-Pacific
- 5.2.2.1 Australia
- 5.2.2.2 China
- 5.2.2.3 India
- 5.2.2.4 Indonesia
- 5.2.2.5 Japan
- 5.2.2.6 Malaysia
- 5.2.2.7 South Korea
- 5.2.2.8 Thailand
- 5.2.2.9 Rest-of-APAC
- 5.2.3 Europe
- 5.2.3.1 Austria
- 5.2.3.2 Belgium
- 5.2.3.3 Czech Republic
- 5.2.3.4 Denmark
- 5.2.3.5 Estonia
- 5.2.3.6 France
- 5.2.3.7 Germany
- 5.2.3.8 Ireland
- 5.2.3.9 Italy
- 5.2.3.10 Latvia
- 5.2.3.11 Lithuania
- 5.2.3.12 Norway
- 5.2.3.13 Poland
- 5.2.3.14 Russia
- 5.2.3.15 Spain
- 5.2.3.16 Sweden
- 5.2.3.17 UK
- 5.2.3.18 Rest-of-Europe
- 5.2.4 Middle East
- 5.2.4.1 Saudi Arabia
- 5.2.4.2 UAE
- 5.2.4.3 Rest-of-Middle East
- 5.2.5 North America
- 5.2.5.1 Canada
- 5.2.5.2 Mexico
- 5.2.5.3 US
- 5.2.6 South America
- 5.2.6.1 Argentina
- 5.2.6.2 Brazil
- 5.2.6.3 Rest-of-South America
6. COMPETITIVE LANDSCAPE
- 6.1 Key Strategic Moves
- 6.2 Market Share Analysis
- 6.3 Company Landscape
-
6.4 Company Profiles
- 6.4.1 Aima Technology Group Co. Ltd.
- 6.4.2 Ather Energy Pvt. Ltd.
- 6.4.3 Bajaj Auto Ltd.
- 6.4.4 Harley-Davidson
- 6.4.5 Hero MotoCorp Ltd.
- 6.4.6 Honda Motor Co. Ltd.
- 6.4.7 KTM Motorcycles
- 6.4.8 Piaggio & C. SpA
- 6.4.9 TVS Motor Company Limited
- 6.4.10 Yadea Technology Group Co. Ltd.
- 6.4.11 Yamaha Motor Company Limited
- *List Not Exhaustive
7. KEY STRATEGIC QUESTIONS FOR VEHICLES CEOS
8. APPENDIX
-
8.1 Global Overview
- 8.1.1 Overview
- 8.1.2 Porter’s Five Forces Framework
- 8.1.3 Global Value Chain Analysis
- 8.1.4 Market Dynamics (DROs)
- 8.2 Sources & References
- 8.3 List of Tables & Figures
- 8.4 Primary Insights
- 8.5 Data Pack
- 8.6 Glossary of Terms
You Can Purchase Parts Of This Report. Check Out Prices For Specific Sections
Get Price Break-up Now
List of Tables & Figures
- Figure 1:
- POPULATION TRENDS, VOLUME IN UNITS, AFRICA, 2017 - 2030
- Figure 2:
- POPULATION TRENDS, VOLUME IN UNITS, ASIA-PACIFIC, 2017 - 2030
- Figure 3:
- POPULATION TRENDS, VOLUME IN UNITS, EUROPE, 2017 - 2030
- Figure 4:
- POPULATION TRENDS, VOLUME IN UNITS, MIDDLE EAST, 2017 - 2030
- Figure 5:
- POPULATION TRENDS, VOLUME IN UNITS, NORTH AMERICA, 2017 - 2030
- Figure 6:
- POPULATION TRENDS, VOLUME IN UNITS, SOUTH AMERICA, 2017 - 2030
- Figure 7:
- GDP PER CAPITA AT CURRENT PRICES, VALUE IN USD, AFRICA, 2017 - 2030
- Figure 8:
- GDP PER CAPITA AT CURRENT PRICES, VALUE IN USD, ASIA-PACIFIC, 2017 - 2030
- Figure 9:
- GDP PER CAPITA AT CURRENT PRICES, VALUE IN USD, EUROPE, 2017 - 2030
- Figure 10:
- GDP PER CAPITA AT CURRENT PRICES, VALUE IN USD, MIDDLE EAST, 2017 - 2030
- Figure 11:
- GDP PER CAPITA AT CURRENT PRICES, VALUE IN USD, NORTH AMERICA, 2017 - 2030
- Figure 12:
- GDP PER CAPITA AT CURRENT PRICES, VALUE IN USD, SOUTH AMERICA, 2017 - 2030
- Figure 13:
- AVERAGE CONSUMER SPENDING PER CAPITA ON PURCHASE OF VEHICLES, VALUE IN USD, AFRICA, 2017 - 2030
- Figure 14:
- AVERAGE CONSUMER SPENDING PER CAPITA ON PURCHASE OF VEHICLES, VALUE IN USD, ASIA-PACIFIC, 2017 - 2030
- Figure 15:
- AVERAGE CONSUMER SPENDING PER CAPITA ON PURCHASE OF VEHICLES, VALUE IN USD, EUROPE, 2017 - 2030
- Figure 16:
- AVERAGE CONSUMER SPENDING PER CAPITA ON PURCHASE OF VEHICLES, VALUE IN USD, MIDDLE EAST, 2017 - 2030
- Figure 17:
- AVERAGE CONSUMER SPENDING PER CAPITA ON PURCHASE OF VEHICLES, VALUE IN USD, NORTH AMERICA, 2017 - 2030
- Figure 18:
- AVERAGE CONSUMER SPENDING PER CAPITA ON PURCHASE OF VEHICLES, VALUE IN USD, SOUTH AMERICA, 2017 - 2030
- Figure 19:
- INFLATION RATE AT AVERAGE CONSUMER PRICES, PERCENTAGE CHANGE, AFRICA, 2017 - 2030
- Figure 20:
- INFLATION RATE AT AVERAGE CONSUMER PRICES, PERCENTAGE CHANGE, ASIA-PACIFIC, 2017 - 2030
- Figure 21:
- INFLATION RATE AT AVERAGE CONSUMER PRICES, PERCENTAGE CHANGE, EUROPE, 2017 - 2030
- Figure 22:
- INFLATION RATE AT AVERAGE CONSUMER PRICES, PERCENTAGE CHANGE, MIDDLE EAST, 2017 - 2030
- Figure 23:
- INFLATION RATE AT AVERAGE CONSUMER PRICES, PERCENTAGE CHANGE, NORTH AMERICA, 2017 - 2030
- Figure 24:
- INFLATION RATE AT AVERAGE CONSUMER PRICES, PERCENTAGE CHANGE, SOUTH AMERICA, 2017 - 2030
- Figure 25:
- AUTO LOAN INTEREST RATES, PERCENTAGE, GLOBAL, 2017 - 2022
- Figure 26:
- ELECTRIC VEHICLE MARKET PENETRATION RATE, BY VEHICLE TYPE, PERCENTAGE OF VOLUME, GLOBAL, 2017 - 2030
- Figure 27:
- CHARGING STATION DEPLOYMENT, BY TYPE, VOLUME IN UNITS, GLOBAL, 2017 - 2022
- Figure 28:
- AVERAGE LITHIUM-ION BATTERY PACK PRICE, VALUE IN USD, AFRICA, 2017 - 2030
- Figure 29:
- AVERAGE LITHIUM-ION BATTERY PACK PRICE, VALUE IN USD, ASIA-PACIFIC, 2017 - 2030
- Figure 30:
- AVERAGE LITHIUM-ION BATTERY PACK PRICE, VALUE IN USD, EUROPE, 2017 - 2030
- Figure 31:
- AVERAGE LITHIUM-ION BATTERY PACK PRICE, VALUE IN USD, MIDDLE EAST, 2017 - 2030
- Figure 32:
- AVERAGE LITHIUM-ION BATTERY PACK PRICE, VALUE IN USD, NORTH AMERICA, 2017 - 2030
- Figure 33:
- AVERAGE LITHIUM-ION BATTERY PACK PRICE, VALUE IN USD, SOUTH AMERICA, 2017 - 2030
- Figure 34:
- ANNOUNCEMENT OF NEW XEV MODELS, BY VEHICLE TYPE, VOLUME IN UNITS, GLOBAL, 2023 - 2027
- Figure 35:
- FUEL PRICE, BY FUEL TYPE, USD/LITER, GLOBAL, 2017 - 2022
- Figure 36:
- GLOBAL TWO-WHEELER MARKET, VOLUME IN UNITS, 2017 - 2030
- Figure 37:
- GLOBAL TWO-WHEELER MARKET, VALUE IN USD, 2017 - 2030
- Figure 38:
- GLOBAL TWO-WHEELER MARKET, BY PROPULSION TYPE, BY VOLUME IN UNITS, 2017 - 2030
- Figure 39:
- GLOBAL TWO-WHEELER MARKET, BY PROPULSION TYPE, BY VALUE IN USD, 2017 - 2030
- Figure 40:
- GLOBAL TWO-WHEELER MARKET MARKET, SHARE(%), BY PROPULSION TYPE, 2017 - 2030
- Figure 41:
- GLOBAL TWO-WHEELER MARKET MARKET, SHARE(%), BY PROPULSION TYPE, 2017 - 2030
- Figure 42:
- GLOBAL TWO-WHEELER MARKET, BY ELECTRIC, BY VOLUME IN UNITS, 2017 - 2030
- Figure 43:
- GLOBAL TWO-WHEELER MARKET, BY ELECTRIC, BY VALUE IN USD, 2017 - 2030
- Figure 44:
- GLOBAL TWO-WHEELER MARKET MARKET, SHARE(%), BY PROPULSION TYPE, 2017 - 2030
- Figure 45:
- GLOBAL TWO-WHEELER MARKET, BY HYBRID AND ELECTRIC VEHICLES, BY VOLUME IN UNITS, 2017 - 2030
- Figure 46:
- GLOBAL TWO-WHEELER MARKET, BY HYBRID AND ELECTRIC VEHICLES, BY VALUE IN USD, 2017 - 2030
- Figure 47:
- GLOBAL TWO-WHEELER MARKET MARKET, SHARE(%), BY PROPULSION TYPE, 2017 - 2030
- Figure 48:
- GLOBAL TWO-WHEELER MARKET, BY ICE, BY VOLUME IN UNITS, 2017 - 2030
- Figure 49:
- GLOBAL TWO-WHEELER MARKET, BY ICE, BY VALUE IN USD, 2017 - 2030
- Figure 50:
- GLOBAL TWO-WHEELER MARKET MARKET, SHARE(%), BY PROPULSION TYPE, 2017 - 2030
- Figure 51:
- GLOBAL TWO-WHEELER MARKET, BY REGION, BY VOLUME IN UNITS, 2017 - 2030
- Figure 52:
- GLOBAL TWO-WHEELER MARKET, BY REGION, BY VALUE IN USD, 2017 - 2030
- Figure 53:
- GLOBAL TWO-WHEELER MARKET MARKET, SHARE(%), BY REGION, 2017 - 2030
- Figure 54:
- GLOBAL TWO-WHEELER MARKET MARKET, SHARE(%), BY REGION, 2017 - 2030
- Figure 55:
- GLOBAL TWO-WHEELER MARKET, BY COUNTRY, BY VOLUME IN UNITS, 2017 - 2030
- Figure 56:
- GLOBAL TWO-WHEELER MARKET, BY COUNTRY, BY VALUE IN USD, 2017 - 2030
- Figure 57:
- GLOBAL TWO-WHEELER MARKET MARKET, SHARE(%), BY COUNTRY, 2017 - 2030
- Figure 58:
- GLOBAL TWO-WHEELER MARKET MARKET, SHARE(%), BY COUNTRY, 2017 - 2030
- Figure 59:
- GLOBAL TWO-WHEELER MARKET, BY SOUTH AFRICA, BY VOLUME IN UNITS, 2017 - 2030
- Figure 60:
- GLOBAL TWO-WHEELER MARKET, BY SOUTH AFRICA, BY VALUE IN USD, 2017 - 2030
- Figure 61:
- GLOBAL TWO-WHEELER MARKET MARKET, SHARE(%), BY PROPULSION TYPE, 2017 - 2030
- Figure 62:
- GLOBAL TWO-WHEELER MARKET, BY REST-OF-AFRICA, BY VOLUME IN UNITS, 2017 - 2030
- Figure 63:
- GLOBAL TWO-WHEELER MARKET, BY REST-OF-AFRICA, BY VALUE IN USD, 2017 - 2030
- Figure 64:
- GLOBAL TWO-WHEELER MARKET MARKET, SHARE(%), BY PROPULSION TYPE, 2017 - 2030
- Figure 65:
- GLOBAL TWO-WHEELER MARKET, BY COUNTRY, BY VOLUME IN UNITS, 2017 - 2030
- Figure 66:
- GLOBAL TWO-WHEELER MARKET, BY COUNTRY, BY VALUE IN USD, 2017 - 2030
- Figure 67:
- GLOBAL TWO-WHEELER MARKET MARKET, SHARE(%), BY COUNTRY, 2017 - 2030
- Figure 68:
- GLOBAL TWO-WHEELER MARKET MARKET, SHARE(%), BY COUNTRY, 2017 - 2030
- Figure 69:
- GLOBAL TWO-WHEELER MARKET, BY AUSTRALIA, BY VOLUME IN UNITS, 2017 - 2030
- Figure 70:
- GLOBAL TWO-WHEELER MARKET, BY AUSTRALIA, BY VALUE IN USD, 2017 - 2030
- Figure 71:
- GLOBAL TWO-WHEELER MARKET MARKET, SHARE(%), BY PROPULSION TYPE, 2017 - 2030
- Figure 72:
- GLOBAL TWO-WHEELER MARKET, BY CHINA, BY VOLUME IN UNITS, 2017 - 2030
- Figure 73:
- GLOBAL TWO-WHEELER MARKET, BY CHINA, BY VALUE IN USD, 2017 - 2030
- Figure 74:
- GLOBAL TWO-WHEELER MARKET MARKET, SHARE(%), BY PROPULSION TYPE, 2017 - 2030
- Figure 75:
- GLOBAL TWO-WHEELER MARKET, BY INDIA, BY VOLUME IN UNITS, 2017 - 2030
- Figure 76:
- GLOBAL TWO-WHEELER MARKET, BY INDIA, BY VALUE IN USD, 2017 - 2030
- Figure 77:
- GLOBAL TWO-WHEELER MARKET MARKET, SHARE(%), BY PROPULSION TYPE, 2017 - 2030
- Figure 78:
- GLOBAL TWO-WHEELER MARKET, BY INDONESIA, BY VOLUME IN UNITS, 2017 - 2030
- Figure 79:
- GLOBAL TWO-WHEELER MARKET, BY INDONESIA, BY VALUE IN USD, 2017 - 2030
- Figure 80:
- GLOBAL TWO-WHEELER MARKET MARKET, SHARE(%), BY PROPULSION TYPE, 2017 - 2030
- Figure 81:
- GLOBAL TWO-WHEELER MARKET, BY JAPAN, BY VOLUME IN UNITS, 2017 - 2030
- Figure 82:
- GLOBAL TWO-WHEELER MARKET, BY JAPAN, BY VALUE IN USD, 2017 - 2030
- Figure 83:
- GLOBAL TWO-WHEELER MARKET MARKET, SHARE(%), BY PROPULSION TYPE, 2017 - 2030
- Figure 84:
- GLOBAL TWO-WHEELER MARKET, BY MALAYSIA, BY VOLUME IN UNITS, 2017 - 2030
- Figure 85:
- GLOBAL TWO-WHEELER MARKET, BY MALAYSIA, BY VALUE IN USD, 2017 - 2030
- Figure 86:
- GLOBAL TWO-WHEELER MARKET MARKET, SHARE(%), BY PROPULSION TYPE, 2017 - 2030
- Figure 87:
- GLOBAL TWO-WHEELER MARKET, BY SOUTH KOREA, BY VOLUME IN UNITS, 2017 - 2030
- Figure 88:
- GLOBAL TWO-WHEELER MARKET, BY SOUTH KOREA, BY VALUE IN USD, 2017 - 2030
- Figure 89:
- GLOBAL TWO-WHEELER MARKET MARKET, SHARE(%), BY PROPULSION TYPE, 2017 - 2030
- Figure 90:
- GLOBAL TWO-WHEELER MARKET, BY THAILAND, BY VOLUME IN UNITS, 2017 - 2030
- Figure 91:
- GLOBAL TWO-WHEELER MARKET, BY THAILAND, BY VALUE IN USD, 2017 - 2030
- Figure 92:
- GLOBAL TWO-WHEELER MARKET MARKET, SHARE(%), BY PROPULSION TYPE, 2017 - 2030
- Figure 93:
- GLOBAL TWO-WHEELER MARKET, BY REST-OF-APAC, BY VOLUME IN UNITS, 2017 - 2030
- Figure 94:
- GLOBAL TWO-WHEELER MARKET, BY REST-OF-APAC, BY VALUE IN USD, 2017 - 2030
- Figure 95:
- GLOBAL TWO-WHEELER MARKET MARKET, SHARE(%), BY PROPULSION TYPE, 2017 - 2030
- Figure 96:
- GLOBAL TWO-WHEELER MARKET, BY COUNTRY, BY VOLUME IN UNITS, 2017 - 2030
- Figure 97:
- GLOBAL TWO-WHEELER MARKET, BY COUNTRY, BY VALUE IN USD, 2017 - 2030
- Figure 98:
- GLOBAL TWO-WHEELER MARKET MARKET, SHARE(%), BY COUNTRY, 2017 - 2030
- Figure 99:
- GLOBAL TWO-WHEELER MARKET MARKET, SHARE(%), BY COUNTRY, 2017 - 2030
- Figure 100:
- GLOBAL TWO-WHEELER MARKET, BY AUSTRIA, BY VOLUME IN UNITS, 2017 - 2030
- Figure 101:
- GLOBAL TWO-WHEELER MARKET, BY AUSTRIA, BY VALUE IN USD, 2017 - 2030
- Figure 102:
- GLOBAL TWO-WHEELER MARKET MARKET, SHARE(%), BY PROPULSION TYPE, 2017 - 2030
- Figure 103:
- GLOBAL TWO-WHEELER MARKET, BY BELGIUM, BY VOLUME IN UNITS, 2017 - 2030
- Figure 104:
- GLOBAL TWO-WHEELER MARKET, BY BELGIUM, BY VALUE IN USD, 2017 - 2030
- Figure 105:
- GLOBAL TWO-WHEELER MARKET MARKET, SHARE(%), BY PROPULSION TYPE, 2017 - 2030
- Figure 106:
- GLOBAL TWO-WHEELER MARKET, BY CZECH REPUBLIC, BY VOLUME IN UNITS, 2017 - 2030
- Figure 107:
- GLOBAL TWO-WHEELER MARKET, BY CZECH REPUBLIC, BY VALUE IN USD, 2017 - 2030
- Figure 108:
- GLOBAL TWO-WHEELER MARKET MARKET, SHARE(%), BY PROPULSION TYPE, 2017 - 2030
- Figure 109:
- GLOBAL TWO-WHEELER MARKET, BY DENMARK, BY VOLUME IN UNITS, 2017 - 2030
- Figure 110:
- GLOBAL TWO-WHEELER MARKET, BY DENMARK, BY VALUE IN USD, 2017 - 2030
- Figure 111:
- GLOBAL TWO-WHEELER MARKET MARKET, SHARE(%), BY PROPULSION TYPE, 2017 - 2030
- Figure 112:
- GLOBAL TWO-WHEELER MARKET, BY ESTONIA, BY VOLUME IN UNITS, 2017 - 2030
- Figure 113:
- GLOBAL TWO-WHEELER MARKET, BY ESTONIA, BY VALUE IN USD, 2017 - 2030
- Figure 114:
- GLOBAL TWO-WHEELER MARKET MARKET, SHARE(%), BY PROPULSION TYPE, 2017 - 2030
- Figure 115:
- GLOBAL TWO-WHEELER MARKET, BY FRANCE, BY VOLUME IN UNITS, 2017 - 2030
- Figure 116:
- GLOBAL TWO-WHEELER MARKET, BY FRANCE, BY VALUE IN USD, 2017 - 2030
- Figure 117:
- GLOBAL TWO-WHEELER MARKET MARKET, SHARE(%), BY PROPULSION TYPE, 2017 - 2030
- Figure 118:
- GLOBAL TWO-WHEELER MARKET, BY GERMANY, BY VOLUME IN UNITS, 2017 - 2030
- Figure 119:
- GLOBAL TWO-WHEELER MARKET, BY GERMANY, BY VALUE IN USD, 2017 - 2030
- Figure 120:
- GLOBAL TWO-WHEELER MARKET MARKET, SHARE(%), BY PROPULSION TYPE, 2017 - 2030
- Figure 121:
- GLOBAL TWO-WHEELER MARKET, BY IRELAND, BY VOLUME IN UNITS, 2017 - 2030
- Figure 122:
- GLOBAL TWO-WHEELER MARKET, BY IRELAND, BY VALUE IN USD, 2017 - 2030
- Figure 123:
- GLOBAL TWO-WHEELER MARKET MARKET, SHARE(%), BY PROPULSION TYPE, 2017 - 2030
- Figure 124:
- GLOBAL TWO-WHEELER MARKET, BY ITALY, BY VOLUME IN UNITS, 2017 - 2030
- Figure 125:
- GLOBAL TWO-WHEELER MARKET, BY ITALY, BY VALUE IN USD, 2017 - 2030
- Figure 126:
- GLOBAL TWO-WHEELER MARKET MARKET, SHARE(%), BY PROPULSION TYPE, 2017 - 2030
- Figure 127:
- GLOBAL TWO-WHEELER MARKET, BY LATVIA, BY VOLUME IN UNITS, 2017 - 2030
- Figure 128:
- GLOBAL TWO-WHEELER MARKET, BY LATVIA, BY VALUE IN USD, 2017 - 2030
- Figure 129:
- GLOBAL TWO-WHEELER MARKET MARKET, SHARE(%), BY PROPULSION TYPE, 2017 - 2030
- Figure 130:
- GLOBAL TWO-WHEELER MARKET, BY LITHUANIA, BY VOLUME IN UNITS, 2017 - 2030
- Figure 131:
- GLOBAL TWO-WHEELER MARKET, BY LITHUANIA, BY VALUE IN USD, 2017 - 2030
- Figure 132:
- GLOBAL TWO-WHEELER MARKET MARKET, SHARE(%), BY PROPULSION TYPE, 2017 - 2030
- Figure 133:
- GLOBAL TWO-WHEELER MARKET, BY NORWAY, BY VOLUME IN UNITS, 2017 - 2030
- Figure 134:
- GLOBAL TWO-WHEELER MARKET, BY NORWAY, BY VALUE IN USD, 2017 - 2030
- Figure 135:
- GLOBAL TWO-WHEELER MARKET MARKET, SHARE(%), BY PROPULSION TYPE, 2017 - 2030
- Figure 136:
- GLOBAL TWO-WHEELER MARKET, BY POLAND, BY VOLUME IN UNITS, 2017 - 2030
- Figure 137:
- GLOBAL TWO-WHEELER MARKET, BY POLAND, BY VALUE IN USD, 2017 - 2030
- Figure 138:
- GLOBAL TWO-WHEELER MARKET MARKET, SHARE(%), BY PROPULSION TYPE, 2017 - 2030
- Figure 139:
- GLOBAL TWO-WHEELER MARKET, BY RUSSIA, BY VOLUME IN UNITS, 2017 - 2030
- Figure 140:
- GLOBAL TWO-WHEELER MARKET, BY RUSSIA, BY VALUE IN USD, 2017 - 2030
- Figure 141:
- GLOBAL TWO-WHEELER MARKET MARKET, SHARE(%), BY PROPULSION TYPE, 2017 - 2030
- Figure 142:
- GLOBAL TWO-WHEELER MARKET, BY SPAIN, BY VOLUME IN UNITS, 2017 - 2030
- Figure 143:
- GLOBAL TWO-WHEELER MARKET, BY SPAIN, BY VALUE IN USD, 2017 - 2030
- Figure 144:
- GLOBAL TWO-WHEELER MARKET MARKET, SHARE(%), BY PROPULSION TYPE, 2017 - 2030
- Figure 145:
- GLOBAL TWO-WHEELER MARKET, BY SWEDEN, BY VOLUME IN UNITS, 2017 - 2030
- Figure 146:
- GLOBAL TWO-WHEELER MARKET, BY SWEDEN, BY VALUE IN USD, 2017 - 2030
- Figure 147:
- GLOBAL TWO-WHEELER MARKET MARKET, SHARE(%), BY PROPULSION TYPE, 2017 - 2030
- Figure 148:
- GLOBAL TWO-WHEELER MARKET, BY UK, BY VOLUME IN UNITS, 2017 - 2030
- Figure 149:
- GLOBAL TWO-WHEELER MARKET, BY UK, BY VALUE IN USD, 2017 - 2030
- Figure 150:
- GLOBAL TWO-WHEELER MARKET MARKET, SHARE(%), BY PROPULSION TYPE, 2017 - 2030
- Figure 151:
- GLOBAL TWO-WHEELER MARKET, BY REST-OF-EUROPE, BY VOLUME IN UNITS, 2017 - 2030
- Figure 152:
- GLOBAL TWO-WHEELER MARKET, BY REST-OF-EUROPE, BY VALUE IN USD, 2017 - 2030
- Figure 153:
- GLOBAL TWO-WHEELER MARKET MARKET, SHARE(%), BY PROPULSION TYPE, 2017 - 2030
- Figure 154:
- GLOBAL TWO-WHEELER MARKET, BY COUNTRY, BY VOLUME IN UNITS, 2017 - 2030
- Figure 155:
- GLOBAL TWO-WHEELER MARKET, BY COUNTRY, BY VALUE IN USD, 2017 - 2030
- Figure 156:
- GLOBAL TWO-WHEELER MARKET MARKET, SHARE(%), BY COUNTRY, 2017 - 2030
- Figure 157:
- GLOBAL TWO-WHEELER MARKET MARKET, SHARE(%), BY COUNTRY, 2017 - 2030
- Figure 158:
- GLOBAL TWO-WHEELER MARKET, BY SAUDI ARABIA, BY VOLUME IN UNITS, 2017 - 2030
- Figure 159:
- GLOBAL TWO-WHEELER MARKET, BY SAUDI ARABIA, BY VALUE IN USD, 2017 - 2030
- Figure 160:
- GLOBAL TWO-WHEELER MARKET MARKET, SHARE(%), BY PROPULSION TYPE, 2017 - 2030
- Figure 161:
- GLOBAL TWO-WHEELER MARKET, BY UAE, BY VOLUME IN UNITS, 2017 - 2030
- Figure 162:
- GLOBAL TWO-WHEELER MARKET, BY UAE, BY VALUE IN USD, 2017 - 2030
- Figure 163:
- GLOBAL TWO-WHEELER MARKET MARKET, SHARE(%), BY PROPULSION TYPE, 2017 - 2030
- Figure 164:
- GLOBAL TWO-WHEELER MARKET, BY REST-OF-MIDDLE EAST, BY VOLUME IN UNITS, 2017 - 2030
- Figure 165:
- GLOBAL TWO-WHEELER MARKET, BY REST-OF-MIDDLE EAST, BY VALUE IN USD, 2017 - 2030
- Figure 166:
- GLOBAL TWO-WHEELER MARKET MARKET, SHARE(%), BY PROPULSION TYPE, 2017 - 2030
- Figure 167:
- GLOBAL TWO-WHEELER MARKET, BY COUNTRY, BY VOLUME IN UNITS, 2017 - 2030
- Figure 168:
- GLOBAL TWO-WHEELER MARKET, BY COUNTRY, BY VALUE IN USD, 2017 - 2030
- Figure 169:
- GLOBAL TWO-WHEELER MARKET MARKET, SHARE(%), BY COUNTRY, 2017 - 2030
- Figure 170:
- GLOBAL TWO-WHEELER MARKET MARKET, SHARE(%), BY COUNTRY, 2017 - 2030
- Figure 171:
- GLOBAL TWO-WHEELER MARKET, BY CANADA, BY VOLUME IN UNITS, 2017 - 2030
- Figure 172:
- GLOBAL TWO-WHEELER MARKET, BY CANADA, BY VALUE IN USD, 2017 - 2030
- Figure 173:
- GLOBAL TWO-WHEELER MARKET MARKET, SHARE(%), BY PROPULSION TYPE, 2017 - 2030
- Figure 174:
- GLOBAL TWO-WHEELER MARKET, BY MEXICO, BY VOLUME IN UNITS, 2017 - 2030
- Figure 175:
- GLOBAL TWO-WHEELER MARKET, BY MEXICO, BY VALUE IN USD, 2017 - 2030
- Figure 176:
- GLOBAL TWO-WHEELER MARKET MARKET, SHARE(%), BY PROPULSION TYPE, 2017 - 2030
- Figure 177:
- GLOBAL TWO-WHEELER MARKET, BY US, BY VOLUME IN UNITS, 2017 - 2030
- Figure 178:
- GLOBAL TWO-WHEELER MARKET, BY US, BY VALUE IN USD, 2017 - 2030
- Figure 179:
- GLOBAL TWO-WHEELER MARKET MARKET, SHARE(%), BY PROPULSION TYPE, 2017 - 2030
- Figure 180:
- GLOBAL TWO-WHEELER MARKET, BY COUNTRY, BY VOLUME IN UNITS, 2017 - 2030
- Figure 181:
- GLOBAL TWO-WHEELER MARKET, BY COUNTRY, BY VALUE IN USD, 2017 - 2030
- Figure 182:
- GLOBAL TWO-WHEELER MARKET MARKET, SHARE(%), BY COUNTRY, 2017 - 2030
- Figure 183:
- GLOBAL TWO-WHEELER MARKET MARKET, SHARE(%), BY COUNTRY, 2017 - 2030
- Figure 184:
- GLOBAL TWO-WHEELER MARKET, BY ARGENTINA, BY VOLUME IN UNITS, 2017 - 2030
- Figure 185:
- GLOBAL TWO-WHEELER MARKET, BY ARGENTINA, BY VALUE IN USD, 2017 - 2030
- Figure 186:
- GLOBAL TWO-WHEELER MARKET MARKET, SHARE(%), BY PROPULSION TYPE, 2017 - 2030
- Figure 187:
- GLOBAL TWO-WHEELER MARKET, BY BRAZIL, BY VOLUME IN UNITS, 2017 - 2030
- Figure 188:
- GLOBAL TWO-WHEELER MARKET, BY BRAZIL, BY VALUE IN USD, 2017 - 2030
- Figure 189:
- GLOBAL TWO-WHEELER MARKET MARKET, SHARE(%), BY PROPULSION TYPE, 2017 - 2030
- Figure 190:
- GLOBAL TWO-WHEELER MARKET, BY REST-OF-SOUTH AMERICA, BY VOLUME IN UNITS, 2017 - 2030
- Figure 191:
- GLOBAL TWO-WHEELER MARKET, BY REST-OF-SOUTH AMERICA, BY VALUE IN USD, 2017 - 2030
- Figure 192:
- GLOBAL TWO-WHEELER MARKET MARKET, SHARE(%), BY PROPULSION TYPE, 2017 - 2030
- Figure 193:
- GLOBAL TWO-WHEELER MARKET, MOST ACTIVE COMPANIES, BY NUMBER OF STRATEGIC MOVES, 2017 - 2030
- Figure 194:
- GLOBAL TWO-WHEELER MARKET, MOST ADOPTED STRATEGIES, 2017 - 2030
- Figure 195:
- GLOBAL TWO-WHEELER MARKET SHARE(%), BY MAJOR PLAYERS
Two-Wheeler Industry Segmentation
Electric, Hybrid and Electric Vehicles, ICE are covered as segments by Propulsion Type. Africa, Asia-Pacific, Europe, Middle East, North America, South America are covered as segments by Region.| Propulsion Type | Electric | ||
| Hybrid and Electric Vehicles | |||
| ICE | |||
| Region | Africa | South Africa | |
| Rest-of-Africa | |||
| Asia-Pacific | Australia | ||
| China | |||
| India | |||
| Indonesia | |||
| Japan | |||
| Malaysia | |||
| South Korea | |||
| Thailand | |||
| Rest-of-APAC | |||
| Europe | Austria | ||
| Belgium | |||
| Czech Republic | |||
| Denmark | |||
| Estonia | |||
| France | |||
| Germany | |||
| Ireland | |||
| Italy | |||
| Latvia | |||
| Lithuania | |||
| Norway | |||
| Poland | |||
| Russia | |||
| Spain | |||
| Sweden | |||
| UK | |||
| Rest-of-Europe | |||
| Middle East | Saudi Arabia | ||
| UAE | |||
| Rest-of-Middle East | |||
| North America | Canada | ||
| Mexico | |||
| US | |||
| South America | Argentina | ||
| Brazil | |||
| Rest-of-South America | |||
Need A Different Region or Segment?
Customize Now
Market Definition
- Vehicle Type - The category covers motorized two-wheelers.
- Vehicle Body Type - This includes Scooters and Motorcycles, while Kick-scooters and Bicycles are excluded.
- Fuel Category - Coverage extends to vehicles powered by Internal Combustion Engines (ICE) and electric propulsion systems.
| Keyword | Definition |
|---|---|
| Electric Vehicle (EV) | A vehicle which uses one or more electric motors for propulsion. Includes cars, buses, and trucks. This term includes all-electric vehicles or battery electric vehicles and plug-in hybrid electric vehicles. |
| BEV | A BEV relies completely on a battery and a motor for propulsion. The battery in the vehicle must be charged by plugging it into an outlet or public charging station. BEVs do not have an ICE and hence are pollution-free. They have a low cost of operation and reduced engine noise as compared to conventional fuel engines. However, they have a shorter range and higher prices than their equivalent gasoline models. |
| PEV | A plug-in electric vehicle is an electric vehicle that can be externally charged and generally includes all-electric vehicles as well as plug-in hybrids. |
| Plug-in Hybrid EV | A vehicle that can be powered either by an ICE or an electric motor. In contrast to normal hybrid EVs, they can be charged externally. |
| Internal combustion engine | An engine in which the burning of fuels occurs in a confined space called a combustion chamber. Usually run with gasoline/petrol or diesel. |
| Hybrid EV | A vehicle powered by an ICE in combination with one or more electric motors that use energy stored in batteries. These are continually recharged with power from the ICE and regenerative braking. |
| Commercial Vehicles | Commercial vehicles are motorized road vehicles designed for transporting people or goods. The category includes light commercial vehicles (LCVs) and medium and heavy-duty vehicles (M&HCV). |
| Passenger Vehicles | Passenger cars are electric motor– or engine-driven vehicles with at least four wheels. These vehicles are used for the transport of passengers and comprise no more than eight seats in addition to the driver’s seat. |
| Light Commercial Vehicles | Commercial vehicles that weigh less than 6,000 lb (Class 1) and in the range of 6,001–10,000 lb (Class 2) are covered under this category. |
| M&HDT | Commercial vehicles that weigh in the range of 10,001–14,000 lb (Class 3), 14,001–16,000 lb (Class 4), 16,001–19,500 lb (Class 5), 19,501–26,000 lb (Class 6), 26,001–33,000 lb (Class 7) and above 33,001 lb (Class 8) are covered under this category. |
| Bus | A mode of transportation that typically refers to a large vehicle designed to carry passengers over long distances. This includes transit bus, school bus, shuttle bus, and trolleybuses. |
| Diesel | It includes vehicles that use diesel as their primary fuel. A diesel engine vehicle have a compression-ignited injection system rather than the spark-ignited system used by most gasoline vehicles. In such vehicles, fuel is injected into the combustion chamber and ignited by the high temperature achieved when gas is greatly compressed. |
| Gasoline | It includes vehicles that use gas/petrol as their primary fuel. A gasoline car typically uses a spark-ignited internal combustion engine. In such vehicles, fuel is injected into either the intake manifold or the combustion chamber, where it is combined with air, and the air/fuel mixture is ignited by the spark from a spark plug. |
| LPG | It includes vehicles that use LPG as their primary fuel. Both dedicated and bi-fuel LPG vehicles are considered under the scope of the study. |
| CNG | It includes vehicles that use CNG as their primary fuel. These are vehicles that operate like gasoline-powered vehicles with spark-ignited internal combustion engines. |
| HEV | All the electric vehicles that use batteries and an internal combustion engine (ICE) as their primary source for propulsion are considered under this category. HEVs generally use a diesel-electric powertrain and are also known as hybrid diesel-electric vehicles. An HEV converts the vehicle momentum (kinetic energy) into electricity that recharges the battery when the vehicle slows down or stops. The battery of HEV cannot be charged using plug-in devices. |
| PHEV | PHEVs are powered by a battery as well as an ICE. The battery can be charged through either regenerative breaking using the ICE or by plugging into some external charging source. PHEVs have a better range than BEVs but are comparatively less eco-friendly. |
| Hatchback | These are compact-sized cars with a hatch-type door provided at the rear end. |
| Sedan | These are usually two- or four-door passenger cars, with a separate area provided at the rear end for luggage. |
| SUV | Popularly known as SUVs, these cars come with four-wheel drive, and usually have high ground clearance. These cars can also be used as off-road vehicles. |
| MPV | These are multi-purpose vehicles (also called minivans) designed to carry a larger number of passengers. They carry between five and seven people and have room for luggage too. They are usually taller than the average family saloon car, to provide greater headroom and ease of access, and they are usually front-wheel drive. |
Need More Details on Market Definition?
Ask a Question
Research Methodology
Mordor Intelligence follows a four-step methodology in all its reports.
- Step-1: Identify Key Variables: To build a robust forecasting methodology, the variables and factors identified in Step-1 are tested against available historical market numbers. Through an iterative process, the variables required for market forecast are set and the model is built based on these variables.
- Step-2: Build a Market Model: Market-size estimations for the historical and forecast years have been provided in revenue and volume terms. Market revenue is calculated by multiplying the sales volume with their respective average selling price (ASP). While estimating ASP factors like average inflation, market demand shift, manufacturing cost, technological advancement, and varying consumer preference, among others have been taken into account.
- Step-3: Validate and Finalize: In this important step, all market numbers, variables, and analyst calls are validated through an extensive network of primary research experts from the market studied. The respondents are selected across levels and functions to generate a holistic picture of the market studied.
- Step-4: Research Outputs: Syndicated Reports, Custom Consulting Assignments, Databases & Subscription Platforms.

Get More Details On Research Methodology
Download PDF


