
Market Overview
| Study Period | 2020 - 2031 |
|---|---|
| Market Size (2026) | USD 83.42 Billion |
| Market Size (2031) | USD 98.83 Billion |
| Growth Rate (2026 - 2031) | 3.45 % |
| Fastest Growing Market | Asia-Pacific |
| Largest Market | Europe |
| Market Concentration | Medium |
Major Players *Disclaimer: Major Players sorted in no particular order Image © Mordor Intelligence. Reuse requires attribution under CC BY 4.0. | |
Trade Finance Market Analysis by Mordor Intelligence
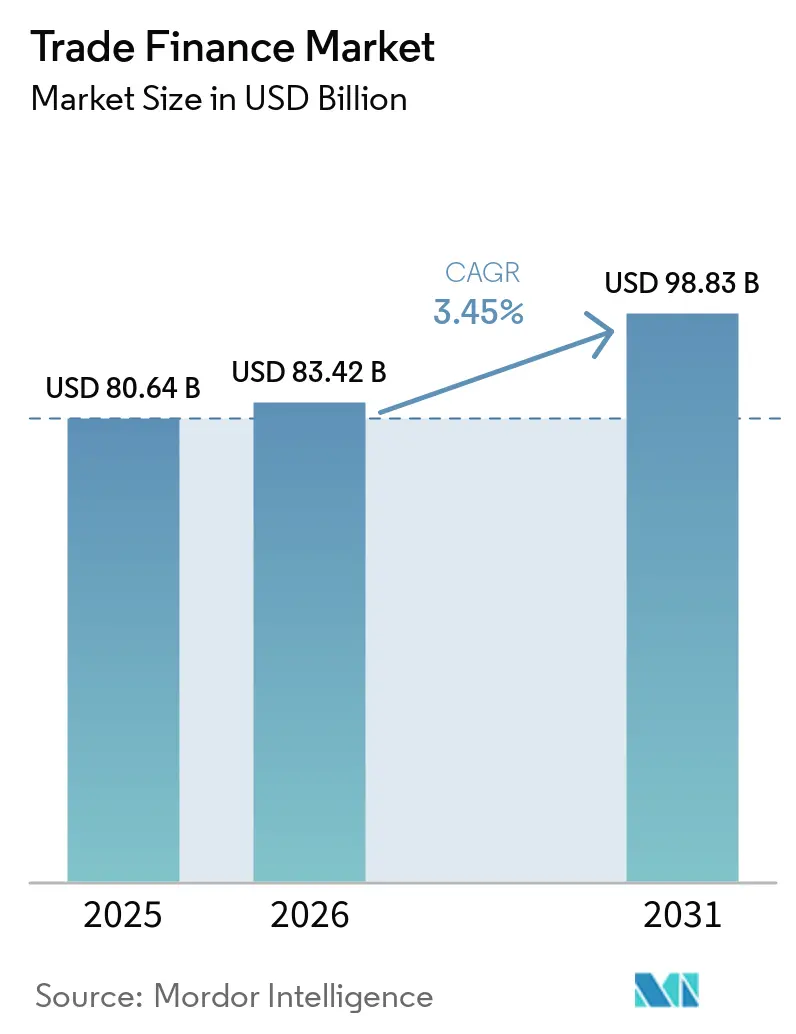
Trade Finance Market size in 2026 is estimated at USD 83.42 billion, growing from 2025 value of USD 80.64 billion with 2031 projections showing USD 98.83 billion, growing at 3.45% CAGR over 2026-2031.
Demand in the trade finance market is pivoting toward digital, open-account solutions even as letters of credit remain indispensable in high-risk corridors. Regulatory modernization through the Model Law on Electronic Transferable Records (MLETR) and rising blockchain adoption are reducing documentation friction and broadening investor appetite for receivable-backed instruments. The unresolved USD 2.5 trillion gap in SME trade finance continues to pressure banks and spur fintech innovation. Geopolitical flashpoints are simultaneously redirecting trade flows and intensifying compliance spending for anti-money-laundering (AML) controls.
Key Report Takeaways
- By product type, documentary instruments dominated with 65.72% of the trade finance market share in 2025, while non-documentary products are projected to grow at a 4.39% CAGR through 2031.
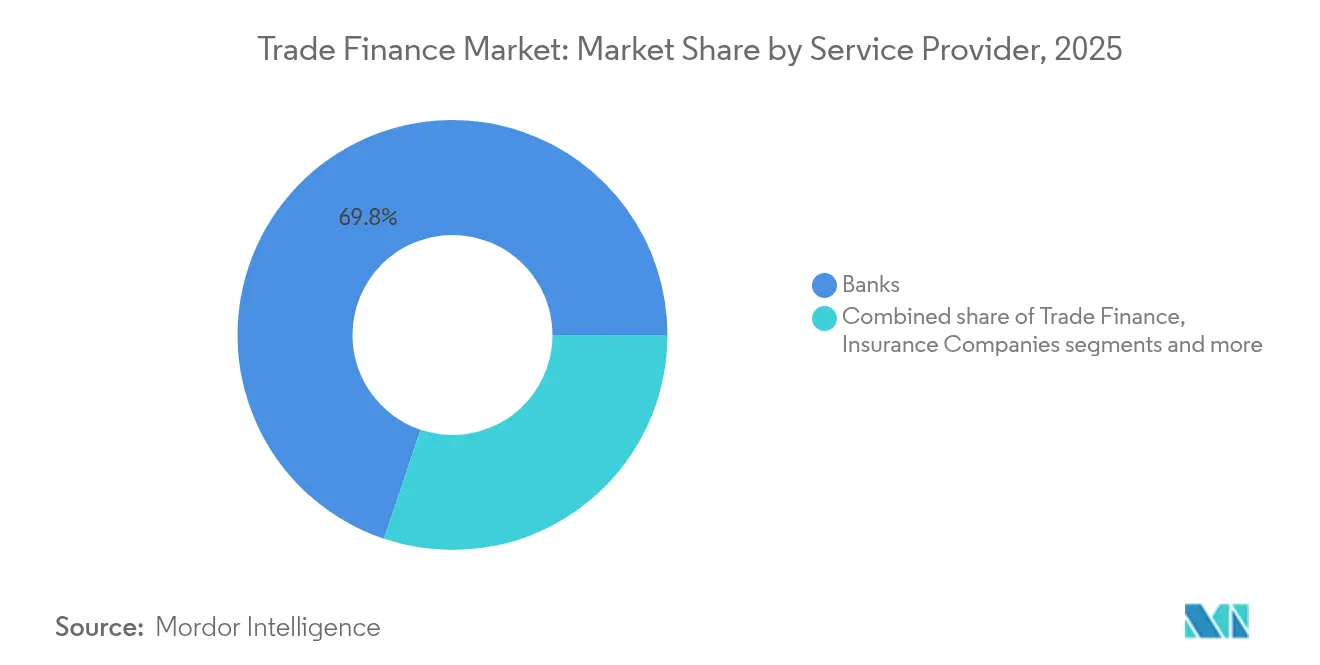
- By service provider, banks held 69.84% revenue share of the trade finance market size in 2025, whereas fintech platforms are expanding at a 4.75% CAGR to 2031.
- By application, international transactions captured 61.35% of the trade finance market size in 2025, and the domestic segment is set to advance at a 5.61% CAGR to 2031.
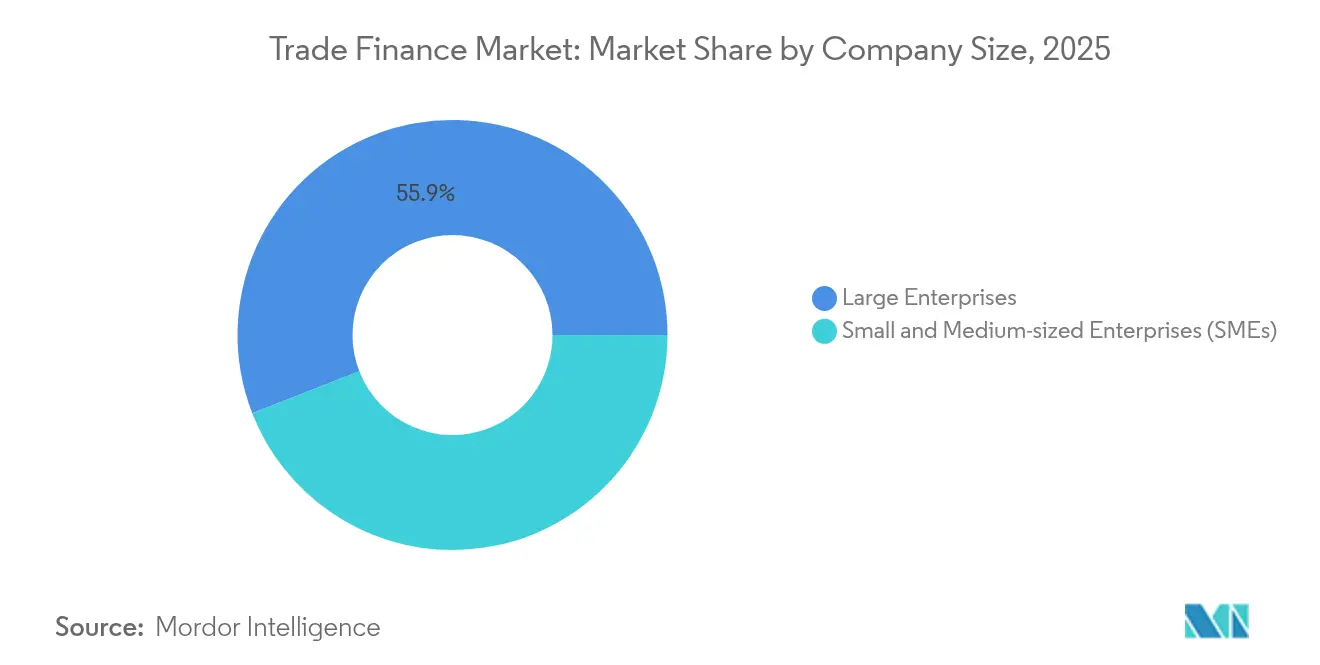
- By company size, large enterprises accounted for 55.92% of the trade finance market share in 2025; SMEs are forecast to post the fastest 4.05% CAGR by 2031.
- By geography, Asia-Pacific led with 38.12% of trade finance market share in 2025 and is on track for a 5.68% CAGR through 2031.
Note: Market size and forecast figures in this report are generated using Mordor Intelligence’s proprietary estimation framework, updated with the latest available data and insights as of 2026.
Market Trends and Insights
Drivers Impact Analysis of Trade Finance Market*
| Driver | (~) % Impact on CAGR Forecast | Geographic Relevance | Impact Timeline |
|---|---|---|---|
| Trade digitization & blockchain adoption | +1.2% | Global, with APAC and Europe leading | Medium term (2-4 years) |
| Expansion of cross-border e-commerce | +0.8% | Global, concentrated in APAC and North America | Short term (≤ 2 years) |
| Rising global merchandise trade volumes | +0.6% | Global, with emerging markets driving growth | Long term (≥ 4 years) |
| Capital-markets securitization of trade receivables | +0.4% | North America & EU, expanding to APAC | Medium term (2-4 years) |
| Legal recognition of electronic trade documents | +0.5% | UK, Singapore, EU progressive adoption | Medium term (2-4 years) |
| Embedded B2B payment & virtual-card working-capital programs | +0.3% | North America and Europe, expanding globally | Short term (≤ 2 years) |
| Source: Mordor Intelligence | |||


Trade Digitization & Blockchain Adoption
Contour’s live blockchain network now cuts letter-of-credit approval cycles from 10 days to under 24 hours, proving that distributed ledgers deliver tangible process savings. September 2025 saw SWIFT unveil a prototype blockchain ledger that records real-time settlement data for more than 11,000 institutions worldwide[1]SWIFT, “SWIFT Unveils Blockchain-based Platform for 24/7 Payments,” swift.com. Tokenization is broadening collateral pools, allowing banks to refinance trade receivables in capital markets and unlock secondary liquidity. Despite these benefits, multiple closed-loop platforms create “digital islands,” forcing corporates to fund sizable integration budgets for multi-network connectivity. Interoperability toolkits and common data standards are therefore becoming prerequisites for network-wide scale[2]HSBC Holdings, “Tokenised Deposits Pilot,” hsbc.com.
Expansion of Cross-Border E-Commerce
B2B cross-border payment volumes are projected to hit USD 56 trillion by 2030 at a 5.6% CAGR, reflecting surging marketplace procurement. Retailers such as Walmart Business embed TreviPay credit terms directly into checkout journeys, compressing onboarding times for suppliers that lack traditional bank lines. Open-account structures increasingly replace documentary collection as buyers leverage data visibility to manage payment risk. For banks, the shift demands API-centric platforms capable of streaming credit decisions into e-commerce workflows in real time. The outcome is a blended service model where lending, payments, and reconciliation converge on a single digital channel.
Rising Global Merchandise Trade Volumes
Despite sanctions and shipping reroutes, global seaborne cargo reached a record high in 2024, with freight rates doubling after Suez Canal traffic fell 60% due to Red Sea risks. Connector economies such as Vietnam and Mexico saw export surges as multinationals diversified sourcing locations to hedge geopolitical uncertainty. Just-in-case inventory strategies now extend financing tenors, boosting demand for supply-chain finance that cushions supplier cash flow. Banks are pairing trade-credit insurance with receivables discounting to keep balance-sheet-light exposures while supporting turnover growth. As global volumes climb, more counterparties qualify for financing, helping narrow the trade finance gap, particularly in emerging Asia.
Capital-Markets Securitization of Trade Receivables
Institutional demand for short-duration, self-liquidating assets is drawing pension funds into tokenized trade portfolios on platforms such as Tradeteq. MLETR-enabled electronic documents make asset pools legally enforceable and easily auditable, eroding the historical opacity that discouraged investors. ITFA’s Trade Finance Investment Ecosystem seeks to connect originators with structured-credit desks, creating a scalable distribution channel beyond bank balance sheets. Successful pilot deals in 2025 benchmarked spreads 20–30 basis points inside conventional asset-backed securities of similar tenor, signaling growing acceptance. The deepening investor base amplifies overall trade finance market capacity and gradually moderates pricing for SME borrowers.
Restraints Impact Analysis of Trade Finance Market*
| Restraint | (~) % Impact on CAGR Forecast | Geographic Relevance | Impact Timeline |
|---|---|---|---|
| Stringent AML / KYC compliance burdens | -0.7% | Global, with emerging markets most affected | Short term (≤ 2 years) |
| Geopolitical trade tensions & sanctions | -0.5% | Global, concentrated in conflict-affected regions | Medium term (2-4 years) |
| Shrinking correspondent-banking network in frontier markets | -0.4% | Africa, Latin America, Central Asia frontier markets | Long term (≥ 4 years) |
| Rising trade-credit-insurance premiums | -0.3% | Global, with higher impact in high-risk regions | Medium term (2-4 years) |
| Source: Mordor Intelligence | |||
Stringent AML / KYC Compliance Burdens
Large banks now spend up to USD 175 million annually on KYC reviews, diverting capital from lending activities. The EU AML package launching in July 2025 introduces a new supervisory agency with direct enforcement powers, raising documentation thresholds for trade transactions above EUR 1 million. Only 4% of institutions have automated KYC workflows, causing onboarding delays that prompt 67% of banks to off-board higher-risk SMEs[3]Fenergo, “AML & KYC Compliance Costs Benchmark Report 2025,” fenergo.com. Dual-use goods checks require AI models to scan bills of materials and flag military end uses, a capability most legacy systems lack. Compliance teams must therefore integrate advanced analytics or risk losing share to digitally native competitors.
Geopolitical Trade Tensions & Sanctions
Sanctions on Russia, Iran, and select Chinese entities have expanded secondary exposure risk, compelling banks to isolate correspondent routes by political bloc. ScienceDirect studies observe that sanction-hit economies suffer sharper declines in credit availability than in trade volumes, underscoring financial-sector vulnerability. U.S. congressional proposals for 100% tariffs on oil purchasers linked to sanctioned states further heighten compliance scrutiny. De-risking has already driven a 21% reduction in correspondent-banking lines into Sub-Saharan Africa since 2022. Banks must therefore restructure liquidity corridors and deploy regional hubs capable of localized screening, adding operational costs.
*Our forecasts treat driver/restraint impacts as directional, not additive. The impact forecasts reflect baseline growth, mix effects, and variable interactions.
Trade Finance Market Segment Analysis
By Product Type:
Documentary Dominance Faces Digital DisruptionDocumentary products retained 65.72% of the trade finance market share in 2025 because letters of credit offer non-payment protection vital in volatile corridors. Nevertheless, non-documentary solutions are on a 4.39% CAGR trajectory, propelled by open-account trade that favors speed and lower fees. The global trade finance market size for non-documentary structures could surpass USD 36.1 billion by 2031 if current adoption curves hold. Digitized letters of credit on blockchain preserve legal protections while compressing settlement windows, narrowing the efficiency gap with open-account models. As corporates gain confidence in credit-insurance-backed receivables, documentary reliance is expected to recede in mature trade corridors.
Open-account growth is strongest in intra-EU and intra-NAFTA shipping lanes where counterparties share established trading histories. Supply-chain-finance platforms simplify onboarding for hundreds of suppliers simultaneously, a task impractical under paper-intensive documentary processes. Yet importers operating in emerging Africa continue to demand bank guarantees to mitigate foreign-exchange volatility and sovereign-risk uncertainty. Hybrid products that embed electronic bill-of-lading data inside smart contracts are gaining adoption among logistics conglomerates seeking real-time cargo visibility. As connectivity improves, banks are recalibrating their fee structures to offset shrinking paper-processing revenues.
By Service Provider:
Banks Under Fintech PressureBanks controlled 69.84% of 2025 revenue in the trade finance market, leveraging deep balance sheet capacity to support high-value letters of credit across multiple currencies. Fintech entrants, however, are capturing share at a 4.75% CAGR by offering API-driven financing embedded within procurement and ERP platforms. The trade finance market size served by fintechs is projected to reach USD 11.2 billion by 2031 if partnerships with tier-one banks maintain current momentum. Banks increasingly white-label fintech workflows, blending regulated capital with digital user experience. Insurance carriers supply credit risk cover that underpins both bank and fintech-originated exposures, underpinning market resilience.
Fintech platforms excel at SME onboarding via alternative data analytics that cut KYC cycle time from weeks to hours. Large banks invest in token-enabled deposit services to protect their institutional franchise while matching fintech speed. Strategic equity stakes—such as Citi’s participation in Fnality’s 2025 Series C round—align balance-sheet scale with blockchain innovation. This hybrid ecosystem blurs competitive lines as banks become platform operators and fintechs rent regulatory licenses. Trade finance industry convergence is likely to accelerate, reinforcing network effects and raising entry barriers for greenfield startups.


By Application:
International Leads, Domestic AcceleratesCross-border activity accounted for 61.35% of the trade finance market size in 2025 because complex documentation still necessitates bank intermediation in multi-jurisdiction deals. Domestic financing is expanding at a 5.61% CAGR as corporations extend supply-chain-finance programs into local tier-2 and tier-3 suppliers. Digitization allows corporates to roll out dynamic discounting modules that reward early payment, improving working capital without increasing bank leverage. Domestic gains are boosted by government programs that offer subsidized guarantees for local content procurement. As regulatory complexity rises on the international side, corporates may re-balance portfolios toward less costly domestic channels.
International corridors remain indispensable for commodity flows and capital equipment, segments that typically rely on structured credits and longer maturities. Banks with regional footprints—such as HSBC in Asia or Santander in Latin America—are positioned to arbitrage compliance capabilities across multiple locations. Increased dual-use screening elevates documentary volumes in sensitive sectors like semiconductors and advanced materials. Domestic platforms circumvent some of these hurdles by anchoring credit decisions on local commercial registries rather than cross-border data feeds. The intersection of domestic fintech speed and international bank expertise is shaping product innovation across the trade finance market.
By Company Size:
SMEs Drive Growth Despite Access BarriersLarge enterprises held 55.92% of the trade finance market share in 2025, owing to multi-bank treasury relationships and better collateral options. SMEs are projected to grow at a 4.05% CAGR as digital platforms cut onboarding friction and automate invoice-level credit scoring. Embedded-finance providers insert virtual-card limits into procurement marketplaces, ensuring real-time payment guarantees for small suppliers. Nonetheless, rejection rates for SME trade-finance applications remain above 40% in frontier markets because of limited financial statements and perceived compliance risk. Multilateral institutions are therefore scaling guarantee schemes to crowd in commercial lenders and unlock capacity.
Large corporates increasingly sponsor reverse-factoring programs that direct bank liquidity to SMEs at competitive rates by leveraging the buyer’s stronger credit profile. In markets like India, accounts receivable exchanges allow SMEs to auction invoices to multiple financiers, widening funding access. Blockchain-enabled trade tokens may further democratize access by standardizing asset attributes and facilitating fractional investment by non-bank lenders. Banks face a strategic choice: either deepen SME penetration via digital channels or risk ceding ground to alternative lenders. The trade finance industry thus hinges on inclusive digital onboarding to unlock its next growth wave.
By Financing Structure:
Structured Products Lead, Non-Structured GainsStructured products secured 65.02% of the trade finance market share in 2025 because high-value commodity and project-finance deals require layered guarantees and multi-currency hedges. Non-structured financing, chiefly supply-chain finance and receivables discounting, is growing at 5.55% CAGR on the back of e-invoicing mandates and real-time data feeds. The global trade finance market size for non-structured loans could touch USD 38.5 billion by 2031 if adoption continues across mid-market exporters. Trade-credit insurers facilitate expansion by underwriting buyer default risk, thus reducing capital charges for lenders. Structured deals remain vital for new trade corridors where parties seek payment certainty until trust is established.
Digital platforms increasingly overlay blockchain provenance data atop traditional structured products in the trade finance market, creating hybrid solutions that meet both documentary rigor and automation demands. Banks package pools of supply-chain finance assets into tokenized notes for capital-markets distribution, freeing balance-sheet headroom. Non-structured products benefit from AI-driven receivables scoring that unlocks “long-tail” supplier participation. Conversely, commodity houses still require bespoke structured credits to navigate price volatility and transport risk. The future landscape will likely feature modular products that toggle between structured and non-structured attributes based on transaction context.
Geography Analysis
APAC Trade Finance Market
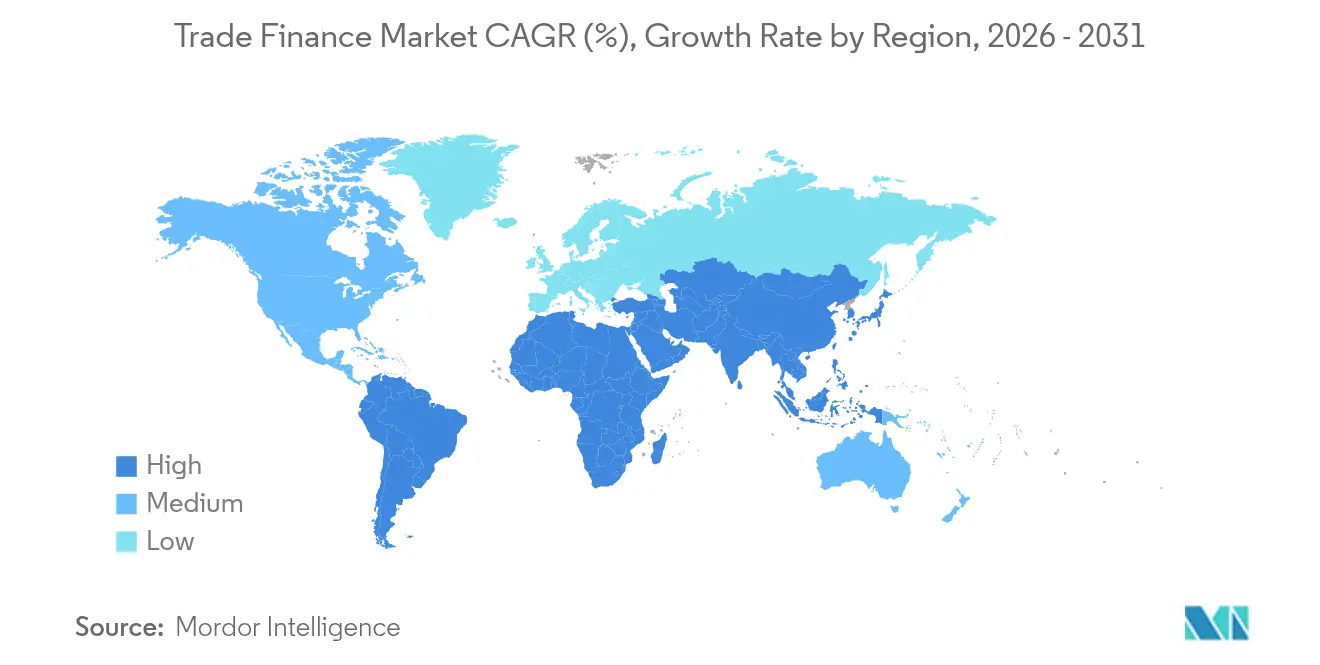
Asia-Pacific held 38.12% of the trade finance market share in 2025 and is projected to record a 5.68% CAGR through 2031, buoyed by regional manufacturing depth and progressive digital-trade frameworks. Singapore’s MLETR-driven electronic trade-document adoption gives banks legal certainty to expand tokenized supply-chain programs. Japan’s TradeWaltz consortium integrates trading houses and insurers on a single ledger, demonstrating cross-industry commitment to end-to-end digitization. China’s Belt and Road projects sustain infrastructure-linked financing even as geopolitical scrutiny rises. India’s Production-Linked Incentive (PLI) scheme accelerates export-oriented manufacturing, expanding domestic demand for pre-shipment credit.
North America Trade Finance Market
North America commands a sizable volume in the trade finance market through the U.S. dollar’s reserve-currency role and its strong fintech innovation ecosystem. The GENIUS Act gives regulatory certainty for dollar-denominated stablecoin settlement, potentially trimming cross-border payment fees that average 7% today. Mexico is emerging as a nearshoring hub, with maquiladora exports fueling incremental demand for working-capital finance. Canadian banks leverage NAFTA corridor trade data to underwrite receivables discounting more competitively than global peers. The region’s tight monetary stance may constrain uncollateralized lending, but asset-based structures remain well supported.
EMEA Trade Finance Market
Europe faces dual challenges of heightened AML scrutiny and strategic autonomy initiatives in payments. A nine-bank euro-stablecoin consortium seeks to reduce dollar reliance by introducing a MiCA-compliant token for commercial settlement in 2026. BNP Paribas retains continental trade-finance leadership and channels significant investment into blockchain pilot programs. Brexit continues to redirect flows, prompting U.K. institutions to deepen connectivity with Asia and the Middle East. The Middle East and Africa present high-growth niches, especially in Dubai’s DIFC, where tokenized gold trades back structured letters of credit, although political risk premiums temper broader regional uptake.

Regulatory Landscape
Regulation in trade finance is being shaped by two parallel tracks: legal recognition of electronic trade documents and tighter cross-border compliance and enforcement. UNCITRAL's Model Law on Electronic Transferable Records (MLETR) remains the central framework for granting legal equivalence to electronic negotiable instruments, and jurisdictions are moving at different speeds. For example, the Hong Kong Government reported progress in April 2026 on legislative amendments for B2B trade document digitalisation based on UNCITRAL MLETR, while industry bodies such as the ICC continue to push policymakers toward legal reform that enables end-to-end digital trade execution.
At the same time, supervisory and trade-policy measures are increasing documentation and data demands on cross-border flows, which raises operational requirements for banks and corporates. The EU AML package commencing in July 2025 adds supervisory intensity and elevates scrutiny for higher-value trade transactions, reinforcing KYC, beneficial ownership, and sanctions screening requirements. In the United States, a June 2026 Executive Order on strengthening customs enforcement (as analyzed by major law firms) adds pressure for more granular importer disclosures and documentation, creating further compliance burden that affects documentary trade products, open-account underwriting, and the design of automated trade-document workflows.
Value Chain Analysis
The trade finance value chain begins with trade origination by corporates (importers, exporters, and marketplace sellers) and moves through transaction structuring and credit underwriting by banks, trade finance companies, and increasingly fintech platforms that embed financing into ERP, e-procurement, and B2B checkout. Risk mitigation and balance-sheet enablement are provided by trade credit insurers, guarantors, and multilateral institutions, while settlement and document exchange rely on messaging, identity, and workflow infrastructure (for example, SWIFT connectivity and digital trade networks). Secondary distribution mechanisms, including receivables securitization and investor participation via platforms, expand capacity beyond bank balance sheets, linked to the legal enforceability and auditability of the underlying receivables and documents.
Key friction points in the chain are compliance, document authenticity, and interoperability across platforms, with many institutions still running hybrid paper and digital processes. The approximately USD 2.5 trillion SME trade finance gap highlights where onboarding, KYC, and data scarcity disrupt the chain, particularly in emerging and frontier markets. Surveys of trade banks in 2025-2026 increasingly cite regulatory compliance (sanctions, disclosure requirements, and financial crime controls) as the primary operational challenge, which increases demand for automated screening, standardized digital documentation under MLETR, and platform-to-platform connectivity that reduces manual reconciliation.
Competitive Landscape
Global competition is moderately concentrated, with the top five banks controlling an estimated 48% of aggregate volumes, reflecting entrenched client franchises and regulatory capital advantages. HSBC leads the trade finance market with USD 13.2 billion in transaction-banking revenue and continues to invest in tokenized deposits that shorten settlement cycles from days to seconds. Wells Fargo’s 2025 partnership with TradeSun for AI-driven document checking underscores how incumbents outsource innovation while safeguarding balance-sheet primacy. Technology intermediaries such as Mitigram orchestrate USD 100 billion in multibank flows, enabling corporates to price transactions across 150+ institutions on a single interface. The emergence of SWIFT’s blockchain ledger and Fnality’s USD 136 million capital raise suggests infrastructure competition will intensify at the settlement-network layer.
Regional champions also shape trade finance market dynamics. In Asia, DBS and Standard Chartered are piloting programmable money solutions tied to smart-contract trade flows. Latin America sees Santander deploying supply-chain finance tools tuned to the automotive nearshoring boom in Mexico. African fintech M-Pesa links micro-exporters to international card rails, highlighting the role of mobile money in extending trade financing to underserved segments. As cross-industry alliances proliferate, the trade finance market increasingly resembles a platform economy where orchestration skills outrank sheer balance-sheet heft.
Banks counter fintech encroachment by forming digital-asset consortia that pool compliance resources and leverage common tech stacks. ISO 20022 messaging upgrades create opportunities for automated sanctions screening and data-rich payment instructions that lower error rates. Competitive intensity is therefore migrating from price competition to technology and data-integration capabilities. Institutions unable to modernize risk disintermediation as corporates gravitate toward portals offering real-time credit decisions and embedded treasury workflows. The industry’s next consolidation wave is expected among small regional banks lacking digital budgets, opening acquisition windows for larger incumbents.
Trade Finance Industry Leaders
HSBC Holdings plc
Citigroup Inc.
BNP Paribas SA
Standard Chartered PLC
JPMorgan Chase & Co.
- *Disclaimer: Major Players sorted in no particular order

Trade Finance Market Companies Covered in this Report
- HSBC Holdings plc
- Citigroup Inc.
- BNP Paribas SA
- Standard Chartered PLC
- JPMorgan Chase & Co.
- Bank of America Corp.
- Deutsche Bank AG
- Banco Santander SA
- Mitsubishi UFJ Financial Group Inc.
- Mizuho Financial Group Inc.
- Wells Fargo & Company
- Société Générale SA
- Barclays PLC
- UBS Group AG
- Euler Hermes (Allianz Trade)
- Atradius N.V.
- Coface SA
- Tradeteq Ltd.
- Finastra Group Holdings Ltd.
- Komgo SA

Market Opportunities and Future Outlook
A primary opportunity is converting unmet SME demand into bankable, compliant exposures at scale, with the global SME trade finance gap still cited at about USD 2.5 trillion. Risk-sharing structures with multilaterals and guarantors provide an immediate pathway to expand capacity without relying solely on bank balance sheets, as shown by large facilities and portfolio guarantees announced with institutions such as IFC, AIIB, and MIGA. This also informs a product roadmap where supply chain finance, receivables discounting, and document-light working capital tools can be rolled out into markets where correspondent banking pullbacks and KYC burdens have constrained SME access.
Digital execution and legal reform create whitespace in interoperability, automation, and investable asset creation. MLETR-aligned legislation and practical adoption are tied to scaling electronic bills of lading and transferable records, supporting cleaner audit trails for underwriting and facilitating capital-markets distribution of short-duration trade assets. Industry initiatives from bodies such as the ICC and ITFA, alongside bank-led adoption of API connectivity and portal modernization (including Komgo-based workflows), support opportunities in cross-platform connectivity to reduce digital islands, AI-enabled document and compliance automation to address onboarding bottlenecks, and standardization of data and identifiers to speed up approvals and broaden investor participation in receivable-backed instruments.
Recent Industry Developments in Trade Finance Market
- July 2026: Deutsche Bank partnered with MIGA to create a EUR 1 billion trade finance portfolio guarantee platform targeting frontier and emerging markets. The structure expands risk capacity for participating lenders and supports larger trade-ticket volumes without commensurate balance-sheet growth. It also reinforces the role of multilateral guarantees as a mechanism to address the trade finance gap where compliance and sovereign-risk constraints are highest.
- June 2026: HSBC launched TradeCash, a digital trade finance solution that enables borrowers to draw down working capital using sales invoice data without uploading physical trade documentation. The product shift reduces dependence on paper-heavy processes and aligns with the market move toward open-account style execution with faster turnaround. It strengthens competitive positioning in corridors where clients prioritize speed and automated reconciliation.
- December 2024: HSBC and IFC announced a USD 1 billion trade finance program to support trade flows in emerging markets. The risk-sharing design mobilizes additional bank lending capacity toward SME and mid-market trade where rejection rates and pricing are heavily influenced by risk weights and compliance costs. It also signals sustained multilateral-bank collaboration as a practical route to broaden access to trade finance.


Trade Finance Market Report Scope and Research Methodology
Market Definition and Coverage
For this study, the market covers revenue generated from trade finance services that help buyers and sellers complete domestic and cross-border trade, mainly by reducing payment and performance risk and supporting working capital.
Scope exclusions: We exclude general corporate lending that is not linked to a specific trade transaction. We also exclude pure FX and payment processing fees when they are billed outside trade finance products.
Segments Covered in This Report
- By Product Type
- Documentary
- Non-Documentary
- By Service Provider
- Banks
- Trade Finance Companies
- Insurance Companies
- Other Service Providers
- By Application
- Domestic
- International
- By Company Size
- Large Enterprises
- Small and Medium-sized Enterprises (SMEs)
- By Financing Structure
- Structured Trade Finance
- Non-Structured Trade Financing
- By Geography
- North America
- United States
- Canada
- Mexico
- South America
- Brazil
- Peru
- Chile
- Argentina
- Rest of South America
- Europe
- United Kingdom
- Germany
- France
- Spain
- Italy
- BENELUX (Belgium, Netherlands, Luxembourg)
- NORDICS (Denmark, Finland, Iceland, Norway, Sweden)
- Rest of Europe
- Asia-Pacific
- India
- China
- Japan
- Australia
- South Korea
- South-East Asia (Singapore, Malaysia, Thailand, Indonesia, Vietnam, Philippines)
- Rest of Asia-Pacific
- Middle East and Africa
- United Arab Emirates
- Saudi Arabia
- South Africa
- Nigeria
- Rest of Middle East and Africa
- North America
Data Sources, Market Sizing, and Validation
Desk Research
Desk work starts by mapping how trade finance is reported in public datasets, and how it can be linked to trade activity, bank balance sheets, and risk disclosures. We used open sources such as World Trade Organization trade statistics, World Bank trade and macro indicators, IMF balance of payments and exchange-rate series, UN Comtrade trade-flow data, and ICC publications on trade and trade documentation.
Those inputs were then complemented with public company filings, investor presentations, annual reports, and reputable financial press to understand product mix changes, pricing patterns, and adoption of digital documentation. Where helpful, we also used paid subscriptions for company financials and intelligence, and for news and financials, to cross-check timelines and disclosures. The desk sources listed here are not exhaustive, and additional public references were used to fill gaps and confirm assumptions during the work.
Primary Interviews and Surveys
To ground the model in how deals are actually booked, we ran interviews and surveys with banks and non-bank providers, trade operations teams, and users such as importers, exporters, and logistics-adjacent finance teams across APAC, EMEA, and the Americas. The discussions helped confirm which fees are counted as trade finance, how instrument usage is shifting across letters of credit, guarantees, and open-account solutions, and where pricing and risk costs are moving over the forecast period.
Distribution of primary research fieldwork respondents
| Company type | Respondent position | Region |
|---|---|---|
| Top tier: 37% | CXOs: 18% | APAC: 41% |
| Mid tier: 41% | Functional/Unit leaders: 29% | EMEA: 33% |
| Smaller Players: 22% | Managers: 53% | Americas: 26% |
Market-Sizing & Forecasting
The sizing is built first from a top-down demand pool. We reconstruct global and regional trade flows from trade statistics, then convert them into a financeable transaction pool using instrument penetration and average fee yield assumptions. To keep it practical, we rely on variables that can be explained and rechecked, including merchandise trade value by region, share of trade using bank-intermediated instruments, typical tenor and rollover frequency for short-term facilities, fee rate ranges by instrument type, and observed shifts between documentary and non-documentary products.
After forming the total, we corroborate it with selective bottom-up approximations. This uses sampled provider revenue disclosures, channel checks on pricing, and volume-by-instrument sanity checks shared by practitioners. When direct disclosures are missing for smaller providers, gaps are handled through peer benchmarking by geography and product mix, then adjusted after interviews to avoid overstating fee capture.
For forecasting, we apply scenario analysis since trade volumes, risk appetite, and documentation adoption can shift quickly with policy and shipping disruptions. The scenarios are anchored to expected trade growth, interest-rate and spread direction, default and fraud-loss expectations, and the pace of digital document acceptance, then aligned to what interviewees view as a reasonable base case.
Data Validation & Update Cycle
We validate outputs through multiple checks so the numbers stay tied to observable signals, not a single assumption. Model totals are compared against independent indicators such as regional trade growth, bank-reported trade and supply chain finance commentary, and shifts in instrument usage shared by practitioners, and then variances are reviewed before sign-off.
When an outlier shows up, we re-check unit economics like fee yield and tenor assumptions, and we re-contact sources if the gap is explained by a product definition issue or a timing issue. Reports are refreshed annually, with interim updates when major regulatory changes, trade disruptions, or sharp FX moves materially alter market conditions. Before delivery, an analyst performs a final pass to ensure the latest public updates are reflected in the market view.
Mordor Intelligence's Global Trade Finance Market Size Compared With Other Published Estimates
Published market values for trade finance can look far apart, even when they sound like they cover the same topic, because the counted revenue streams and the timing of the year can differ. Differences also come from whether a study treats trade finance as mostly bank documentary business or includes broader open-account and supply chain solutions.
The biggest gap driver is scope. In this view, Mordor Intelligence counts trade finance as the value of trade-linked financing and fee revenue tied to defined instruments, while avoiding mixing in unrelated payment processing or general corporate lending. A second driver is the conversion from trade flows to finance revenue, since some estimates apply a single fee rate without separating documentary versus non-documentary pricing and without checking penetration shifts by region, which can move the total materially.
Benchmark comparison
| Source | Market Size | Gaps in Research Methodology |
|---|---|---|
| Mordor Intelligence | USD 83.42 B (2026) | |
| Trade Finance Services Publisher A | USD 48.90 B (2025) | This estimate appears to be narrower and closer to a services-only revenue view, which can undercount bank-led documentary instruments and structured facilities that are reported within broader transaction banking lines. |
| Syndicated Research Publisher B | USD 48.30 B (2025) | The lower value likely reflects different inclusions and a simplified trade-flow-to-revenue conversion, where fee yields and instrument mix are not clearly separated across documentary and non-documentary products or validated with regional penetration checks. |
The table shows that most of the spread can be explained by what is counted as trade finance revenue, plus how instrument mix and fee yields are applied by year. By keeping the scope tied to trade-linked instruments and by stress-testing key inputs like penetration and pricing through interviews, we keep the final number traceable to clear steps that can be repeated.


Key Questions Answered in the Report
What is the current value of the trade finance market?
The trade finance market stands at USD 83.42 billion in 2026 and is on track to reach USD 98.83 billion by 2031.
Which region is growing fastest?
Asia-Pacific leads with a 5.68% CAGR due to strong manufacturing activity and pro-digital regulations.
How large is the trade finance gap for SMEs?
The unmet demand for SME trade finance is estimated at USD 2.5 trillion, highlighting significant growth potential.
What technology trend is most transformative?
Blockchain-based digitization of letters of credit is slashing approval times from 10 days to under 24 hours.
Who holds the largest market share?
Banks remain dominant, with HSBC leading on USD 13.2 billion in transaction-banking revenue.
Page last updated on:


 Your data is secure and never sold or shared.


