
Thermocouple Temperature Sensors Market Size and Share
Market Overview
| Study Period | 2020 - 2031 |
|---|---|
| Market Size (2026) | USD 7.46 Billion |
| Market Size (2031) | USD 10.77 Billion |
| Growth Rate (2026 - 2031) | 7.62 % |
| Fastest Growing Market | Middle East |
| Largest Market | Asia Pacific |
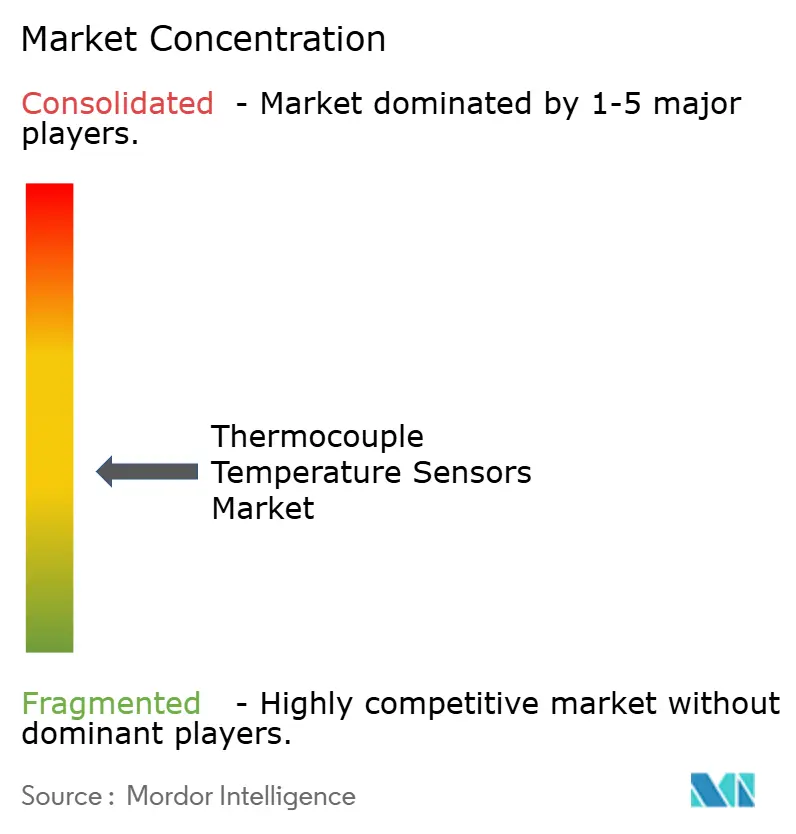
| Market Concentration | Medium |
Major Players *Disclaimer: Major Players sorted in no particular order Image © Mordor Intelligence. Reuse requires attribution under CC BY 4.0. | |
Thermocouple Temperature Sensors Market Analysis by Mordor Intelligence
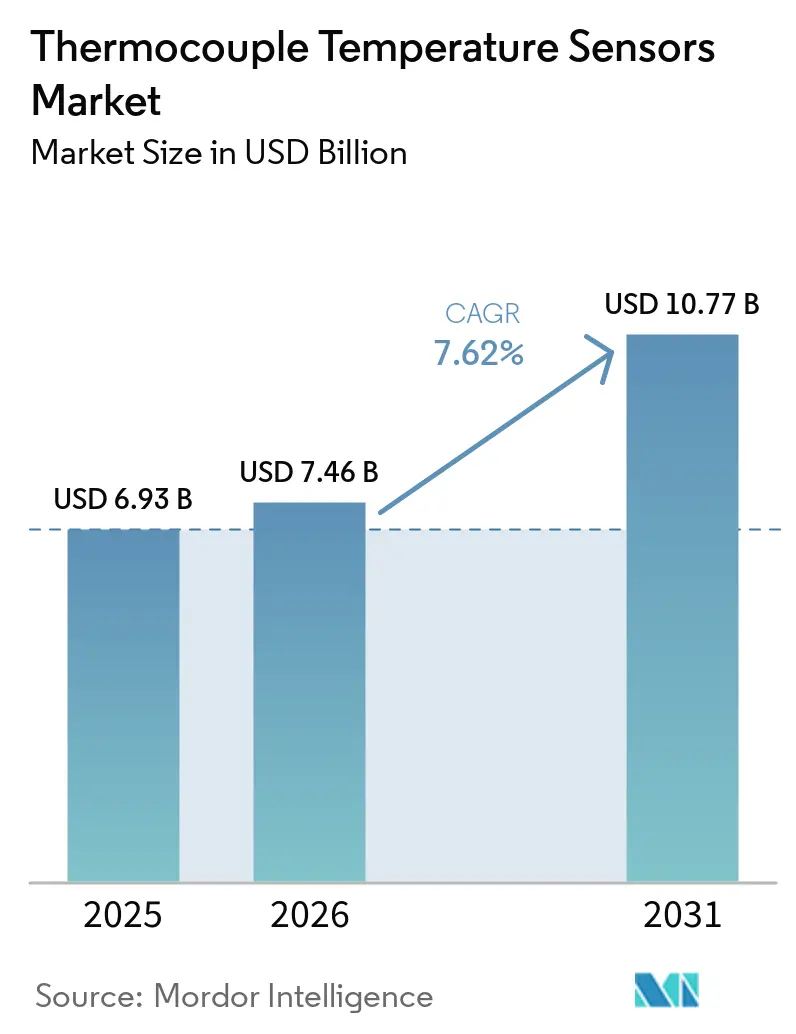
Thermocouple temperature sensors market size in 2026 is estimated at USD 7.46 billion, growing from 2025 value of USD 6.93 billion with 2031 projections showing USD 10.77 billion, growing at 7.62% CAGR over 2026-2031. Demand stems from industries where real-time thermal data underpins efficiency, safety and yield—especially at temperatures where RTDs and thermistors fall short. Expansion in Industry 4.0 retrofits, green-hydrogen electrolysers, LNG infrastructure and EV battery gigafactories is elevating use cases that favour Type K, N and T probes. At the same time, digital networking standards such as EtherNet/IP profiles are turning legacy sensors into smart nodes that feed predictive-maintenance platforms. Intensifying competition comes from low-cost Asian imports and fiber-optic alternatives, yet regulatory mandates for tighter motor-efficiency tests and embedded monitoring add fresh tailwinds. [1]
Key Report Takeaways
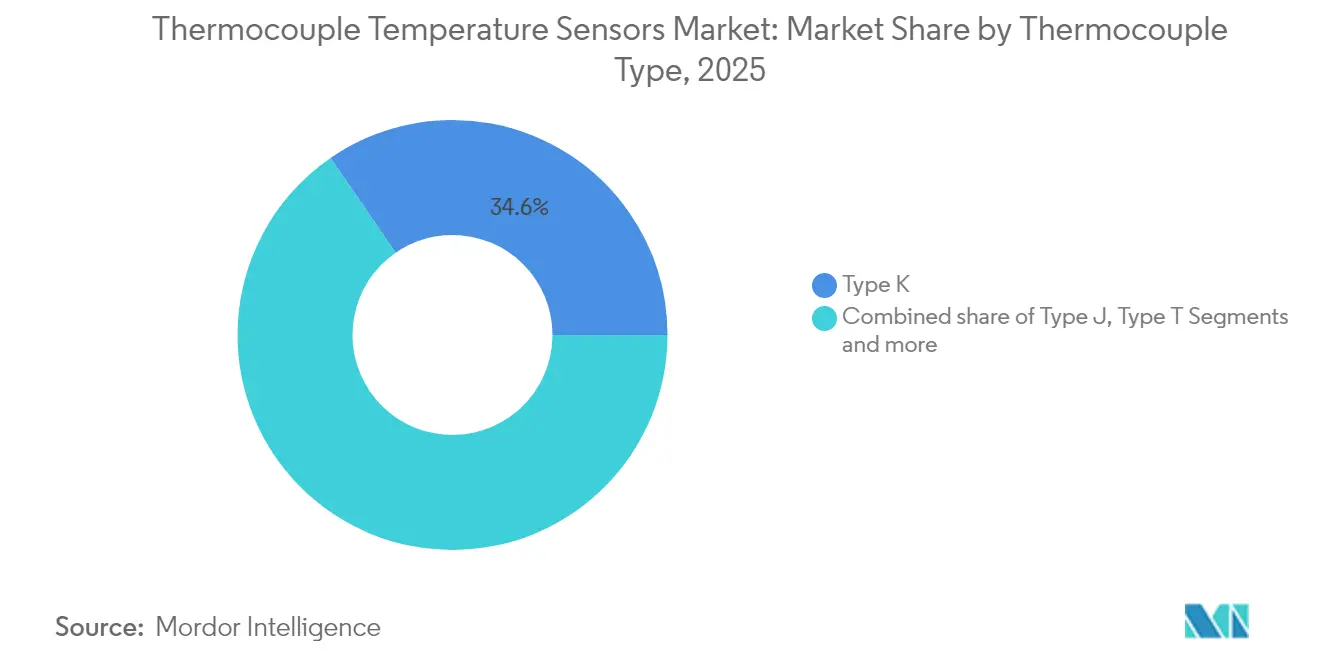
- By thermocouple type: Type K held 34.60% of the thermocouple temperature sensors market share in 2025, while Type N is projected to grow at an 8.78% CAGR through 2031.
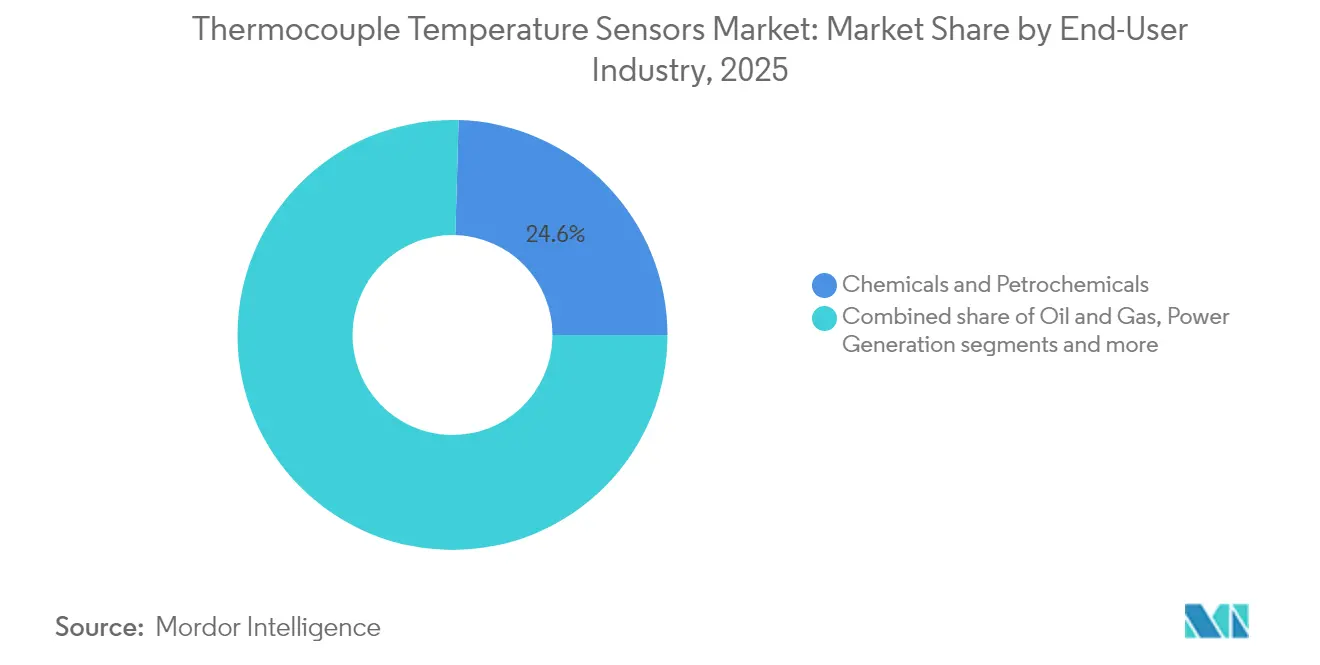
- By end-user industry: Chemicals & petrochemicals accounted for 24.55% share of the thermocouple temperature sensors market size in 2025; automotive & EV batteries are advancing at a 11.76% CAGR to 2031.
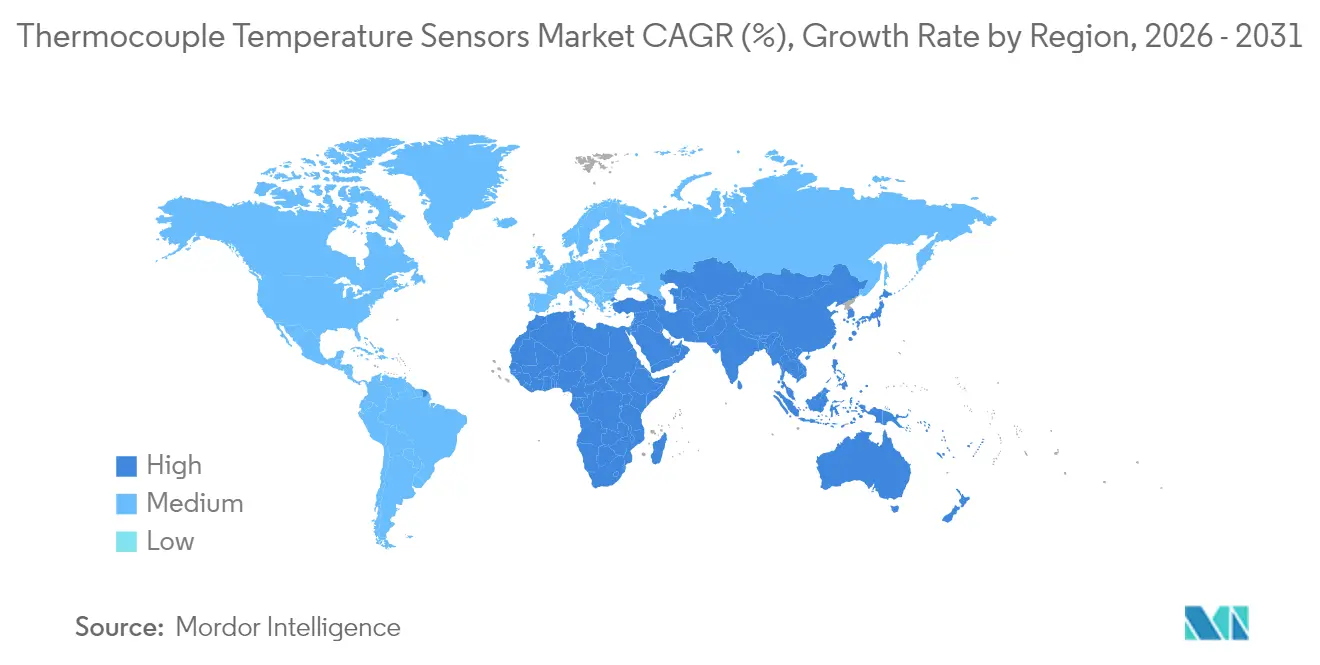
- By region: Asia Pacific led with 41.70% revenue share in 2025; the Middle East is set to expand at a 9.40% CAGR between 2026-2031.
- By temperature range: The 350 °C–700 °C segment captured 39.25% of the thermocouple temperature sensors market size in 2025, whereas applications above 700 °C are forecast to rise at 7.98% CAGR.
Note: Market size and forecast figures in this report are generated using Mordor Intelligence’s proprietary estimation framework, updated with the latest available data and insights as of 2026.
Market Trends and Insights
Drivers Impact Analysis of Thermocouple Temperature Sensors Market*
| Driver | ( ~ ) % Impact on CAGR Forecast | Geographic Relevance | Impact Timeline |
|---|---|---|---|
| Shift toward predictive maintenance in Industry 4.0 boosting multi-point thermocouple retrofits across European factories | +1.2% | Europe, North America | Medium term (2-4 years) |
| Expansion of green-hydrogen electrolyzer build-outs (>800 °C monitoring) in Asia Pacific | +0.8% | Asia Pacific, Europe | Long term (≥ 4 years) |
| LNG regasification terminal build-outs requiring cryogenic Type-T probes in North America | +0.7% | North America, Asia Pacific | Medium term (2-4 years) |
| EV battery gigafactory kiln installations in China demanding high-accuracy Type-K sensors | +1.5% | Asia Pacific, North America, Europe | Short term (≤ 2 years) |
| EU Regulation 2019/1781 mandating tighter motor-efficiency tests and embedded thermocouples | +0.9% | Europe, Global | Medium term (2-4 years) |
| Source: Mordor Intelligence | |||
Predictive maintenance driving multi-point thermocouple adoption
Factory operators adopting Industry 4.0 standards are replacing single-point sensors with multi-point thermocouple strings that create detailed thermal maps. When paired with machine-learning algorithms, these arrays detect drift or hotspots weeks ahead of a fault, reducing unplanned downtime by up to 30%. European plants pioneered the retrofit wave, yet North American automakers and chemical processors are following as CEN Workshop Agreement 18038 offers a blueprint for data-driven maintenance. Broader adoption is fuelled by falling computing costs and ODVA’s plug-and-play EtherNet/IP profiles that shrink integration time. As more plants normalize thermal profiling, suppliers able to bundle sensors with analytics services capture higher margins. [2]
Green hydrogen driving high-temperature monitoring demand
Scaling of solid-oxide electrolyser cells pushes operating zones beyond 800 °C, a threshold where Type N and upgraded Type K probes outclass other metal-based sensors. Continuous profiling guards against thermal cycling that shortens stack life, and California Energy Commission grants have sharpened global attention on temperature-control protocols. Asian electrolyser vendors now specify pre-welded mineral-insulated (MI) assemblies rated for hydrogen exposure, creating a premium tier within the thermocouple temperature sensors market. As European climate-policy funds funnel into green-hydrogen clusters, collective demand for ultra-stable probes widens the addressable sales pool well past pilot plants. [3]
LNG infrastructure expansion boosts cryogenic sensor demand
North America is ramping LNG export capacity, and each liquefaction or regasification train can house hundreds of Type T points that measure as low as –200 °C. Precise cryogenic control curbs boil-off gas losses and prevents brittle-fracture hazards, leading to robust specification of copper-constantan probes despite price competition in other segments. Because LNG contracts reward energy efficiency, operators accept a premium for Class-A accuracy probes with third-party certifications. The same design expertise travels to Asia-Pacific import terminals, giving established suppliers avenues to sidestep commoditized markets while leveraging volume manufacturing.
EV battery manufacturing driving precision temperature control
In gigafactories, kiln temperatures during electrode coating and solvent drying dictate porosity and adhesion. Research documents that ±5 °C swings can erode cell capacity and safety limits. High-accuracy Type K assemblies, often with ungrounded junctions to avoid ground-loop interference, are embedded across conveyors and formation lines. China’s rapid capacity additions absorb the bulk of demand, yet European projects scheduled for 2025-2027 are adopting similar sensor counts per gigawatt-hour. IoT gateways now aggregate these probes, enabling closed-loop heater control that lifts first-pass yield. The trend pushes suppliers to integrate self-diagnostics and digital calibration chips, differentiating premium offerings.
Restraints Impact Analysis of Thermocouple Temperature Sensors Market*
| Restraint | ( ~ ) % Impact on CAGR Forecast | Geographic Relevance | Impact Timeline |
|---|---|---|---|
| Price erosion from commoditized K & J imports out of low-cost Asian supply chains | -0.9% | Global, most acute in North America and Europe | Short term (≤ 2 years) |
| Substitution threat from fiber-optic sensors in high-EMI aerospace engines | -0.6% | North America, Europe | Medium term (2-4 years) |
| Calibration drift >1 200 °C limiting use in semiconductor epitaxy lines | -0.5% | Asia Pacific, North America | Medium term (2-4 years) |
| Nickel & chromium supply volatility disrupting MI-cable probe output in Europe | -0.7% | Europe | Short term (≤ 2 years) |
| Source: Mordor Intelligence | |||
Price erosion challenging Western manufacturers
A surge of low-cost K and J probes from China and India has cut average selling prices by 15-20% since 2023, squeezing margins on standard assemblies that make up over half of unit volumes. Asian vendors also ship MI cables at 30-40% discounts, forcing legacy brands to pivot toward specialized designs or service-heavy contracts. Distributors in the United States report inventory turns slowing as end users defer replacements in anticipation of further price drops. Short-cycle inflationary spikes in nickel and chromium amplify cost control woes for European firms, yet buyers remain reluctant to shoulder surcharges, deepening the restraint on revenue growth.
Fiber-optic sensors threatening high-EMI applications
Fluorescence-based fiber-optic systems deliver ±0.1 °C accuracy across 200 °C–1600 °C while remaining immune to EMI, a critical trait inside turbine nacelles and generator stators. Aerospace primes increasingly evaluate optical suites that dispense with shielding and reduce wiring weight. Thermocouple vendors counter with dual-redundant junctions and EMI-hardened transmitters, but mission-critical contracts may still swing toward optics over the medium term. Loss of these high-margin niches tempers the otherwise healthy outlook of the thermocouple temperature sensors market.
*Our forecasts treat driver/restraint impacts as directional, not additive. The impact forecasts reflect baseline growth, mix effects, and variable interactions.
Thermocouple Temperature Sensors Market Segment Analysis
By Thermocouple Type:
Type N consolidates stability advantagesType K maintained a 34.60% hold on the thermocouple temperature sensors market share in 2025 on versatility across –200 °C to +1350 °C. That span covers mainstream manufacturing, food processing and HVAC loops, positioning the variant for volume contracts even as commoditization trims margins. Type N, however, is capturing orders in aerospace test stands and hydrogen reactors at an 8.78% CAGR through 2031, aided by immunity to green-rot oxidation. OEMs see life-cycle savings from longer calibration intervals, swinging purchasing departments toward higher upfront costs. Emerging R, S and B alloys remain priced for boutique ultra-high-temperature work, but incremental breakthroughs in platinum wire purity are nudging them into semiconductor epitaxy lines where 1200 °C drift control is paramount.
Recent material science gains widen adoption envelopes. Thin-film deposition now embeds micron-scale thermocouple grids on ceramic substrates, serving real-time wafer temperature measurement. Suppliers highlight alumina insulation and Fibro Platinum wire for 1600 °C continuous service, enabling glass, refractory and additive-manufacturing kilns to retire legacy optical pyrometers. Type T retains a thriving micro-niche at –200 °C LNG duties where accuracy trumps cost. Collectively, these moves reinforce the premium segments’ resilience against bulk price compression.

By Junction Type:
Ungrounded designs balance response and isolationGrounded junction models still dominate OEM catalogues because they achieve millisecond response times. Yet the push for electrical isolation in servo drives and variable-frequency motor systems moves procurement toward ungrounded versions that damp ground-loop noise by 90% while sacrificing only 20% response speed. Semiconductor fabricators specify these variants to shield sensitive measurement electronics from stray currents. Exposed junctions continue in lab glassware and non-pressurized pilot rigs but carry limited share due to fragility. As factories re-wire for predictive maintenance, control engineers balance electromagnetic compatibility against dynamic response, favouring hybrid designs such as partially insulated mini junctions.
Advances in laser-welded tip construction lift fatigue life, letting ungrounded MI probes survive high-vibration turbine stages. Vendors add miniature connectors and epoxy potting salts that improve seal integrity without hampering thermal lag. Some battery producers adopt clip-on skin sensors—essentially exposed junctions set in ceramic beads—to audit cell casing temperatures, pulling junction innovation into consumer-electronics territory. These cross-industry learnings keep the thermocouple temperature sensors market vibrant despite encroachment from silicon-based chips.
By Temperature Range:
High-temperature niches command premium positioningThe 350 °C–700 °C band represents the highest revenue slice, tied to continuous processes in petrochemical crackers, power boilers and rotary kilns. Customers prize stable mean time between calibrations, often extending probe life beyond 5 years via periodic in-situ checks. Segments above 700 °C—smaller in shipments yet lucrative—grow at 7.98% CAGR, driven by semiconductor oxidation furnaces, specialty-alloy casting and green-hydrogen SOEC stacks. At the cold extreme, Type T probes shoulder cryogenic tasks, ensuring product integrity during LNG loading where –162 °C surface oscillations tweak boil-off rates.
Competitively, NATO research cites optical sensors now tolerating 1800 °C, yet qualified Type S couples still rule at 1600 °C because of easier installation and field interchangeability. Cryogenic innovations include ultra-thin fluoropolymer jackets that slash thermal mass, letting LNG operators detect one-degree shifts within seconds. Accordingly, manufacturers leverage temperature-range specialization to buffer against price wars, anchoring brand loyalty in mission-critical process windows.
By Probe Configuration:
Mineral-insulated designs dominate industrial applicationsMineral-insulated cable assemblies own the lion’s share of industrial spend, valued for hermetic sealing, vibration endurance and continuous service to 1250 °C. OEMs in refineries and cement plants issue blanket orders for MI probes paired with Inconel thermowells, easing spares logistics and maintenance schedules. Thermowell-protected cartridges retain relevance where operators need probe swaps without cracking pressurized lines, while beaded-wire versions stay confined to bench testing or rapid-burn combustion R&D.
Designers now splice multi-point hot zones within a single sheath, giving engineers a gradient map instead of discrete data points. Suppliers such as TC Direct showcase miniature MI cables under 1 mm diameter, melding rapid response with industrial toughness. In parallel, sheath alloys evolve; Inconel 625 layers fight sulfidation in sour-gas streams, while Hastelloy C-276 covers acid leach circuits. The evolution underscores how mechanical packaging safeguards the high-precision core, sustaining MI designs as the dominant backbone of the thermocouple temperature sensors market.
By End-User Industry:
Chemicals & petrochemicals lead while automotive acceleratesAt 24.55% share, chemicals and petrochemicals rely on dense arrays of thermocouples in distillation, cracking and polymerization where runaway heat jeopardizes safety and yield. Hazardous-area certifications (ATEX, CSA) ensure probes integrate seamlessly with distributed control systems. Plant revamps often mandate simultaneous sensor upgrades, extending replacement cycles yet boosting order value through bundled diagnostics.
The automotive and EV battery sector grows fastest at 11.76% CAGR. Each gigafactory line may embed thousands of Type K inputs across drying ovens, formation chambers and thermal runaway barriers. With Europe racing to shore up battery sovereignty, regional makers commission smart probes tagged with EEPROM chips storing calibration data, simplifying line cloning and maintenance. Oil & gas, semiconductors, food & beverage and HVAC maintain steady volumes, yet digital transformation shifts revenue mix toward subscription services—remote calibration portals, cloud dashboards and analytics—that monetize sensor data beyond hardware.
Geography Analysis
APAC Thermocouple Temperature Sensors Market
Asia Pacific’s 41.70% command of the thermocouple temperature sensors market rests on its dense manufacturing base. China’s battery kilns and Japan’s chip fabs consume high-accuracy probes, while South Korea specifies platinum alloys for OLED glass melt zones. India’s petrochemical expansion adds orders for standard K and J variants yet increasingly demands local content, spurring joint ventures. Low-cost plants across the region manufacture commoditized probes that flow into global supply chains, creating price headwinds elsewhere.
Middle East Thermocouple Temperature Sensors Market
The Middle East posts the quickest regional climb at 9.40% CAGR through 2031. Saudi Aramco-approved facilities in Dammam now produce MI probes and thermowells domestically. Investment flows span petrochemical hubs, solar-thermal farms and desalination units, all requiring rugged sensors from cryogenic to 1000 °C zones. Local assembly shortens lead times and helps suppliers meet in-country value mandates, reshaping distribution networks in the thermocouple temperature sensors market.
The Americas, Europe and Africa Thermocouple Temperature Sensors Market
North America maintains substantial share via aerospace, LNG and advanced manufacturing. New liquefaction trains along the Gulf Coast order Type T strings for –162 °C service, whereas jet-engine OEMs qualify noble-metal probes for 1200 °C combustors. Europe’s uptake hinges on regulatory stimuli; EU Motor Regulation 2019/1781 obliges embedded thermocouple verification for efficiency labelling, and hydrogen pilot plants in Germany necessitate 900 °C measurement of SOEC stacks. South America and Africa remain nascent but show upticks tied to mining, pulp-and-paper and fertilizer plants seeking process upgrades.
Regulatory Landscape
Standards alignment continues to shape thermocouple design, qualification, and calibration practices across industrial automation and process industries. IEC 60584, covering thermocouple EMF specifications and extension or compensating cables, remains a core reference point for global OEM and end-user specifications. Hazardous-area use cases in chemicals, petrochemicals, and LNG typically call for Ex-rated designs, with Ex ia/ib and Ex db/eb variants specified at both the instrument and installation level.
In 2026, several updates add compliance and documentation work for sensor and control suppliers. IEC released a new edition of IEC 60730-2-9 in March 2026 for temperature sensing controls, adding functional safety assessment elements that affect controller-sensor combinations used in automated temperature loops. China implemented JB/T 8901-2025 in March 2026 for sheathed noble thermocouple cables, replacing JB/T 8901-1999. ASTM updated E2730-22(2026) in May 2026 for calibration and reference junction compensation evaluation, reinforcing traceability requirements for electronic compensation and verification workflows.
Value Chain Analysis
The value chain begins upstream with alloy and insulation inputs, notably nickel and chromium for common industrial thermocouples, and platinum-group metals for noble types. This is followed by wire drawing, junction formation (welding), mineral insulation packing and sheath formation for MI cable probes, assembly into probe configurations (thermowells, protection tubes, surface or penetration forms, and harnesses), and finally calibration and documentation to meet customer QA and regulatory expectations. Nickel and chromium supply volatility is a recurring constraint for MI-cable output, while drift management at very high temperatures requires tighter process control and more frequent calibration in certain semiconductor and furnace applications.
Downstream, sales move through direct OEM channels, system integrators supporting PLC/SCADA and plant retrofits, and broadline distributors for standardized Type K/J/T assemblies. Connectivity requirements are increasingly part of the delivered solution as plants upgrade thermocouples into networked nodes, including via EtherNet/IP device profiles from ODVA. This brings automation platforms and gateways into the chain alongside traditional probe and transmitter suppliers. Lead times and customization capability remain key differentiators, with standard probes often available through distributor inventory, while custom multi-point and application-engineered MI probes are typically built to order with added calibration, documentation, and on-site service components.
Competitive Landscape
Competition is moderately fragmented. Global brands—Omega Engineering (Spectris), Emerson, Endress+Hauser, ABB, Yokogawa, WIKA—blend sprawling portfolios with calibration labs and digital gateways. Mid-tier specialists such as Tempsens or Pyromation emphasize rapid customization, while Asian mass producers leverage scale for cost leadership. Consolidation among distributors continues; Thermal Technology Distribution Solutions completed five acquisitions since 2023, widening its U.S. footprint.
Technology differentiation pivots on materials and connectivity. Kamet Trading patented Type C and D assemblies for 2300 °C aerospace furnaces. ODVA’s EtherNet/IP profiles accelerate sensor-to-PLC interoperability, rewarding firms that embed digital descriptors into transmitters. While commoditized K and J probes see razor-thin margins, niche plays in high-temperature, cryogenic or EMI-heavy environments yield robust profitability. Fiber-optic challengers force thermocouple suppliers to package added value—auto-calibration, self-diagnostics, on-site swap programs—to defend strategic accounts in the thermocouple temperature sensors market.
Thermocouple Temperature Sensors Industry Leaders
-
Omega Engineering (Spectris plc)
-
Emerson Electric Co.
-
Endress+Hauser Group
-
Honeywell International Inc.
-
ABB Ltd
- *Disclaimer: Major Players sorted in no particular order
Thermocouple Temperature Sensors Market Companies Covered in this Report
- Omega Engineering (Spectris plc)
- Emerson Electric Co.
- Endress+Hauser Group
- Honeywell International Inc.
- ABB Ltd
- Yokogawa Electric Corp.
- WIKA Alexander Wiegand SE
- TE Connectivity Ltd.
- Watlow Electric Manufacturing Co.
- Fluke Corporation
- Siemens AG
- JUMO GmbH and Co. KG
- Tempsens Instruments
- Pyromation Inc.
- Durex Industries
- Thermo Fisher Scientific Inc.
- GHM Group (Greisinger)
- TC Ltd (UK)
- Thermo Electric Instrumentation
- Tip TEMP
Market Opportunities and Future Outlook
A clear whitespace is in retrofit-friendly measurement architectures that reduce installation cost and process risk while increasing temperature data density. ABBs June 2026 expansion of its NINVA non-invasive temperature measurement portfolio highlights a practical path for sites that avoid thermowells, hot work, and intrusive piping modifications, creating opportunities around clamp-on or surface-inferred temperature solutions paired with traditional thermocouples where direct contact is mandatory. At the same time, predictive maintenance programs are pushing users from single-point sensing to multi-point strings for thermal mapping, and manufacturers are commercializing these systems, including Duchin Sensors July 2026 launch of multi-point thermocouples with 2 to 40 junctions for layered gradient monitoring in chemical and petrochemical equipment.
Premiumization remains tied to harsh-duty and high-temperature stability needs, where commoditized Type K and J imports compete heavily on price. Demand signals include precious-metal thermocouple offerings for high-temperature environments, such as Duchin Sensors May 2026 launch of S-type PtRh10-Pt thermocouples rated up to 1600 C, and continued use of Type N and upgraded Type K in hydrogen and furnace zones above 800 C. Another near-term opportunity is wireless and low-maintenance sensing for hard-to-access assets, with Voiths May 2026 OnSens.SmarTemp announcement using energy harvesting for temperature sensing. That aligns with broader pull toward architectures that reduce battery replacement and wiring complexity alongside conventional thermocouple installations.
Recent Industry Developments in Thermocouple Temperature Sensors Market
- June 2026: ABB expanded its NINVA non-invasive process temperature measurement portfolio with Integrated, Remote, and Compact models. The additions support pipe surface-based temperature inference as an alternative to thermowells in selected services, lowering the barrier to add new temperature points during brownfield upgrades and maintenance turnarounds.
- November 2025: DwyerOmega acquired Consistec in Brazil to strengthen ruggedized and hazardous-location temperature sensing and control solutions. The deal broadened DwyerOmegas footprint in South America and added capabilities aligned with process-industry requirements where certified temperature assemblies are specified.
- November 2024: Omega Engineering opened a regional service and calibration center in North America to bolster installation support, traceable calibration, and rapid replacement of thermocouple assemblies for process industries. The center strengthens on-site service capability and reduces downtime for maintenance and upgrades in key facilities.
Thermocouple Temperature Sensors Market Report Scope and Research Methodology
Market Definition and Coverage
For this study, the market covers revenue earned from thermocouple temperature sensors sold as finished sensing products, including probes and assemblies used to measure temperature in industrial and commercial environments.
Scope exclusions: We exclude non-thermocouple temperature technologies (such as RTDs and thermistors), and we also exclude unrelated control hardware unless it is bundled as part of a thermocouple sensor assembly.
Segments Covered in This Report
- Thermocouple Type
- Type J
- Type T
- Type N
- Type E
- Type R and S
- Type B
- Others
- By Junction Type
- Grounded Junction
- Ungrounded Junction
- Exposed Junction
- By Temperature Range
- Below 0 C
- 0 C 350 C
- 350 C 700 C
- Above 700 C
- By Probe Configuration
- Beaded-Wire
- Mineral-Insulated (MI) Cable
- Thermowell and Protection Tube
- Surface and Penetration
- Flexible / Custom Harness
- By End-User Industry
- Oil and Gas
- Power Generation
- Chemicals and Petrochemicals
- Metals and Mining
- Food and Beverage
- Automotive and EV Battery
- Aerospace and Defense
- Semiconductor and Electronics
- Healthcare and Life Sciences
- HVAC and Building Automation
- By Geography
- North America
- United States
- Canada
- Mexico
- Rest of North America
- South America
- Brazil
- Argentina
- Rest of South America
- Europe
- Germany
- United Kingdom
- France
- Italy
- Spain
- Russia
- Rest of Europe
- Asia Pacific
- China
- Japan
- India
- South Korea
- Australia
- Rest of Asia Pacific
- Middle East
- Saudi Arabia
- United Arab Emirates
- Turkey
- Rest of Middle East
- Africa
- South Africa
- Egypt
- Nigeria
- Rest of Africa
- North America
Data Sources, Market Sizing, and Validation
Desk Research
Desk research starts by mapping where thermocouples are used and what drives buying cycles, then it is aligned to public data series that can be checked year after year. We usually refer to sources such as the US Bureau of Labor Statistics for industrial activity, the US Energy Information Administration for energy and refining indicators, and the International Energy Agency for power and process-heat direction.
To keep assumptions grounded, we also review reference standards and adoption signals from organizations such as NIST and IEC, plus trade and customs statistics where available for sensor and instrument categories. Company filings, investor presentations, and credible press coverage are used to understand product mixes and where pricing movement shows up. A paid subscription focused on company financials and news is used to cross-check revenue mentions and timing around product launches and supply changes. These desk research sources are illustrative only, and other public and paid references were also used to collect, validate, and clarify data points during the analysis.
Primary Interviews and Surveys
Fieldwork was used to test what the desk model could not fully explain, especially how thermocouple demand shifts by end-use, temperature range, and replacement cycles. We spoke with a mix of manufacturers, distributors, integrators, and large users across APAC, EMEA, and the Americas so that assumptions on volumes, price steps, and procurement patterns could be confirmed and adjusted before finalizing totals.
Distribution of primary research fieldwork respondents
| Company type | Respondent position | Region |
|---|---|---|
| Top tier: 31% | CXOs: 18% | APAC: 45% |
| Mid tier: 47% | Functional/Unit leaders: 35% | EMEA: 32% |
| Smaller Players: 22% | Managers: 47% | Americas: 23% |
Market-Sizing & Forecasting
Sizing is built using a top-down demand-pool approach where industrial output and capex signals are translated into expected sensor consumption, followed by adjustments for the thermocouple share in high-temperature and harsh-duty use cases. Once the macro pool is formed, we corroborate it with selective bottom-up checks, such as sampled average selling price (ASP) by probe type, channel markups, and a limited roll-up of supplier exposure by region so that totals stay consistent with what buyers and sellers report.
Inputs used in the model include indicators such as process-industry production and maintenance intensity, installed base growth in refineries and power plants, expansion of LNG and hydrogen projects, EV battery manufacturing additions, and observed ASP progression for common thermocouple types and junction configurations. Where supplier-side data is incomplete, gaps are handled by using proxy ratios from similar temperature sensor categories, and then re-testing those ratios with interview feedback. Forecasts are developed using scenario analysis anchored to capex pipelines and industrial output expectations, and then refined with expert consensus on lead times, replacement behavior, and price movement.
Data Validation & Update Cycle
Outputs are validated through triangulation across independent signals, including industrial production trends, project pipeline direction, and the implied ASP x volume relationship by region. If a market total creates an unusual jump, the input drivers are rechecked, and primary respondents are re-contacted when the variance cannot be explained by a known event.
Before sign-off, the model is reviewed in steps, first at the assumption level and then at the market total and regional split level. Reports are refreshed annually, and interim updates are made when material events occur that can change demand or pricing. Before delivery, a final freshness pass is completed so the view reflects the latest available public data and interview learnings.
Mordor Intelligence's Global Thermocouple Temperature Sensors Market Market Size Compared With Other Published Estimates
Published market sizes for thermocouple temperature sensors can differ by a lot, even when the titles look similar, because the boundaries and counting rules are not the same. The biggest differences usually come from what is treated as a thermocouple sensor sale, which years are used as the base, and how pricing is converted and updated across regions.
In this market, gaps commonly appear when estimates fold in broader temperature sensing hardware, count full instrumentation systems instead of only sensor assemblies, or mix unit-shipment logic with revenue logic without reconciling ASPs. By tracking replacement-cycle intensity and end-use capex signals, Mordor Intelligence keeps the 2026 total tied to thermocouple-only sensor revenue and then rechecks currency timing and ASP steps before locking the model.
Benchmark comparison
| Source | Market Size | Gaps in Research Methodology |
|---|---|---|
| Mordor Intelligence | USD 7.46 B (2026) | |
| Global Research Publisher A | USD 3.40 B (2025) | This estimate appears to use a narrower revenue pool and a different base year, and it may treat several probe and assembly revenues as part of broader instrumentation categories rather than thermocouple-only sensors. |
| Technology Research Firm B | USD 0.89 B (2023) | This number is presented as a growth-based view tied to a 2023 base and a short forecast window, which can understate the full global spend when replacement demand and high-temperature industrial use cases are not fully captured in the starting year. |
The spread in the table is mainly explained by scope boundaries, base-year choices, and how revenue is attributed between sensors and adjacent measurement hardware. Our approach stays repeatable because it is built from observable demand signals, tested with channel and ASP checks, and then validated through direct industry feedback before forecasting forward.
Key Questions Answered in the Report
What is the current value of the thermocouple temperature sensors market?
The market is worth USD 7.46 billion in 2026 and is projected to reach USD 10.77 billion by 2031 at a 7.62% CAGR.
Which thermocouple type dominates sales today?
Type K leads with 34.60% market share thanks to its wide temperature span and cost advantage.
Which region is growing fastest?
The Middle East shows the highest growth, with a 9.40% CAGR forecast for 2026-2031, driven by petrochemical and renewable-energy investments.
How are Industry 4.0 trends affecting sensor demand?
Predictive-maintenance programs are driving multi-point retrofits that transform thermocouples from simple probes into networked data sources.
Why are fiber-optic sensors considering a threat?
Fiber optics offer EMI immunity and ±0.1 °C accuracy in aerospace turbines, challenging thermocouples in high-value, high-interference zones.
Which end-user segment is expanding fastest?
Automotive and EV battery manufacturing is advancing at a 11.76% CAGR as gigafactories require precise kiln and formation temperature control.