
Therapeutic Vaccines Market Size and Share
Market Overview
| Study Period | 2020 - 2031 |
|---|---|
| Market Size (2026) | USD 34.25 Billion |
| Market Size (2031) | USD 61.77 Billion |
| Growth Rate (2026 - 2031) | 12.52 % |
| Fastest Growing Market | Asia-Pacific |
| Largest Market | North America |
| Market Concentration | Medium |
Major Players *Disclaimer: Major Players sorted in no particular order Image © Mordor Intelligence. Reuse requires attribution under CC BY 4.0. | |
Therapeutic Vaccines Market Analysis by Mordor Intelligence
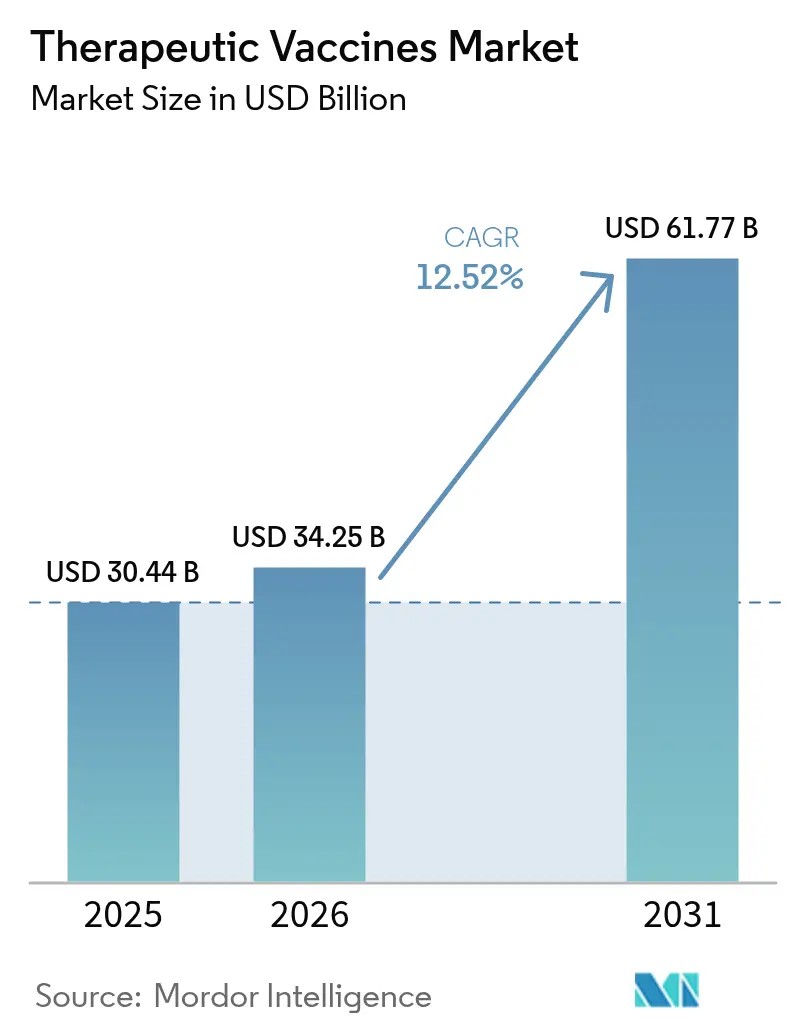
The therapeutic vaccines market size is projected to expand from USD 30.44 billion in 2025 and USD 34.25 billion in 2026 to USD 61.77 billion by 2031, registering a CAGR of 12.52% between 2026 and 2031. Solid demand pivots from prophylactic immunization to active immunotherapy as stakeholders pursue treatments that mobilize a patient’s own defenses against established disease. Cancer programs captured the largest revenue, yet neurological disease pipelines are accelerating on the back of Phase II read-outs in Alzheimer’s and Parkinson’s cohorts. Tightened regulatory scrutiny surfaced in February 2026 when FDA issued a complete response letter for Moderna’s seasonal influenza mRNA vaccine, a decision that underscores higher evidentiary standards for all therapeutic vaccine modalities.
Key Report Takeaways
- By product category, cancer vaccines led with 42.55% therapeutic vaccines market share in 2025. Neurological disease vaccines are forecast to advance at a 15.85% CAGR through 2031.
- By technology, allogeneic constructs held 55.53% therapeutic vaccines market size in 2025, while autologous platforms are projected to post a 16.75% CAGR to 2031.
- By age group, geriatric applications are expected to rise at a 13.82% CAGR between 2026 and 2031, outpacing the adult cohort.
- By distribution channel, private outlets are advancing at a 13.12% CAGR through 2031 despite public systems retaining 64.52% of 2025 sales.
- By geography, Asia-Pacific is set to record the fastest 13.72% CAGR through 2031, although North America commanded 42.55% revenue in 2025.
Note: Market size and forecast figures in this report are generated using Mordor Intelligence’s proprietary estimation framework, updated with the latest available data and insights as of 2026.
Market Trends and Insights
Drivers Impact Analysis of Therapeutic Vaccines Market*
| Driver | (~) % Impact on CAGR Forecast | Geographic Relevance | Impact Timeline |
|---|---|---|---|
| Rising Prevalence of Chronic & Infectious Diseases | +2.8% | Global with acute burden in Asia-Pacific and Sub-Saharan Africa | Long term (≥ 4 years) |
| Government Funding Intensification for Vaccine R&D | +1.9% | North America, Europe, China | Medium term (2-4 years) |
| Pharma/Biotech Surge in Oncology Vaccine Pipelines | +3.2% | North America, Europe, Asia-Pacific | Long term (≥ 4 years) |
| Breakthrough Approvals of mRNA-Based Therapeutic Vaccines | +2.4% | North America, Europe | Short term (≤ 2 years) |
| AI-Driven Neoantigen Discovery Accelerating Personalization | +1.6% | North America, Europe, China | Medium term (2-4 years) |
| On-Site Modular Micro-Factory Manufacturing Models | +1.1% | North America, Europe | Long term (≥ 4 years) |
| Source: Mordor Intelligence | |||
Rising Prevalence of Chronic & Infectious Diseases
Therapeutic vaccines have moved to the center of multimodal care as chronic conditions coexist with infectious outbreaks. WHO’s 2024 Global Health Estimates found non-communicable diseases responsible for 74% of worldwide deaths, a statistic that amplifies oncology and cardiometabolic vaccine demand. Concurrently, global cancer incidence is projected to top 30 million new cases annually by 2030, intensifying the hunt for individualized neoantigen vaccines that target patient-specific mutations[1]. Infectious-disease candidates now pursue functional cures in HIV and shortened regimens in tuberculosis, broadening the therapeutic vaccines market beyond oncology.
Government Funding Intensification for Vaccine R&D
Project NextGen allocated USD 5 billion in 2024 to advance next-generation COVID-19 countermeasures and spin-off technologies, yet BARDA’s August 2025 cancellation of USD 500 million in mRNA contracts indicates that future disbursements will hinge on multipurpose clinical value. In China, expedited pathways for domestic cancer vaccines have unlocked fresh capital, while Horizon Europe grants continue to support mRNA and viral-vector platforms. These region-specific policies collectively expand the therapeutic vaccines market, though sponsors must still deliver compelling cost-effectiveness dossiers to secure reimbursement.
Pharma/Biotech Surge in Oncology Vaccine Pipelines
Global pipelines grew by 40% between 2023 and 2025 as checkpoint inhibitor revenues plateaued. High-profile data such as Moderna and Merck’s KEYNOTE-942 study, which showed a 44% recurrence-risk reduction with mRNA-4157 plus pembrolizumab, validate a combination-driven strategy and reinforce the centrality of therapeutic vaccines market participants in oncology care.
Breakthrough Approvals of mRNA-Based Therapeutic Vaccines
EMA’s February 2025 clearance of Kostaive, a self-amplifying RNA product, signaled European openness to next-gen formulations[2]. Yet FDA’s 2026 rejection of a seasonal flu mRNA candidate reminds sponsors that therapeutic vaccines market authorization rests on nuanced risk-benefit calculus.
Restraints Impact Analysis of Therapeutic Vaccines Market*
| Restraint | (~) % Impact on CAGR Forecast | Geographic Relevance | Impact Timeline |
|---|---|---|---|
| Capital-Intensive, High-Risk Clinical Development Cycle | -2.1% | Global, acute in emerging markets | Long term (≥ 4 years) |
| Stringent Multi-Jurisdictional Regulatory Hurdles | -1.4% | North America, Europe, Japan | Medium term (2-4 years) |
| Shortage of GMP Viral-Vector/Plasmid Capacity | -1.8% | Global bottleneck in North America and Europe | Short term (≤ 2 years) |
| Late-Stage I-O Trial Failures Dampening Investor Sentiment | -1.3% | Global with focus on North America | Medium term (2-4 years) |
| Source: Mordor Intelligence | |||
Capital-Intensive, High-Risk Clinical Development Cycle
End-to-end expenses reach USD 200-500 million per candidate, while success odds linger below 10%. Personalized neoantigen trials add USD 150,000 per patient in sequencing and bespoke GMP costs. Emerging-market innovators often license out assets to deep-pocketed partners, a dynamic that curtails independent commercialization and tempers growth in the therapeutic vaccines market.
Stringent Multi-Jurisdictional Regulatory Hurdles
Divergent agency views widen launch timelines. FDA’s refusal of Moderna’s flu mRNA product contrasted with EMA’s friendlier stance toward similar technologies, highlighting costly duplications in clinical evidence requirements. Separate HTA reviews across Europe further delay uptake.
*Our forecasts treat driver/restraint impacts as directional, not additive. The impact forecasts reflect baseline growth, mix effects, and variable interactions.
Therapeutic Vaccines Market Segment Analysis
By Products:
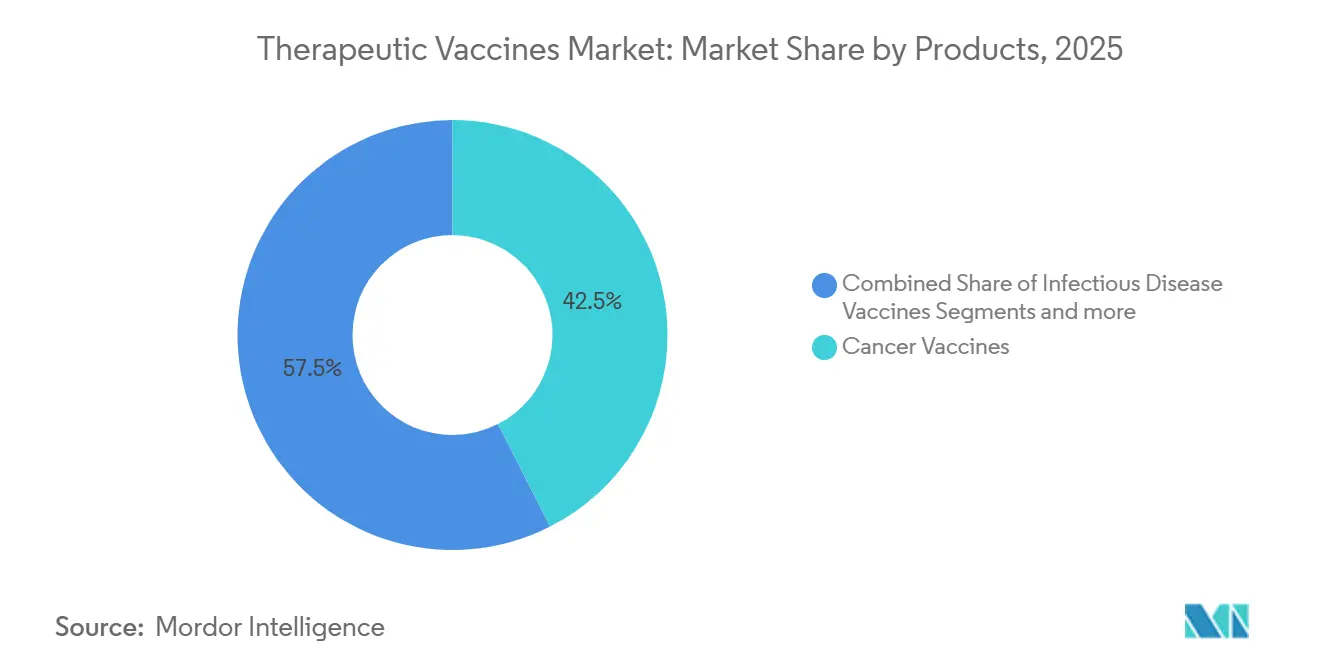
Oncology Dominates, Neurology SurgesCancer vaccines held 42.55% therapeutic vaccines market share in 2025, buoyed by combination regimens that prolong progression-free survival. Neurological disease vaccines are projected to clock a 15.85% CAGR to 2031, supported by mid-stage trials of ACI-24.060 and UB-612 that target Alzheimer’s pathology.
Autoimmune and advanced infectious-disease candidates add diversification but remain earlier in development, constrained by the need to demonstrate antigen-specific tolerance without compromising systemic immunity. Regulatory requirements differ by indication. Oncology programs often leverage surrogate endpoints such as recurrence-free survival, whereas neurological applications must showcase multi-year cognitive maintenance, a higher evidentiary bar that slows approval yet could deliver large-scale value once met.

By Technology:
Allogeneic Scale Versus Autologous PrecisionAllogeneic formulations generated 55.53% of 2025 revenue thanks to batch economies and rapid distribution. Autologous constructs are set to expand at a 16.75% CAGR through 2031 as AI accelerates neoantigen discovery, shrinking manufacturing cycles to 30-60 days and widening clinical eligibility.
Efficacy divides the two modalities. Allogeneic programs rarely exceed 30% objective response rates, whereas autologous vaccines cross 40% in melanoma and non-small cell lung cancer, a gap that justifies higher production costs among payers keen on durable outcomes.
By Age Group:
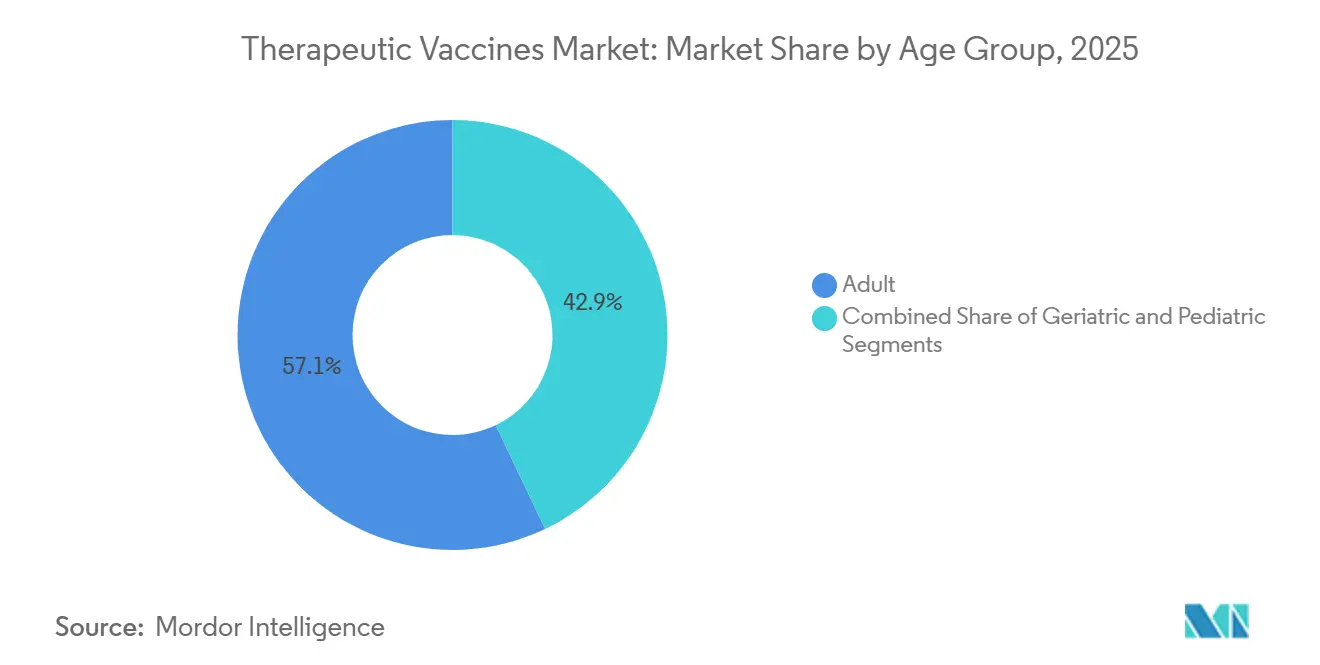
Adult Dominance, Geriatric AccelerationAdults represented 57.15% of consumption in 2025, but geriatric cohorts are forecast to grow at 13.82% CAGR as adjuvant advances counter immunosenescence. Added demand for senior-focused dosing regimens and safety monitoring drives innovation across the therapeutic vaccines market.
By Distribution Channel:
Public Infrastructure, Private VelocityGovernment channels delivered 64.52% of 2025 revenue, yet private settings are advancing at a 13.12% CAGR amid high-net-worth demand for custom oncology regimens. Medicare’s narrow coverage has nudged some U.S. patients toward self-pay models, a pattern mirrored by European price-effectiveness thresholds.
Geography Analysis
North America, Europe and APAC Therapeutic Vaccines Market
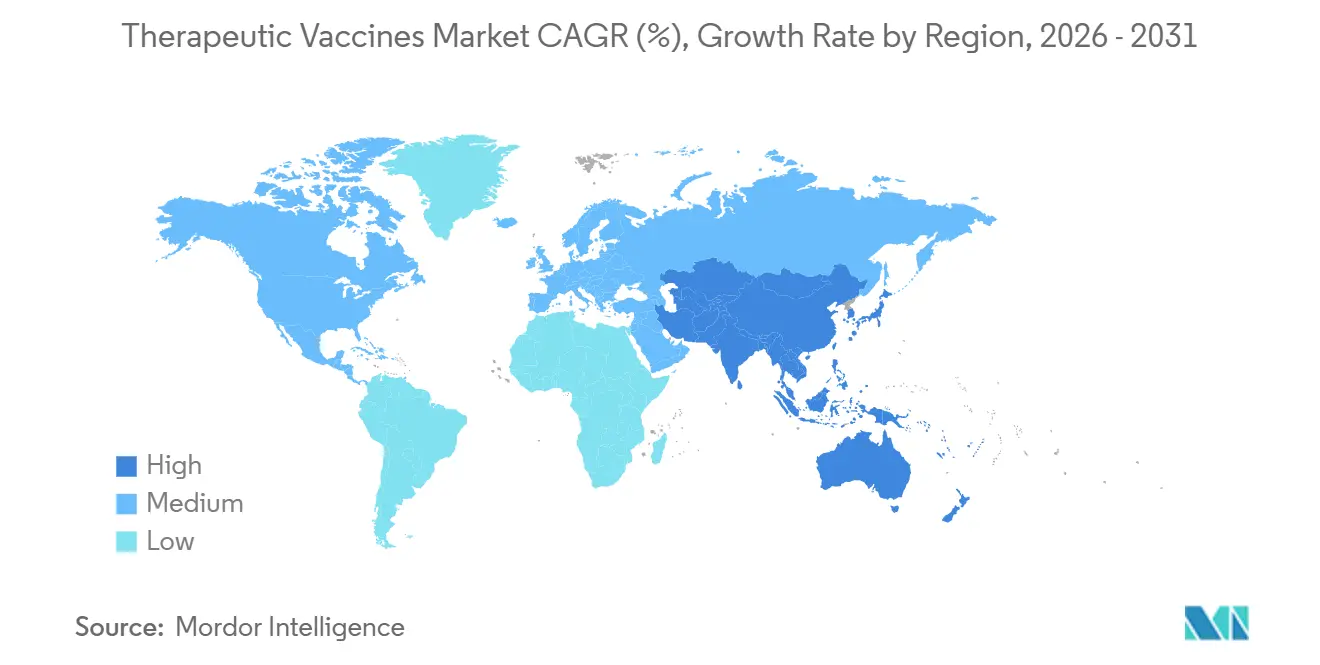
North America led with 42.55% share in 2025, propelled by FDA fast-track designations and concentrated venture backing. Europe follows, leveraging centralized EMA approvals but facing post-authorization pricing delays. Asia-Pacific is the fastest growing therapeutic vaccines market, advancing 13.72% CAGR through 2031 as China streamlines approvals and India attracts lower-cost pivotal trials[3]. Japan’s local safety data requirements add 18-24 months to launch cycles but ensure age-tailored protocols for its sizable elderly population.
LATAM and MEA Therapeutic Vaccines Market
Latin America, the Middle East, and Africa collectively remain small contributors but display rising interest as expedited reliance pathways let regulators lean on FDA or EMA decisions while domestic sponsors pursue technology transfers.
Regulatory Landscape
Therapeutic vaccines are regulated primarily as biologics, with requirements covering clinical evidence, potency assays, and GMP controls that vary by platform and geography. In the United States, FDA guidance for therapeutic cancer vaccines and adjacent CBER frameworks used for cellular and gene therapy products set expectations for individualized and vector-based approaches, reinforcing the higher evidentiary threshold highlighted by FDA action noted in February 2026 in the broader mRNA vaccine space.
In Europe, the EMA has been updating regulatory tools that affect platform iteration and lifecycle management. The revised variations framework (effective January 2025) supports structured post-authorization changes, while the CHMP-adopted draft guideline on quality aspects of mRNA vaccines (March 2025) indicates tighter, more explicit manufacturing and control expectations for RNA technologies. Seasonal update mechanisms also remain in place through EMA working party recommendations, including the May 2026 2026/2027 seasonal influenza vaccine composition recommendations and the June 2026 update recommendations for antigenic composition of authorized COVID-19 vaccines, which reflect how EU processes balance iteration speed with ongoing quality oversight.
Competitive Landscape
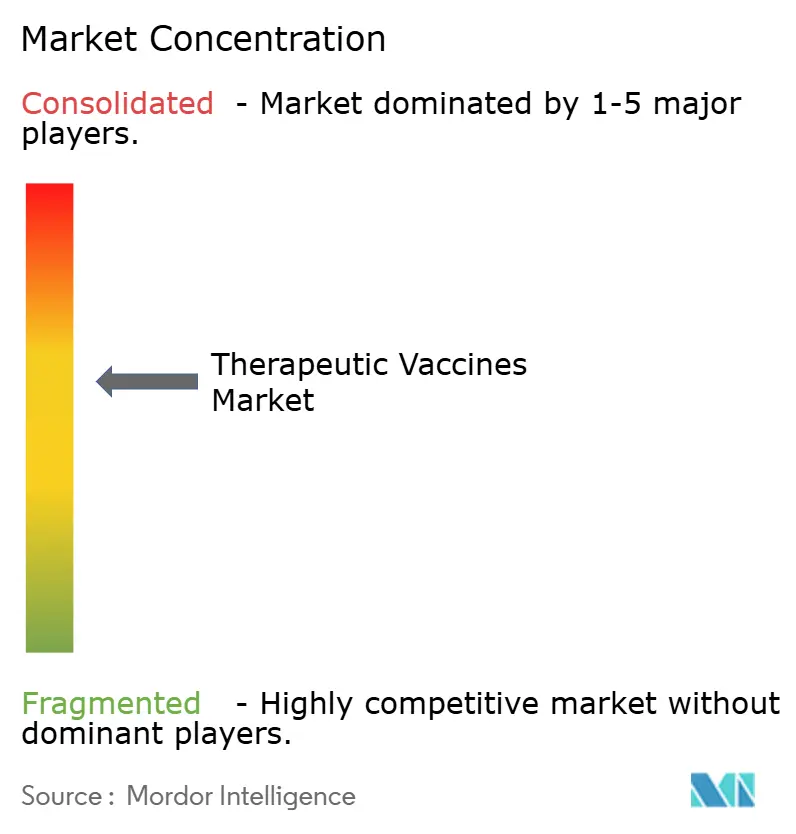
Competition remains moderate. BioNTech and Moderna exploit pandemic-era mRNA scale to dominate individualized pipelines, yet smaller biotechs fill gaps in viral-vector and DNA constructs. Platform alliances abound—BioNTech has inked deals with Regeneron, OncoC4, DualityBio, and Genmab to integrate BNT122 into antibody combinations. AI-native entrants such as Gritstone and NEC capture mindshare by collapsing neoantigen design timelines from months to weeks. Technology, not sheer volume, now defines edge: autologous leaders race to 30-day manufacturing windows, while allogeneic suppliers widen epitope breadth to improve response rates.
Therapeutic Vaccines Industry Leaders
-
Merck & Co., Inc.
-
GSK plc
-
Pfizer Inc.
-
Sanofi SA
-
Moderna Inc.
- *Disclaimer: Major Players sorted in no particular order
Therapeutic Vaccines Market Companies Covered in this Report
- Agenus
- AstraZeneca
- Bavarian Nordic
- BioNTech
- Celldex Therapeutic
- CSL Seqirus
- CureVac N.V.
- Gilead Sciences
- GlaxoSmithKline
- Inovio Pharmaceuticals
- Merck
- Moderna
- Novartis
- Nykode Therapeutics
- Pfizer
- Sanofi
- Takeda Pharmaceutical Co.
- Vaccitech plc
Market Opportunities and Future Outlook
A visible whitespace sits at the intersection of personalization and scalable execution. Autologous neoantigen programs aim to shorten design-to-dose cycles (30-60 days in the current market framing), while payers and providers focus on reproducible QC and potency assays across sites. This creates room for AI-enabled neoantigen selection partnerships and platform standardization, consistent with alliance-heavy competitive behavior among leaders, including BioNTech integrating BNT122 into multiple antibody combinations. It also aligns with formal roadmapping activity in Europe (EFPIA/IPROVE) that highlights manufacturing quality control and regulatory alignment as bottlenecks.
Clinical and infrastructure signals also broaden the opportunity set beyond a single indication or region. Multiple 2026 peer-reviewed clinical readouts in oncology and neurology, including individualized mRNA vaccine immune durability data in TNBC umbrella-study settings and published phase I datasets for KRAS-targeted vaccine strategies with checkpoint blockade, keep combination regimens and biomarker-defined populations central to development priorities, along with final analysis of an IDH1-mutant vaccine trial in astrocytoma. On the supply side, geographic diversification in vaccine manufacturing capacity building is becoming more concrete, with the 2026 Clinton Health Access Initiative assessment describing multiple African manufacturers with facilities and active technology transfers underway toward the Partnerships for African Vaccine Manufacturing goal of 60% local manufacturing by 2040. That trajectory supports longer-term optionality for fill-finish, QC services, and regional trial supply for therapeutic modalities that can use similar manufacturing capabilities.
Recent Industry Developments in Therapeutic Vaccines Market
- July 2026: Boehringer Ingelheim licensed oncology rights to Prime Vector Technologies' Orf virus platform to develop cancer vaccines, including potential off-the-shelf therapeutic candidates. The deal expands access to viral delivery approaches that can complement mRNA and peptide platforms and supports faster exploration of shared tumor antigens alongside individualized options.
- April 2026: Transgene signed a license agreement with NEC Bio B.V. to access an AI-based neoantigen prediction platform to advance clinical development of TG4050, an individualized neoantigen therapeutic vaccine for head and neck cancer. Incorporating AI into antigen selection targets shorter design timelines and supports differentiation in a market where autologous programs compete on speed, reproducibility, and response depth.
- September 2024: GSK discontinued development of its therapeutic herpes vaccine candidate GSK3943104 after it failed to meet the primary efficacy endpoint in a Phase 2 trial. The discontinuation underscores late-stage clinical risk in therapeutic vaccines and can redirect capital and partnering priorities toward oncology and other indications with clearer combination-treatment pathways.
Therapeutic Vaccines Market Report Scope and Research Methodology
Market Definition and Coverage
This market covers revenues from therapeutic vaccines that are used to treat an existing disease by stimulating or re-training the immune system, and it is sized at a global level across major regions and key countries.
Scope exclusions: We exclude purely prophylactic vaccines and general immunostimulant drugs that are not administered and priced as therapeutic vaccines.
Segments Covered in This Report
- By Products
- Autoimmune Disease Vaccines
- Neurological Disease Vaccines
- Cancer Vaccines
- Infectious Disease Vaccines
- Other Products
- By Technology
- Allogeneic Vaccines
- Autologous Vaccines
- By Age Group
- Adult
- Pediatric
- Geriatric
- By Distribution Channel
- Public
- Private
- By Geography
- North America
- United States
- Canada
- Mexico
- Europe
- Germany
- United Kingdom
- France
- Italy
- Spain
- Rest of Europe
- Asia-Pacific
- China
- India
- Japan
- Australia
- South Korea
- Rest of Asia-Pacific
- Middle East and Africa
- GCC
- South Africa
- Rest of Middle East and Africa
- South America
- Brazil
- Argentina
- Rest of South America
- North America
Data Sources, Market Sizing, and Validation
Desk Research
Desk research was used to set the factual base for the model, so assumptions were not built on opinions alone. We reviewed public sources such as the World Health Organization, the US FDA and other key regulators, the US National Institutes of Health clinical trial registry, the World Bank, and OECD health statistics to understand disease burden, approvals, and therapy adoption signals.
Along with this, we checked company annual reports, earnings decks, and official press releases to track commercialization timelines, label expansions, and geographic rollouts. For extra confirmation on company revenue direction and event tracking, a paid subscription covering company financial intelligence and a separate paid subscription covering patents were referenced where needed. The sources listed here are illustrative, and many other public and paid references were also used for data collection, cross-checks, and clarification during the study.
Primary Interviews and Surveys
Primary discussions were run with a mix of manufacturers, distributors, clinicians, and procurement focused stakeholders so we could validate what is actually used, what is reimbursed, and what is delayed in practice. Since this is a global market, we intentionally spread outreach across APAC, EMEA, and the Americas to pressure-test adoption differences, pricing direction, and near-term pipeline conversion assumptions.
Distribution of primary research fieldwork respondents
| Company type | Respondent position | Region |
|---|---|---|
| Top tier: 29% | CXOs: 18% | APAC: 45% |
| Mid tier: 53% | Functional/Unit leaders: 28% | EMEA: 29% |
| Smaller Players: 18% | Managers: 54% | Americas: 26% |
Market-Sizing & Forecasting
Sizing starts with a top-down build where disease prevalence and treated patient pools are mapped by major indications, and then converted into value using adoption rates and typical annual therapy cost ranges by region. To keep the logic grounded, we cross-check totals using selective bottom-up approximations, such as sampling key launched products, applying realistic price bands, and scaling by expected patient reach and channel mix.
A few inputs that materially shape the model include trial pipeline momentum by indication, approval and label expansion cadence, pricing and reimbursement direction, site-of-care and distribution split (public versus private), and regional diagnosis and treatment rates. Where bottom-up visibility is weak, gaps are handled by using proxy adoption curves from comparable immunotherapy launches and then adjusting them after expert feedback.
For forecasting, scenario analysis is used so that optimistic and conservative outcomes can be tied to tangible levers like clinical success rates, regulatory timing, and market access speed. The final growth path is then aligned to what primary respondents view as realistic over the next few years, rather than relying on a single smooth curve.
Data Validation & Update Cycle
Validation is done through multiple checks so the outputs are consistent with independent market signals. We compare results against epidemiology trends, clinical pipeline counts, approval timelines, and observed pricing ranges, and then re-check any large jumps that do not match known launch or reimbursement events.
Before sign-off, the model and assumptions go through an internal analyst review, followed by a final variance scan across regions and key indications. The report is refreshed annually, and interim updates are triggered when a material approval, safety signal, pricing change, or major trial outcome can shift the near-term market. Right before delivery, a fresh review pass is completed so clients receive the latest updated view.
Mordor Intelligence's Global Therapeutic Vaccines Market Market Size Measured Against Other Published Estimates
It is normal to see different market values published for therapeutic vaccines, even when the headline topic looks identical. Differences usually come from what is counted as a therapeutic vaccine, which years are used, how pricing is treated, and how quickly pipeline programs are assumed to convert into sales.
In this market, the biggest gap drivers tend to be whether estimates include adjacent immunotherapies that are not administered as vaccines, whether they assume faster uptake across all regions at once, and whether currency timing and regional pricing are kept consistent. Another practical reason is refresh cadence, because a recent approval delay or trial failure can quickly change the near-term ramp and it is not always reflected in older figures.
Benchmark comparison
| Source | Market Size | Gaps in Research Methodology |
|---|---|---|
| Mordor Intelligence | USD 30.44 B (2025) | |
| Industry Publisher A | USD 37.40 B (2025) | This figure appears to use a wider inclusion set by counting more technology types and channels, and it can also reflect higher blended pricing assumptions across regions, which lifts the 2025 total. |
| Market Tracker B | USD 17.10 B (2025) | This estimate is likely narrower in what it counts as therapeutic vaccines, with more conservative uptake and access assumptions that reduce near-term revenues, especially outside the largest reimbursed markets. |
The spread across the three numbers is mainly explained by scope breadth, how fast demand is assumed to materialize, and whether pricing is blended consistently across regions. By keeping the count tied to therapeutic vaccine revenues only and pressure-testing uptake and pricing with region-level checks, the 2025 value is held closer to a repeatable demand pool, a modeling choice applied by Mordor Intelligence.
Key Questions Answered in the Report
How large is the therapeutic vaccines market expected to become by 2031?
It is projected to reach USD 61.77 billion by 2031, growing at a 12.52% CAGR from 2026.
Which therapeutic vaccine product category currently leads sales?
Cancer vaccines led with 42.55% share in 2025 and remain the main revenue driver through the forecast period.
What is driving rapid growth in Asia-Pacific?
Streamlined Chinese approvals and India's lower clinical trial costs help the region post a 13.72% CAGR through 2031.
Why are autologous vaccines gaining traction despite higher costs?
AI-enabled neoantigen discovery has cut manufacturing lead-times to 30-60 days, while response rates often exceed 40% in solid tumors.
How did FDA's 2026 decision affect market sentiment?
The refusal of a seasonal flu mRNA vaccine underscored stricter efficacy expectations, prompting sponsors to refine evidence packages.
What role do private distribution channels play?
Private clinics and concierge oncology centers are expanding at a 13.12% CAGR as high-net-worth patients self-fund personalized regimens.