Textile Market Size and Share
Market Overview
| Study Period | 2020 - 2031 |
|---|---|
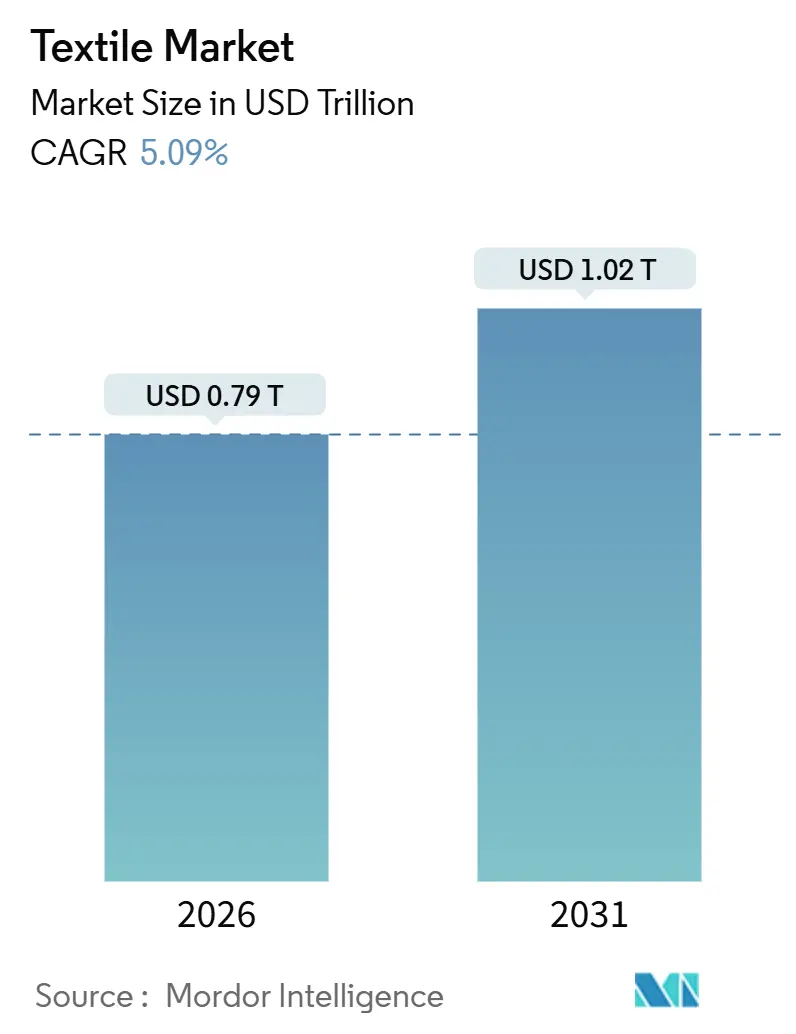
| Market Size (2026) | USD 0.79 Trillion |
| Market Size (2031) | USD 1.02 Trillion |
| Growth Rate (2026 - 2031) | 5.09% CAGR |
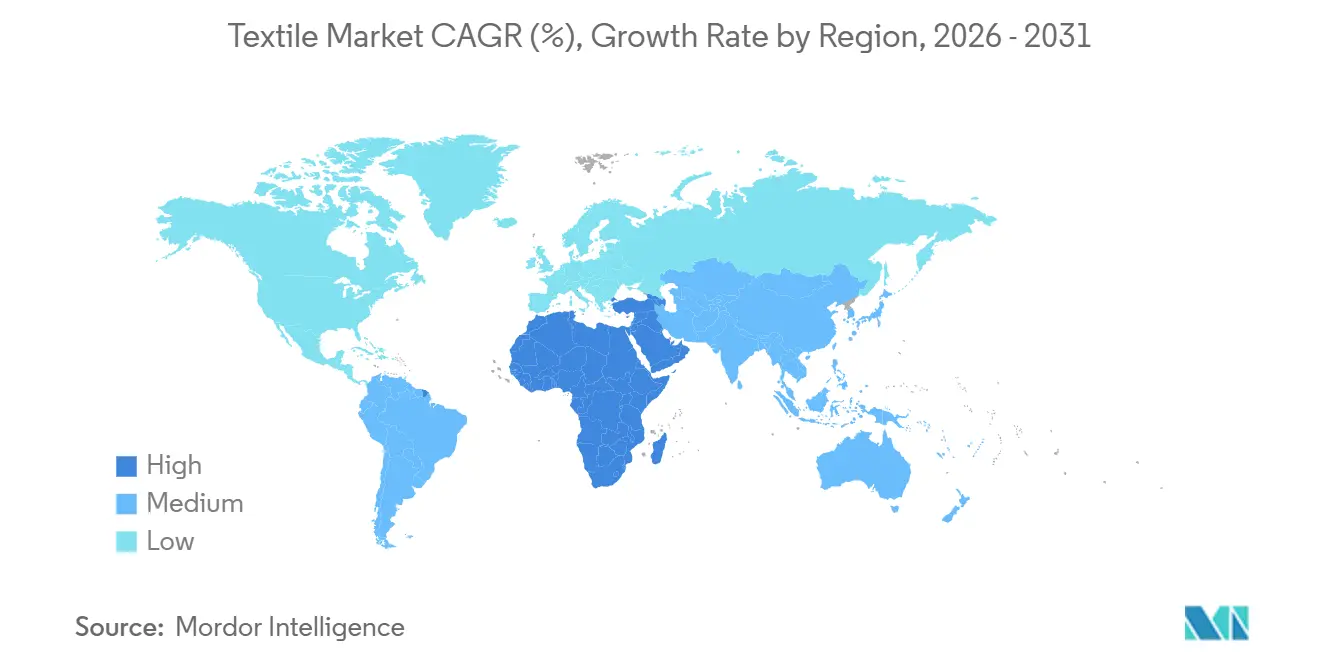
| Fastest Growing Market | Middle East and Africa |
| Largest Market | Asia Pacific |
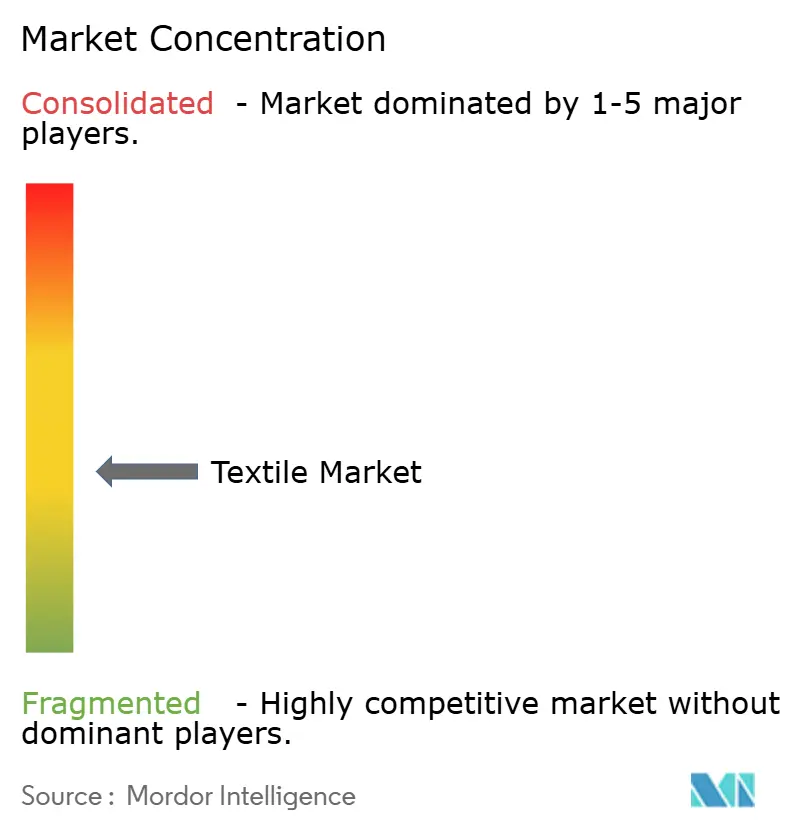
| Market Concentration | Medium |
Major Players *Disclaimer: Major Players sorted in no particular order Image © Mordor Intelligence. Reuse requires attribution under CC BY 4.0. | |
Textile Market Analysis by Mordor Intelligence
The Textile Market size is estimated at USD 0.79 trillion in 2025, and is expected to reach USD 1.02 trillion by 2031, at a CAGR of 5.09% during the forecast period (2025-2031). Capacity additions in recycled polyester, rising traceability mandates, and geopolitical realignments are reshaping sourcing, investment, and profit pools across the textile industry market. Fashion-centric demand still dominates volume, yet industrial performance requirements, from automotive lightweighting to hospital infection control, are lifting margins and drawing capital. Brands are reallocating 2% - 4% of landed costs toward compliance technologies that de-risk market access, while freight volatility and energy-price swings accelerate near-shoring pilots and on-site renewable-power projects. Consolidation is quickening in specialty fibers and advanced non-wovens, even as commodity spinning and weaving remain highly fragmented, leaving ample room for scale players to lock in feedstock and for agile newcomers to commercialize bio-based alternatives that reduce lifecycle carbon intensity.
Key Report Takeaways
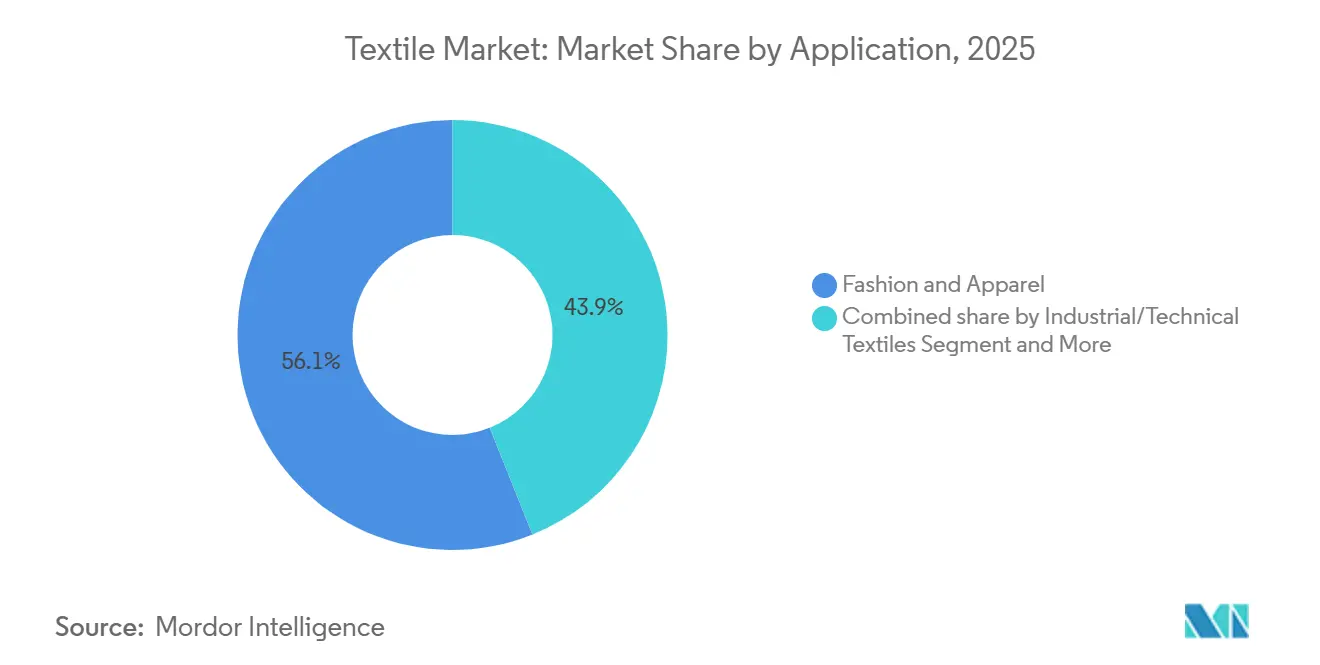
- By application, Fashion & Apparel held 56.06% of the textile industry market share in 2025; Industrial/Technical Textiles are projected to expand at a 6.15% CAGR through 2031.
- By raw material, synthetic fibers accounted for 53.96% of the textile industry market size in 2025, with recycled-content polyester forecast to rise at a 6.56% CAGR to 2031.
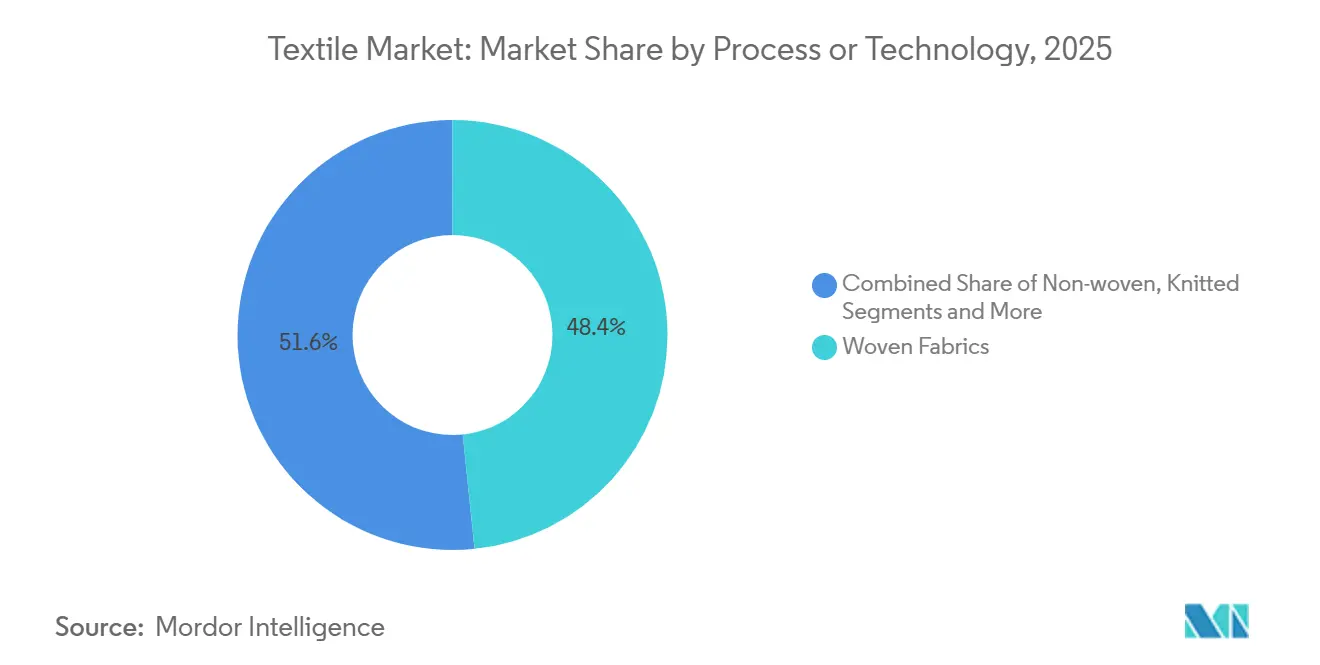
- By process, woven fabrics captured 48.36% share of the textile industry market size in 2025, while non-wovens are advancing at a 6.05% CAGR to 2031.
- By geography, Asia-Pacific controlled 54.06% of global output in 2025; the Middle East & Africa region is the fastest-growing area at a 5.80% CAGR through 2031.
- Reliance Industries, Toray Industries, and Far Eastern New Century together operated 9% of global polyester capacity in 2025, the largest consolidated block in a still-fragmented value chain.
Note: Market size and forecast figures in this report are generated using Mordor Intelligence’s proprietary estimation framework, updated with the latest available data and insights as of January 2026.
Global Textile Market Trends and Insights
Drivers Impact Analysis
| Drivers | ( ~ ) % Impact on CAGR Forecast | Geographic Relevance | Impact Timeline |
|---|---|---|---|
| EU Digital Product Passport accelerating traceability technology investments | +0.6% | Europe, spillover to Asia-Pacific export hubs | Medium term (2-4 years) |
| Uyghur Forced Labor Prevention Act shifting sourcing toward certified non-Xinjiang cotton | +0.5% | North America import flows, South/Southeast Asia production | Short term (≤ 2 years) |
| AI-driven on-demand manufacturing reducing inventory waste | +0.5% | North America, Europe, urban Asia-Pacific | Short term (≤ 2 years) |
| Carbon-credit monetization programs boosting recycled-fiber profitability | +0.4% | EU and California compliance markets, global roll-out | Medium term (2-4 years) |
| Protective & antiviral textiles demand for pathogen-resilient indoor environments | +0.4% | Healthcare-dense regions worldwide | Medium term (2-4 years) |
| Bio-based PEF polyester scaling from European pilot to commercial plants | +0.3% | Europe with early North American adoption | Long term (≥ 4 years) |
| Source: Mordor Intelligence | |||
EU Digital Product Passport Accelerating Traceability Technology Investments
The EU Digital Product Passport requires every textile sold in the bloc to carry machine-readable data on origin, composition, and end-of-life pathways by 2027, spurring USD 1.45 billion in combined software and hardware spend among European mills. Bangladeshi and Vietnamese exporters are mirroring the upgrades to keep EU access, effectively globalizing the standard. Interoperability gaps between enterprise software vendors raise switching costs for small mills and could trigger consolidation among sub-scale operators. Verified composition data also unlocks secondary-raw-material marketplaces, bolstering recycling economics. As pilot projects mature, brands anticipate 20% faster supplier-auditing cycles, freeing working capital for design and marketing.[1]European Commission, “Ecodesign for Sustainable Products Regulation—Digital Product Passport,” ec.europa.eu
Uyghur Forced Labor Prevention Act Shifting Sourcing Toward Certified Non-Xinjiang Cotton
Aggressive enforcement of the UFLPA led to a 20% drop in U.S. cotton-apparel imports from China between 2022 and 2025, diverting orders to India and Vietnam. Stable-isotope testing has scaled quickly, with laboratories processing more than 10,000 samples in 2024, underpinning credible provenance claims. Indian spinners handled a 35% hike in U.S. orders during 2024, demonstrating how compliance mandates reshape global flows. Retailers now budget 2% - 4% of landed cost for documentation, a margin drag that accelerates digital-traceability adoption. The re-routing of contracts stabilizes rural incomes in alternative sourcing nations and cements long-run demand for certified sustainable cotton.
AI-driven on-demand manufacturing reducing inventory waste
Real-time demand-sensing models boost SKU-level forecast accuracy by up to 25%, slashing unsold stock 30% for early adopters. Whole-garment knitting and high-speed digital printers make 50-unit batches economically viable, shrinking lead times from 60 to 14 days. Although unit economics still favor premium SKUs, hardware throughput is rising 20% annually, pushing the break-even price down toward USD 15 by 2028. Brands leveraging micro-drops report gross-margin lifts of 300–500 basis points and reduced markdown liability. Supply-chain resilience improves as brands pivot to regional micro-factories that shorten freight-risk exposure.
Carbon-Credit Monetization Programs Boosting Recycled-Fiber Profitability
The Gold Standard recycling methodology pays USD 44–66 per ton of CO₂-equivalent avoided, adding USD 140–210 revenue per ton of recycled polyester. At a 10,000 tpy plant, this improves internal returns by up to 3 percentage points and unlocks concessional finance for both mechanical and chemical facilities. California’s compliance market accepted its first textile credits in 2025, creating price discovery outside Europe. Large fiber producers embed carbon accounting in annual reports, bundling credits into offtake deals to offset higher recycled-feedstock costs. Smaller recyclers face audit-readiness hurdles, but voluntary carbon-market growth suggests an expanding buyer pool.[2]Gold Standard, “Textile Recycling Methodology,” goldstandard.org
Restraints Impact Analysis
| Restraints | ( ~ ) % Impact on CAGR Forecast | Geographic Relevance | Impact Timeline |
|---|---|---|---|
| Red Sea shipping disruptions inflating freight costs for Asia-to-EU lanes | −0.5% | Global, concentrated on Asia-Europe corridors | Short term (≤ 2 years) |
| Escalating renewable-energy surcharges raising electricity costs for energy-intensive spinning mills | −0.4% | Europe, with spillover to India and China | Short term (≤ 2 years) |
| Tightening microplastic shedding regulations increasing R&D and compliance spend | −0.3% | Europe, California, expanding to Canada and Japan | Medium term (2-4 years) |
| PFAS bans forcing costly reformulation of performance finishes | −0.3% | North America and Europe | Medium term (2-4 years) |
| Source: Mordor Intelligence | |||
Red Sea Shipping Disruptions Inflating Freight Costs for Asia-to-EU Trade Lanes
Rerouting around the Cape of Good Hope adds 10–14 days transit and up to USD 100,000 per 25-FEU order. Working-capital cycles lengthen, forcing earlier order placement and eroding fast-fashion responsiveness. Spot rates eased mid-2025, but forwarders price a persistent risk premium. Near-shoring gains momentum; Turkish and Moroccan mills that deliver within a week pick up share, even at 10%-plus higher FOB prices. Brands re-evaluate free-on-board terms, seeking dual-source strategies to hedge corridor risk.[3]Financial Times, “Red Sea Disruption Reshapes Asia-Europe Supply Chains,” ft.com
Escalating Renewable-Energy Surcharges Raising Electricity Costs
Electricity can represent 20% of ring-spinning variable cost, so 12%–18% tariff hikes in Germany and Spain during 2024 shaved up to 250 basis points from mill margins. Many facilities counter with rooftop solar or renewable power-purchase agreements, but USD 1–3 million capex and five-year paybacks deter smaller operators. Some mills relocate to Egypt and Ethiopia, where tariffs hover near USD 0.06 per kWh. Grid decarbonization policy thus redistributes competitive advantage rather than uniformly promoting sustainability.
Segment Analysis
By Application: Technical Textiles Outpace Fashion on Performance Mandates
Fashion & Apparel commanded 56.06% of the 2025 demand, underscoring consumer dominance within the textile industry market. Yet Industrial/Technical Textiles are growing at a 6.15% CAGR, the fastest pace across applications, as performance criteria in automotive, medical, and construction projects trump aesthetic drivers. Automotive airbag, seatbelt, and interior-trim fabrics now fetch 30% price premiums, supported by electric-vehicle lightweighting targets. Medical disposables maintain double-digit growth, buoyed by aging populations and entrenched infection-control standards. Protective workwear sales rise on stricter flame-resistance codes in energy and utilities, while sports fabric innovators integrate phase-change materials to command USD 10 premiums per garment.
Automotive lightweighting extends the textile industry market share for high-tenacity polyester yarns, and hospital demand anchors volumes in non-woven gowns and drapes. Household & Home textiles grow modestly at 3%–4%, limited by mature replacement cycles. Sports-performance niches exploit moisture management and thermoregulation to sustain premium pricing. As sustainability pressure mounts, brands blend aesthetic appeal with certified functionality, solidifying technical segments as a structural growth engine for the textile industry market.
Note: Segment shares of all individual segments available upon report purchase
By Raw Material: Polyester Leads Synthetics as Recycled Content Scales
Synthetic fibers occupied 53.96% of the 2025 supply, making them the largest raw material block in the textile industry market. Polyester, with a 6.56% projected CAGR to 2031, leverages cost advantage and dimensional stability to outgrow cotton, especially in activewear and industrial composites. Recycled polyester already comprises nearly one-fifth of all polyester output, supported by brand pledges for 50% recycled content by 2030 and mechanical-plus-chemical recycling hybrids that close the loop. Natural fibers—cotton, wool, silk—face water scarcity challenges and forced-labor scrutiny, limiting expansion to premium niches. Nylon retains a role in hosiery and technical cordage, but higher costs curb volume growth.
Chemical recycling’s added USD 0.40 per kilogram cost still constrains mass uptake; however, carbon-credit monetization offsets part of the premium. Specialty high-performance fibers, though less than 1% of tonnage, deliver outsized value in aerospace, defense, and technical PPE. With brand scorecards ranking input sustainability alongside performance, polyester’s roadmap now hinges on decarbonized feedstocks and proven recycled-content traceability, reinforcing its centrality to the textile industry market.
By Process/Technology: Non-Wovens Gain on Automotive and Hygiene Demand
Woven fabrics held 48.36% process share in 2025, yet non-wovens are on track for a 6.05% CAGR, accelerating the shift toward engineered fabrics that embed functionality at the fiber-bonding stage. Spunbond-meltblown composites underpin surgical-mask and diaper-cover-stock expansion, while hydro-entangled substrates gain traction in premium wet wipes. Knitted fabrics dominate in athleisure and intimate apparel, using seamless construction to reduce wastage 20%. Spacer fabrics and 3D weaves enter electric-vehicle seating, delivering 30% weight savings over foam-laminated assemblies.
Meltblown polypropylene investment surged 30% in China and India during 2024–2025 as governments replenished pandemic stockpiles. Needle-punched felts extend into geotextiles for infrastructure reinforcement, benefitting from global public-works stimulus. Capital costs for 3D weaving machines remain high at USD 0.5–1.5 million, but automotive OEM adoption signals a future uptick. As process technology converges on agility and embedded performance, non-wovens stand poised to enlarge their textile industry market share in both consumer and industrial domains.
Note: Segment shares of all individual segments available upon report purchase
Geography Analysis
Asia-Pacific retained 54.06% of 2025 output, anchored by integrated Chinese clusters that compress lead times and by Bangladesh’s low labor costs. Vietnam captured diverted U.S. orders under the UFLPA, posting 18% year-on-year export growth in H1 2025, while India’s Production-Linked Incentive scheme drove a 9% climb in textile shipments, reinforcing its China-plus-one appeal. The Middle East & Africa is the fastest-growing region at a 5.80% CAGR, propelled by Egypt’s EU trade perks and Saudi Arabia’s USD 1.32 billion polyester investments that extend petrochemical value chains into fiber.
Europe, representing almost one-fifth of demand, pivots to high-value technical textiles as the Carbon Border Adjustment Mechanism raises import costs for carbon-heavy Asian products. German and Italian mills channel R&D into medical and automotive fabrics, capturing resilient margins even as mass-market apparel relocates. North America rides a reshoring wave in non-wovens and technical fabrics, with southeastern U.S. states attracting USD 400 million in capacity expansions that prioritize supply-chain resilience. South America, led by Brazil and Peru, posts steady 3%–4% gains but remains hindered by logistics bottlenecks that inflate delivered costs.
Turkey and Morocco benefit from Red Sea shipping disruptions, offering 5-to-7-day delivery windows into European DCs. South African mills leverage the AfCFTA to sell into Nigeria and Kenya, reversing a decade-long import tide. Energy-cost differentials and regulatory alignment with EU traceability rules will continue to re-order the geography of the textile industry market through 2031.
Competitive Landscape
Global spinning and weaving stays fragmented: the top 10 producers control below 15% of capacity, giving price-setting leverage to large buyers. In contrast, specialty fiber markets are coalescing; the five leading aramid, carbon, and medical non-woven suppliers now hold roughly 80% of volume, thanks to high capital intensity and patent walls that deter entrants. Vertical integration from PTA polymer to garment assembly- delivers up to 12% cost savings and faster design cycles, an edge exploited by Reliance Industries, Toray Industries, and Far Eastern New Century.
Technology pulls competition in two directions. AI-enabled demand planning and digital printing empower agile direct-to-consumer brands that value inventory velocity over scale, while mega-plants in polyester polymerization and spunbond non-wovens lock in feedstock economics unreachable for smaller rivals. Patent filings in textile recycling jumped 40% from 2022 to 2024; companies license enzymatic depolymerization to incumbents, trading margin for speed to market and broad feedstock access.
Regulatory standards solidify competitive barricades. ISO and ASTM committees advance microfiber-shedding, digital-passport, and recycled-content norms that favor early movers with compliance infrastructure. Consolidation accelerates via M&A, exemplified by Berry Global’s USD 320 million Polish non-woven acquisition that tucks low-cost Eastern European production under a global sales umbrella. As performance, sustainability, and traceability converge, scale players diversify into bio-based and circular models, while niche innovators leverage licensing to punch above their balance-sheet weight.
Textile Industry Leaders
Toray Industries Inc.
Weiqiao Pioneering Group Co. Ltd.
Texhong Textile Group Ltd.
Inditex S.A.
Aditya Birla Fashion & Retail Ltd.
- *Disclaimer: Major Players sorted in no particular order
Recent Industry Developments
- January 2026: Toray Industries committed USD 450 million to expand carbon-fiber production in South Carolina, adding 8,000 tpy capacity for automotive and aerospace composites.
- December 2025: Lenzing AG and Birla Cellulose agreed to co-scale lyocell fiber from agricultural waste, targeting 50,000 tpy by 2029.
- November 2025: Reliance Industries completed a USD 600 million polyester-staple-fiber plant in Gujarat with integrated PET-bottle recycling for 30% feedstock.
- October 2025: Hyosung TNC and Aquafil formed a South Korean regenerated-nylon JV, investing USD 80 million in 20,000 tpy Econyl capacity.
Global Textile Market Report Scope
| Fashion & Apparel |
| Industrial/Technical Textiles |
| Household & Home Textiles |
| Medical & Healthcare Textiles |
| Automotive & Transport Textiles |
| Others (Protective, Sports Textiles, etc.) |
| Natural Fibers | Cotton |
| Wool | |
| Silk | |
| Synthetic Fibers | Polyester |
| Nylon | |
| Rayon / Viscose | |
| Acrylic | |
| Polypropylene | |
| Recycled Fibers | |
| Others (Speciality High-Performance Fibers (Aramid, Carbon, UHMWPE)) |
| Woven | |
| Knitted | |
| Non-woven | Spunlaid (Spunbond / Melt-blown) |
| Dry-laid Hydro-entangled | |
| Wet-Laid | |
| Needle-punched | |
| 3-D Weaving & Spacer Fabrics |
| North America | United States |
| Canada | |
| Mexico | |
| South America | Brazil |
| Argentina | |
| Peru | |
| Rest of South America | |
| Europe | United Kingdom |
| Germany | |
| France | |
| Italy | |
| Spain | |
| BENELUX (Belgium, Netherlands, and Luxembourg) | |
| NORDICS (Denmark, Finland, Iceland, Norway, and Sweden) | |
| Rest of Europe | |
| Asia-Pacific | China |
| India | |
| Japan | |
| Australia | |
| South Korea | |
| ASEAN (Indonesia, Thailand, Philippines, Malaysia, Vietnam) | |
| Rest of Asia-Pacific | |
| Middle East and Africa | Saudi Arabia |
| United Arab Emirates | |
| Qatar | |
| Kuwait | |
| Turkey | |
| Egypt | |
| South Africa | |
| Nigeria | |
| Rest of Middle East and Africa |
| By Application | Fashion & Apparel | |
| Industrial/Technical Textiles | ||
| Household & Home Textiles | ||
| Medical & Healthcare Textiles | ||
| Automotive & Transport Textiles | ||
| Others (Protective, Sports Textiles, etc.) | ||
| By Raw Material | Natural Fibers | Cotton |
| Wool | ||
| Silk | ||
| Synthetic Fibers | Polyester | |
| Nylon | ||
| Rayon / Viscose | ||
| Acrylic | ||
| Polypropylene | ||
| Recycled Fibers | ||
| Others (Speciality High-Performance Fibers (Aramid, Carbon, UHMWPE)) | ||
| By Process / Technology | Woven | |
| Knitted | ||
| Non-woven | Spunlaid (Spunbond / Melt-blown) | |
| Dry-laid Hydro-entangled | ||
| Wet-Laid | ||
| Needle-punched | ||
| 3-D Weaving & Spacer Fabrics | ||
| By Geography | North America | United States |
| Canada | ||
| Mexico | ||
| South America | Brazil | |
| Argentina | ||
| Peru | ||
| Rest of South America | ||
| Europe | United Kingdom | |
| Germany | ||
| France | ||
| Italy | ||
| Spain | ||
| BENELUX (Belgium, Netherlands, and Luxembourg) | ||
| NORDICS (Denmark, Finland, Iceland, Norway, and Sweden) | ||
| Rest of Europe | ||
| Asia-Pacific | China | |
| India | ||
| Japan | ||
| Australia | ||
| South Korea | ||
| ASEAN (Indonesia, Thailand, Philippines, Malaysia, Vietnam) | ||
| Rest of Asia-Pacific | ||
| Middle East and Africa | Saudi Arabia | |
| United Arab Emirates | ||
| Qatar | ||
| Kuwait | ||
| Turkey | ||
| Egypt | ||
| South Africa | ||
| Nigeria | ||
| Rest of Middle East and Africa | ||
Key Questions Answered in the Report
What is the current size of the global textile market?
The global textile market is valued at USD 798.96 billion in 2026 and is projected to reach USD 1,024.08 billion by 2031, growing at a 5.09% CAGR.
How fast will technical textiles grow compared with fashion and apparel?
Industrial and technical categories are forecast to outpace fashion, expanding at a 6.15% CAGR through 2031 as functional performance and regulatory mandates lift demand.
Which fiber type will dominate capacity additions between now and 2031?
Polyester, especially recycled grades, is projected to see the largest absolute capacity growth, sustaining a 6.56% CAGR and reinforcing its leading share in the textile industry market.
Why are non-woven fabrics gaining share?
Single-use medical products, hygiene substrates, and automotive lightweighting favor non-wovens, driving a 6.05% CAGR that will raise their slice of the textile industry market by 2031.
What impact do PFAS bans have on outdoor-apparel suppliers?
PFAS phase-outs push suppliers toward fluorine-free finishes that cost up to 40% more and deliver lower durability, increasing R&D expense and compelling closer brand-chemical-supplier collaboration.
How are shipping disruptions influencing sourcing strategy?
Prolonged Red Sea risks and higher freight costs accelerate near-shoring to Turkey and Morocco, enabling 5–7-day delivery into EU distribution centers versus multi-week ocean transit from Asia.


