
Global Telecom Cable Market Size and Share
Market Overview
| Study Period | 2020 - 2031 |
|---|---|
| Market Size (2026) | USD 115.3 Billion |
| Market Size (2031) | USD 161.39 Billion |
| Growth Rate (2026 - 2031) | 6.96% CAGR |
| Fastest Growing Market | Asia-Pacific |
| Largest Market | Asia-Pacific |
| Market Concentration | Medium |
Major Players *Disclaimer: Major Players sorted in no particular order Image © Mordor Intelligence. Reuse requires attribution under CC BY 4.0. | |
Global Telecom Cable Market Analysis by Mordor Intelligence
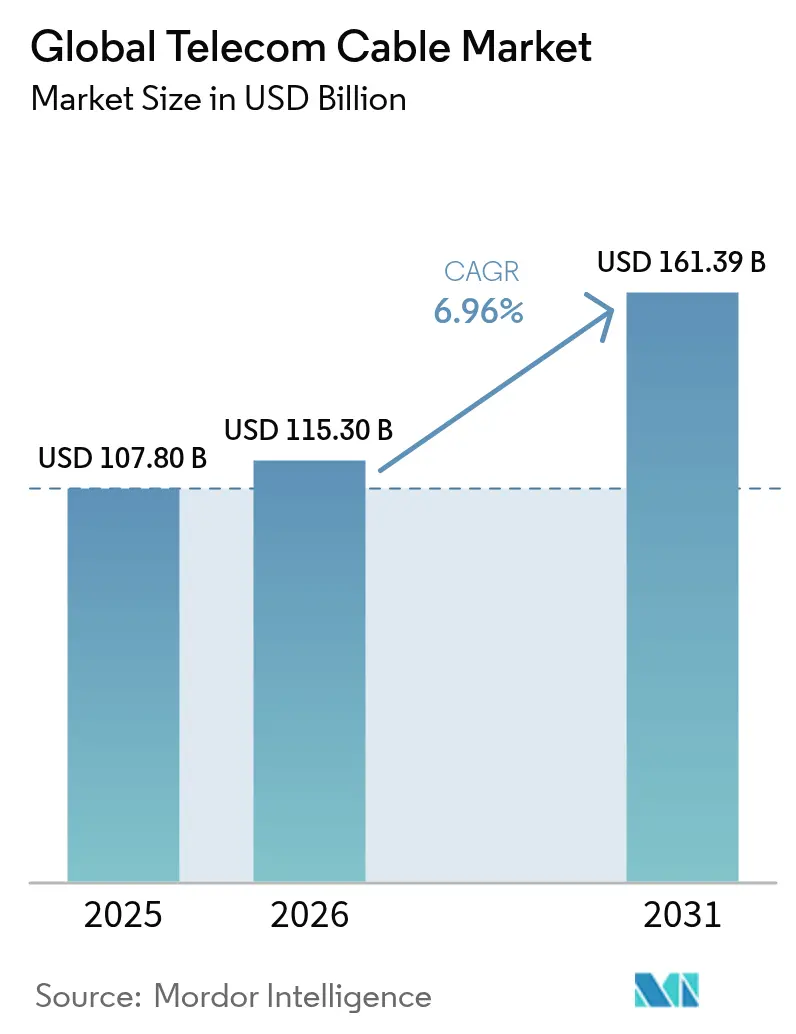
Global Telecom Cable Market size in 2026 is estimated at USD 115.3 billion, growing from 2025 value of USD 107.80 billion with 2031 projections showing USD 161.39 billion, growing at 6.96% CAGR over 2026-2031.
Healthy demand stems from relentless bandwidth growth tied to artificial intelligence processing, 5G footprint densification, and hyperscale data-center expansion. Operators are phasing out legacy copper, accelerating fiber roll-outs even as capital intensity rises. Private submarine networks commissioned by hyperscalers add another growth pillar, while rural broadband subsidies in North America and Europe inject long-tail demand. At the same time, cost inflation for underground civil works and skilled-labor scarcity temper the near-term pace, forcing firms to pursue innovative installation techniques and automation.
Key Report Takeaways
- By product type, fiber-optic cables led with 56.60% revenue share in 2025; coaxial held 2nd place, yet fiber is advancing at an 8.63% CAGR to 2031.
- By application, core and access networks captured 45.55% of the telecom cable market size in 2025; data center and distributed cloud infrastructure are growing fastest at 7.48% CAGR through 2031.
- By installation environment, underground deployments held 52.05% of the telecom cable market share in 2025, while subsea systems posted the quickest 7.99% CAGR.
- By end-user, telecom operators commanded a 58.90% share in 2025; hyperscalers and cloud providers recorded the highest 7.18% CAGR.
- By geography, Asia-Pacific dominated with a 47.10% share in 2025 and will expand at a 7.75% CAGR.
Note: Market size and forecast figures in this report are generated using Mordor Intelligence’s proprietary estimation framework, updated with the latest available data and insights as of 2026.
Global Telecom Cable Market Trends and Insights
Drivers Impact Analysis*
| Driver | (≈) % Impact on CAGR Forecast | Geographic Relevance | Impact Timeline |
|---|---|---|---|
| 5G backhaul surge and densification needs | +1.80% | Global, APAC & North America | Medium term (2-4 years) |
| Hyperscale data-center interconnect bandwidth boom | +1.50% | Global, concentrated in North America, Europe, APAC | Long term (≥ 4 years) |
| Government-funded broadband build-outs | +1.20% | North America & EU | Medium term (2-4 years) |
| IoT and smart-city connectivity proliferation | +0.80% | Global | Long term (≥ 4 years) |
| Source: Mordor Intelligence | |||
5G Backhaul Surge and Densification Needs
China’s 4.4 million live 5G sites each require far denser fiber than 4G towers, and comparable densification waves are unfolding at Verizon, NTT Docomo, and Reliance Jio. Operators embrace cloud-RAN architectures where baseband units are centralized, further multiplying fiber strands per site. Multicore fibers demonstrated by NTT at 455 Tbps over 1,017 km underscore the technology path needed to satisfy mobile traffic[1]NTT Corporation, “Multicore fiber shatters 455 Tbps record,” ntt.com.
Hyperscale Data-Center Interconnect Bandwidth Boom
GPU clusters used for AI training exchange massive data sets that overwhelm yesterday’s 100 G links. Meta’s Project Waterworth and Corning’s 1.6T component roadmap highlight how demand is spilling into completely new cable geometries, including multicore fiber designs able to support 800G and beyond.
Government-Funded Broadband Build-Outs
The USD 42.45 billion BEAD program in the United States and the European Union’s Digital Decade both stipulate gigabit targets that require fiber to every locality. Domestic-sourcing rules prompt manufacturers such as Prysmian to expand Tennessee and North Carolina plants, while training programs aim to mitigate labor gaps.
IoT and Smart-City Connectivity Proliferation
Municipalities deploy edge-dense networks linking cameras, traffic sensors, and utility meters. Projects in Morrow, Georgia, and Cambridge, England, show how smart-city fiber grids handle everything from public Wi-Fi to real-time telemetry. Enterprise campuses replicate the model, using Fiber-to-the-Edge topologies to power occupancy sensors and building automation.
Restraints Impact Analysis*
| Restraint | (≈) % Impact on CAGR Forecast | Geographic Relevance | Impact Timeline |
|---|---|---|---|
| Underground deployment costs two-to-three times aerial | -1.10% | Global, acute in dense urban areas | Short term (≤ 2 years) |
| Skilled-labor shortages are delaying rollouts | -0.90% | North America & EU | Medium term (2-4 years) |
| Source: Mordor Intelligence | |||
Underground Deployment Costs Two to Three Times More Than Aerial Alternatives
Median underground placement now costs USD 18.25 per foot versus USD 6.55 for aerial lines, with labor accounting for up to 80 % of the trenching bill. Rocky terrain or downtown utility congestion pushes figures past USD 20 per foot, compelling operators to postpone projects or pivot toward micro-trenching where regulators allow.
Skilled-Labor Shortages Delaying Fiber Rollouts
Tens of thousands of fiber splicers, linemen, and network engineers are missing from payrolls despite record wage offers. Training consortia in 23 US states, plus AT&T-Corning academies, are scaling up, yet graduation pipelines lag near-term demand. The gap inflates project budgets and elongates delivery timelines, especially for rural builds under BEAD[2]Fiber Broadband Association, “Workforce initiative expands to 23 states,” lightwaveonline.com.
*Our forecasts treat driver/restraint impacts as directional, not additive. The impact forecasts reflect baseline growth, mix effects, and variable interactions.
Segment Analysis
By Type: Fiber-Optic Dominance Accelerates
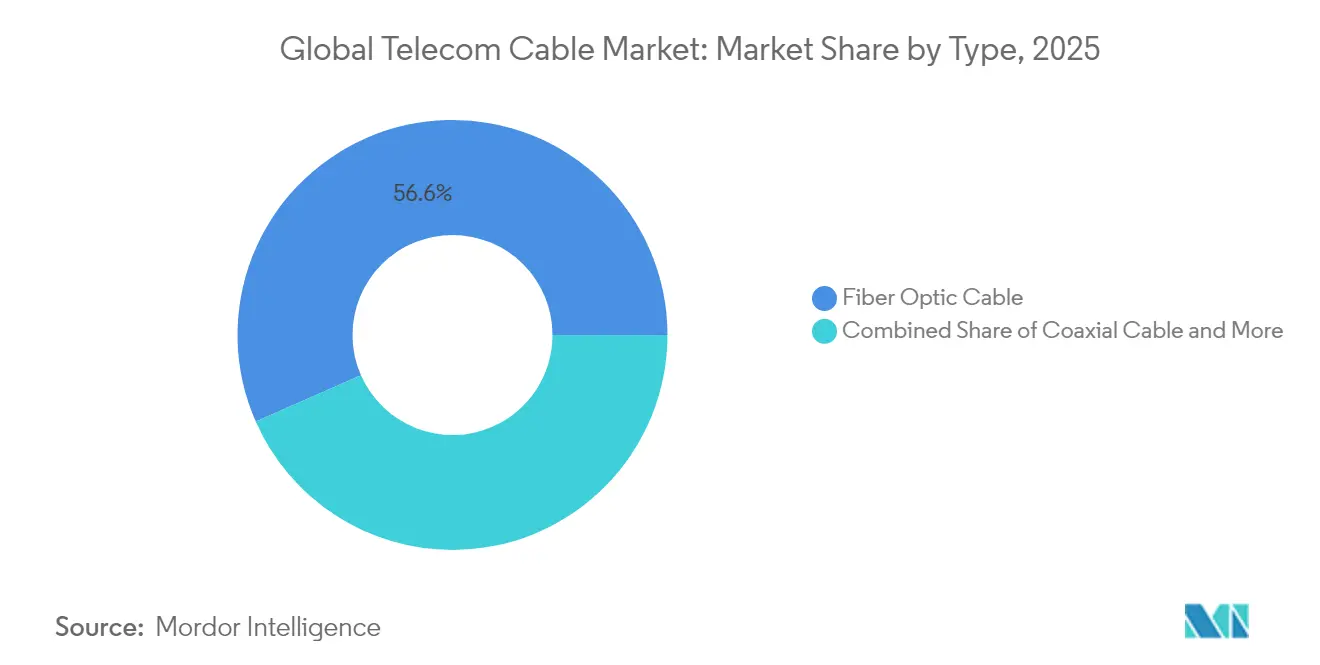
Fiber-optic solutions captured 56.60% of the telecom cable market share in 2025 and are advancing at an 8.63% CAGR toward 2031. Suppliers lean on physics: Glass can carry terabits over kilometers without repeaters, a feat copper cannot match. High-density designs such as Prysmian’s 864-fiber Sirocco Extreme push 11.5 fibers per square millimeter, allowing operators to squeeze capacity into existing ducts.
Coaxial and twisted-pair sections of the telecom cable market continue serving hybrid fiber-coax networks and niche PoE+ runs, yet their relevance dwindles as enterprises migrate to all-optical LANs. Composite cables that fuse power conductors with glass strands are a bridge technology, easing building-automation upgrades while preserving legacy endpoints.


By Application: Data Centers Drive Innovation
Core and access networks accounted for 45.55% of the telecom cable market size in 2025, reflecting decades of operator investment. Data center and distributed cloud interconnects, however, are the fastest-rising slice at 7.48 % CAGR through 2031. AI clusters require topologies where every server GPU must reach others at 800G or 1.6T speeds, pushing multicore and hollow-core fiber trials from China Telecom and ZTE into pre-production.
Video broadcast and CATV still consume bandwidth as 4K and 8K streams proliferate, but growth is muted compared with hyperscale and enterprise AI needs. Campus LANs also pivot to fiber thanks to reduced electromagnetic interference and simplified pathways for converged building systems.
By Installation Environment: Subsea Surge Reflects AI Investments
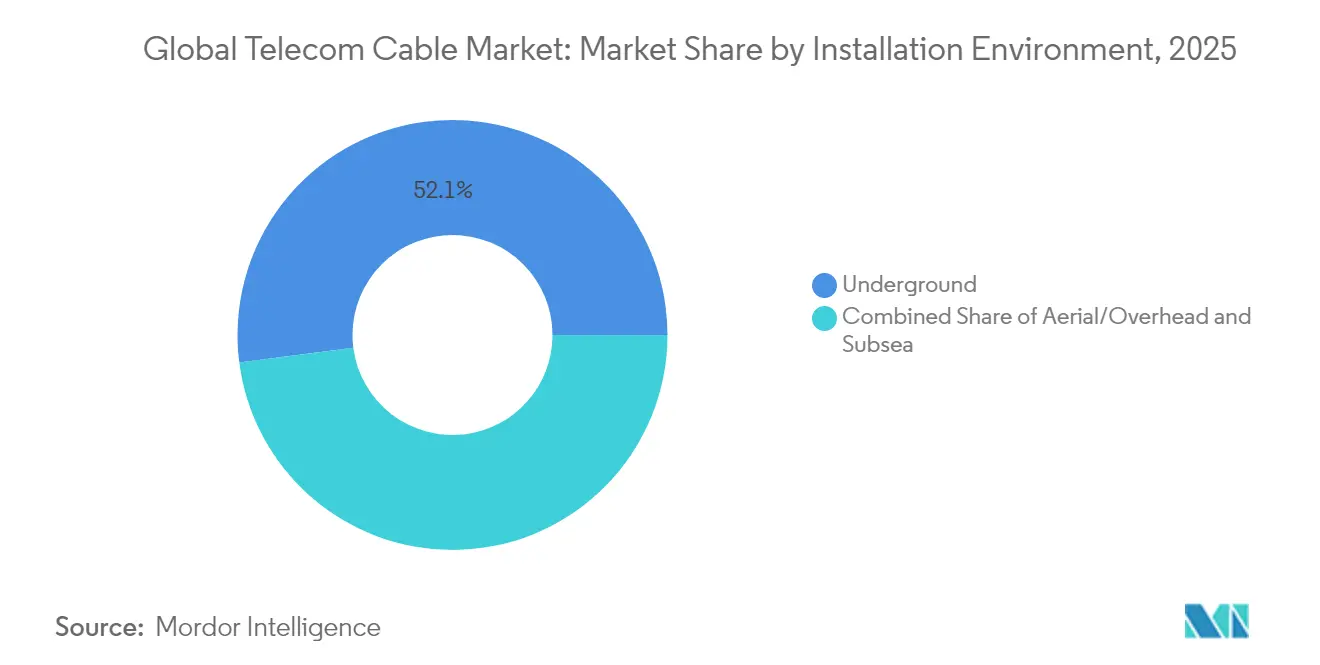
Underground plant retained 52.05% of 2025 revenue, driven by urban regulations and weather resilience. Yet subsea networks will rise fastest, at 7.99% CAGR, as hyperscalers lay private trans-oceanic systems that bypass carriers and tailor routes for machine learning replication cycles. Meta’s latest Pacific cable exemplifies the shift, coupling 24-fiber pairs with space-division multiplexing amplifiers.
Aerial builds remain vital for cost-sensitive rural runs, particularly across North America’s corn belt and India’s semi-urban corridors, where poles exist and trench rights are scarce. Meanwhile, incidents such as the Red Sea cable cut that disrupted 90 % of Europe-Asia traffic underscore the strategic value and vulnerability of subsea corridors.
By End-User Industry: Hyperscaler Transformation
Telecom operators still bought 58.90% of cables in 2025, but hyperscalers and cloud providers display the fastest 7.18% CAGR. Giants like Google and Microsoft increasingly negotiate directly with producers for custom ribbon counts and tailored attenuation specs. Operator responses include mergers and fiber asset grabs, witness Verizon’s Frontier purchase to shore up scale and bargaining power.
Government and utility entities maintain stable demand as they digitize grids and municipal services. Defense contracts, such as Verizon’s multi-base 5G roll-out, introduce stringent cybersecurity and ruggedization criteria that only a narrow supplier bench can meet.
Geography Analysis
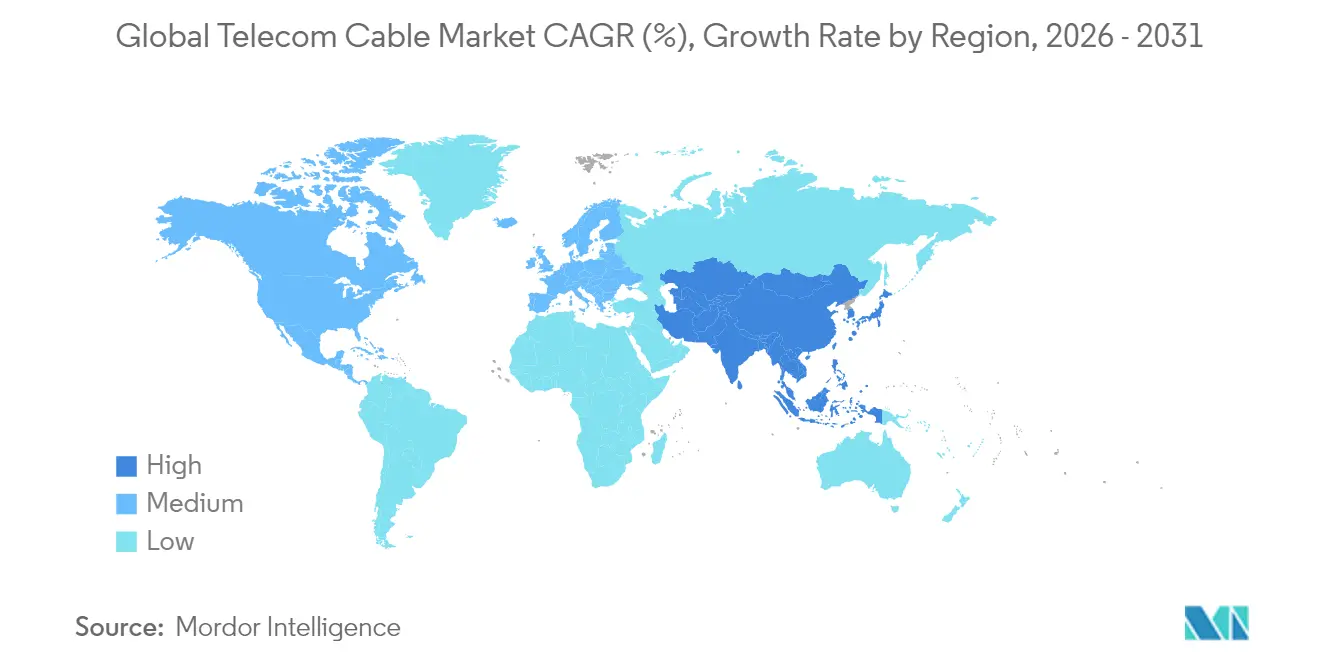
Asia-Pacific held 47.10% of the telecom cable market share in 2025 and is projected to post a 7.75% CAGR through 2031, buoyed by China’s additional 4.5 million 5G macro-cells planned for 2025 and India’s data-center construction wave. Japan’s NTT continues to pioneer multicore fiber, securing national capacity gains and exporting patents to allies. Regional manufacturing clusters in Shenzhen, Guangzhou, and Hsinchu further cement APAC scale advantages.
North America ranks second, fueled by BEAD subsidies and hyperscaler outlays. Operators target 30 million new fiber passings by 2025, while private-equity financing of middle-mile routes across the Midwest underpins long-haul demand. Cross-border systems such as C3ntro’s Tikva network strengthen US-Mexico integration, supporting latency-sensitive fintech and content applications.
Europe shows patchy progress: France and Spain exceed 60 % FTTH take-up, whereas Germany sits under 30 %, necessitating EUR 44.3 billion additional spend. Anti-dumping duty on Indian cable imports raises costs but shields local firms. Channel traffic reallocations around the Baltic and Mediterranean underscore geopolitical sensitivity, spurring redundant landing sites in Portugal and Greece.

Regulatory Landscape
Regulation affecting telecom cables increasingly focuses on security, resilience, and technical standardization, particularly for submarine systems that support global traffic. In the United States, the Federal Communications Commission (FCC) expanded its submarine cable licensing framework in June 2026 to include Submarine Line Terminal Equipment (SLTE) owners and operators, and adopted national security standards intended to streamline processing for qualifying applications while maintaining heightened scrutiny for higher-risk filings.
On the standards front, ITU-T approvals in November 2025 (including recommendations for monitoring characteristics and test methods for optical fiber submarine cable systems) reinforce compliance pull-through for suppliers of cable, repeaters, and associated monitoring or telemetry equipment. At the international level, UNCLOS continues to set the legal backdrop for cable protection and repair rights, while multilateral efforts such as the International Advisory Body on Submarine Cable Resilience (2026 publication following the Porto Summit) point to more coordinated resilience practices that intersect with permitting, repair readiness, and operator reporting expectations.
Value Chain Analysis
The telecom cable value chain starts with upstream materials and components, including silica preforms and optical fiber draw, polymers and jackets, aramid yarn, and metallic conductors for hybrid designs. It then moves through cable design and manufacturing, such as high-fiber-count terrestrial microduct or ribbon products and repeatered submarine cable, before transitioning to distribution and project execution, including engineering, permitting, civil works, installation, testing, and maintenance.
Large incumbents with vertical integration and qualification histories compress lead times and reduce supply risk for hyperscalers and operators. Downstream economics often tilt to civil works for underground plant and marine services for subsea routes, and recent subsea announcements highlight where bottlenecks concentrate, including reliance on a narrow pool of specialized cable-laying vessels and deep-ocean repair capability, with fleet availability described as constrained and bookings extending beyond 2027. Landing-station readiness, environmental surveys, and route approvals can also delay schedules alongside factory slots. In terrestrial procurement, domestic-sourcing requirements in the United States (BABA-compliant glass) and raw-material volatility have contributed to cost spikes and contract stress on large rollout programs such as BharatNet, pushing buyers toward tighter supplier qualification, longer-term agreements, and more standardized high-density cable architectures to make better use of duct capacity.
Competitive Landscape
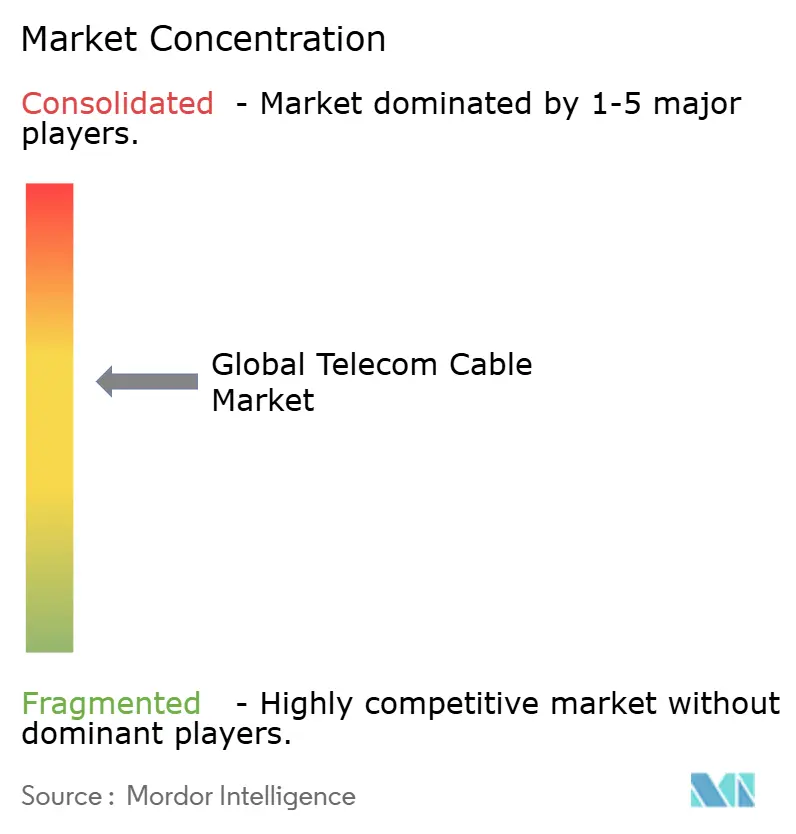
The telecom cable market features moderate consolidation. The top five groups, Prysmian, Corning, CommScope, Fujikura, and Nexans, have a significant presence in the market. Their vertical integration, from optical preform pulling to finished cable, delivers cost leverage and fast lead times. Prysmian’s EUR 5 billion Amprion offshore grid contract and Corning’s AI-enabled demand-planning system showcase leadership positions.
Asian challengers such as Hengtong and ZTT compete aggressively on price and fast-cycle innovation, pressuring margins in commodity single-mode fiber. Western buyers in security-sensitive projects nevertheless favor established incumbents with long compliance track records. Patent filings on multicore, rollable-ribbon, and bend-insensitive designs hit record levels in 2025, signaling continuous differentiation.
Strategic moves include factory localization, Belden’s new 300,000-square-foot Tucson fiber hub and automation, with Prysmian rolling out robotic ribbon stackers. Alliances between cable makers and cloud companies deepen; STL’s partnership with Lumos accelerates BEAD-compliant passings in the US mid-Atlantic.
Global Telecom Cable Industry Leaders
Sumitomo Electric Industries, Ltd.
Prysmian Group
Fujikura Ltd.
Furukawa Electric Co.
Leoni AG
- *Disclaimer: Major Players sorted in no particular order

Market Opportunities and Future Outlook
AI-driven interconnect traffic and data-center buildouts create an opening for ultra-high-density fiber designs that expand capacity in constrained conduits and support short-reach and metro interconnect requirements. Market product innovation is already visible in very high fiber-count cable form factors for data centers (for example, 4,000-core designs) and microduct cables built around smaller-diameter fibers, which align with operator needs to add strands without reopening ducts and with hyperscalers preference for deterministic, scalable campus-to-campus connectivity.
Subsea capacity and route diversity are another opportunity area, supported by concrete 2026 actions in Asia and adjacent regions. The Nongsa-Changi Cable (NCC) completion in July 2026, connecting Batam (Indonesia) to Changi (Singapore) with 24 fiber pairs and 1.6 Pb/s capacity, alongside subsea investment and project announcements such as Tata Communications subsea expansion commitments and the I-2SEA system linking India, Malaysia, and Singapore (announced July 2026), shows active corridor buildout tied to hyperscaler-grade latency and resilience requirements. With continuing constraints around factory slots, vessels, and landing readiness, suppliers that can secure manufacturing windows, align monitoring and test compliance to ITU-T guidance, and partner into installation and repair ecosystems can target higher-value programs where schedule certainty and resiliency design carry procurement weight.
Recent Industry Developments
- July 2026: Prysmian Group signed a long-term agreement with Molex (Koch Inc.) valued up to EUR 5.5 billion, including an upfront payment, to supply optical cables for data center deployments over a 10-year term. The deal formalizes multi-year demand tied to hyperscale build cycles and supports higher utilization planning for advanced fiber and cable production geared to data center and DCI specifications.
- May 2026: Fujikura Ltd. announced plans to invest up to JPY 260 billion to expand US production capacity for fiber optic cables to serve accelerating data center demand. The investment targets localized supply for large buyers and helps address procurement pressure where delivery times and domestic manufacturing footprints influence award decisions.
- December 2024: Prysmian introduced EcoSpan FlexRibbon rural broadband cables designed for long aerial spans, supporting faster and lower-cost deployment in pole-line environments. The launch aligned product design with rural build economics where aerial routes and labor productivity are key constraints for last-mile expansion programs.


Research Methodology Framework and Report Scope
Market Definition and Coverage
For this study, the telecom cable market covers revenue from purpose-built cables used to carry voice, data, and video traffic in telecom networks. This includes fiber-optic, coaxial, twisted-pair, and hybrid fiber-coax cables deployed across long-haul, metro, access, and data-center interconnect builds.
Scope exclusions: We exclude premise-grade patch cords and short internal device jumpers, because they behave more like local connectivity accessories than network build demand.
Segmentation Overview
- By Type
- Fiber-optic Cable
- Coaxial Cable
- Twisted Pair Cable
- Hybrid Fiber-Coax (HFC)
- By Application
- Telecommunication Core and Access Networks
- Data Centers and DCI
- CATV and Broadcast
- Enterprise/Campus LAN
- Others (Defense, Oil and Gas, Energy)
- By Installation Environment
- Underground
- Aerial/Overhead
- Subsea
- By End-user Industry
- Telecom Operators
- Hyperscalers and Cloud Providers
- SMEs
- Government and Utilities
- By Geography
- North America
- United States
- Canada
- Mexico
- South America
- Brazil
- Argentina
- Rest of South America
- Europe
- Germany
- France
- United Kingdom
- Russia
- Rest of Europe
- Asia-Pacific
- China
- Japan
- India
- South Korea
- Rest of Asia-Pacific
- Middle East and Africa
- Middle East
- Saudi Arabia
- UAE
- Turkey
- Africa
- South Africa
- Nigeria
- Rest of Africa
- Middle East
- North America
Data Sources, Market Sizing, and Validation
Desk Research
Our desk work started by narrowing scope to telecom network cabling, then collecting consistent, repeatable indicators that track demand by region and network build cycle. We used public telecom and broadband sources to frame the demand pool and sanity check timing, including ITU connectivity statistics, OECD broadband indicators, FCC fixed broadband deployment reporting, Eurostat telecom and construction series, and World Bank infrastructure and macro data.
We then reviewed supplier annual reports, earnings decks, and press releases to understand product mix shifts, price movement, and capacity or expansion updates that can change shipments. To validate cross-border flows and unit value trends, we used paid subscriptions for company financials and intelligence, plus shipment-level import and export data where it provided a usable check. These examples are not exhaustive, and we referenced other public and paid sources to collect inputs, validate assumptions, and clarify unclear points.
Primary Interviews and Surveys
Primary work focused on interviews and structured surveys with cable manufacturers, distributors, installers, and telecom network buyers, so we could confirm what is being ordered and how decisions shift by project type. We covered major demand centers across APAC, EMEA, and the Americas, and we re-contacted experts when price moves, lead times, or build plans looked inconsistent with the desk signals.
Distribution of primary research fieldwork respondents
| Company type | Respondent position | Region |
|---|---|---|
| Top tier: 34% | CXOs: 19% | APAC: 42% |
| Mid tier: 44% | Functional/Unit leaders: 28% | EMEA: 35% |
| Smaller Players: 22% | Managers: 53% | Americas: 23% |
Market-Sizing & Forecasting
Sizing starts with a top-down build that reconstructs telecom cable demand from network investment cycles and deployment intensity, then allocates it across cable categories used in backbone, metro, access, and data-center interconnect links. To keep totals realistic, we corroborate results with selective bottom-up approximations, such as sampled average selling price ranges multiplied by inferred volumes from channel checks, and supplier revenue splits where disclosures are clear enough to use.
Key model inputs include fiber-to-the-home and broadband rollout pace, 4G and 5G transport expansion, data-center interconnect build activity, and known upgrade cycles in legacy copper and coax networks. We also incorporate regional construction and utility trenching activity that affects installation timing. Price assumptions were guided by observed swings in material and logistics costs, and by the way buyers describe bid resets. Where supplier-level detail is incomplete, we applied conservative allocation rules and then checked them against interview feedback.
For forecasting, we used scenario analysis supported by short trend models, since capex cycles and permitting or build bottlenecks can create step changes that straight-line growth tends to miss. The scenarios were adjusted using expert consensus on near-term order books, lead times, and the expected mix shift toward higher fiber content in new builds.
Data Validation & Update Cycle
Outputs were checked against independent signals, including broadband subscription trends, public network deployment reporting, and observed import and export value movement for relevant cable categories. This helps indicate when a region looks overbuilt or underbuilt. If a variance looked too wide, we reopened assumptions, and the analyst loop included a second review to confirm logic and arithmetic before sign-off.
Reports are refreshed annually, and interim updates are made when material events occur, such as large policy shifts, sharp input cost swings, or major build-plan revisions discussed publicly. Right before delivery, we run a fresh pass on the key inputs so clients receive the latest consistent view.
Mordor Intelligence's Global Telecom Cable Market Estimate Compared With Other Published Estimates
Published market sizes for telecom cable often vary because not everyone counts the same cable categories, and even similar labels can reflect different end-use coverage and timing. Differences also come from how pricing is handled in inflationary periods, and from whether the model follows network build cycles or applies smooth growth each year.
Some external figures fold telecom cable into wider wire and cable revenue pools or include adjacent connectivity items tied to buildings and devices. In Mordor Intelligence, the market is limited to purpose-built telecom network cables across long-haul, metro, access, and data-center interconnect applications, and it leaves out premise patch cords and short internal jumpers. That scope difference shows up directly in the totals.
Benchmark comparison
| Source | Market Size | Gaps in Research Methodology |
|---|---|---|
| Mordor Intelligence | USD 115.30 B (2026) | |
| Industry Data Portal A | USD 63.58 B (2025) | Uses a narrower counted demand pool that appears to focus on a smaller set of telecom cable use cases, and it can also treat pricing and volume through a single blended assumption, which typically compresses the total versus a network-build aligned model. |
| Industry Report Publisher B | USD 253.70 B (2025) | Looks closer to a broader telecom wire and cable umbrella, which likely pulls in non-telecom or building-linked wiring categories and inflates the figure compared with a scope that is restricted to telecom network deployment cables. |
The comparison shows that most of the spread comes from scope choices, especially whether broader wire and cable categories and connectivity accessories get counted. By tying the build to visible deployment signals and then checking the implied volumes and prices through interviews and channel feedback, we keep the estimate traceable to practical inputs that can be re-tested each year.


Key Questions Answered in the Report
What is the current value of the telecom cable market?
The telecom cable market is valued at USD 115.3 billion in 2026 and is forecast to reach USD 161.39 billion by 2031 at a 6.96% CAGR.
Which cable type is growing the fastest?
Fiber-optic cables lead growth with an 8.63% CAGR, holding 56.60% of 2025 revenue.
How much of the market do hyperscalers represent today?
Hyperscalers and cloud providers are the fastest-growing end-user group, expanding at a 7.18% CAGR while still trailing telecom operators’ 58.90% share.
Why are subsea cable deployments accelerating?
Private submarine systems built by hyperscalers support global AI clusters, driving a 7.99% CAGR for subsea installations.
What region dominates global demand?
Asia-Pacific accounts for 47.10% of market revenue in 2025 and is set to grow at 7.75% CAGR through 2031.
What is the key cost challenge in fiber roll-outs?
Underground construction averages USD 18.25 per foot about triple aerial costs, making civil works the largest expense component.
Page last updated on:






