
System Integration Market Size and Share
Market Overview
| Study Period | 2020 - 2031 |
|---|---|
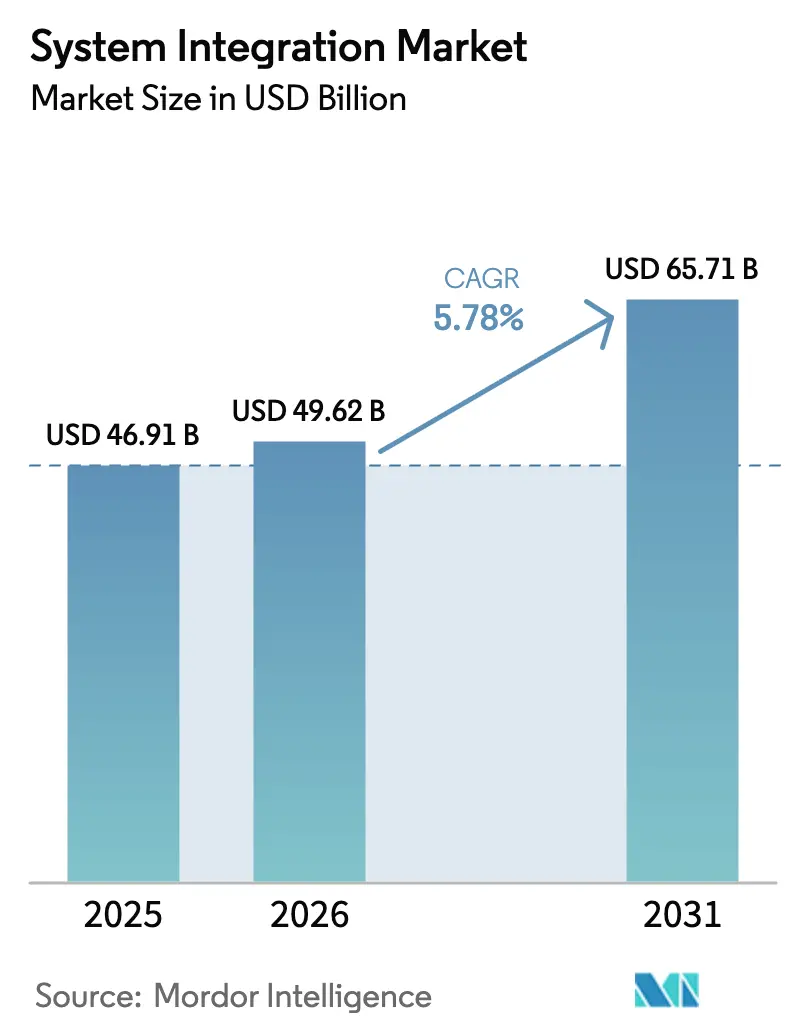
| Market Size (2026) | USD 49.62 Billion |
| Market Size (2031) | USD 65.71 Billion |
| Growth Rate (2026 - 2031) | 5.78% CAGR |
| Fastest Growing Market | Asia-Pacific |
| Largest Market | North America |
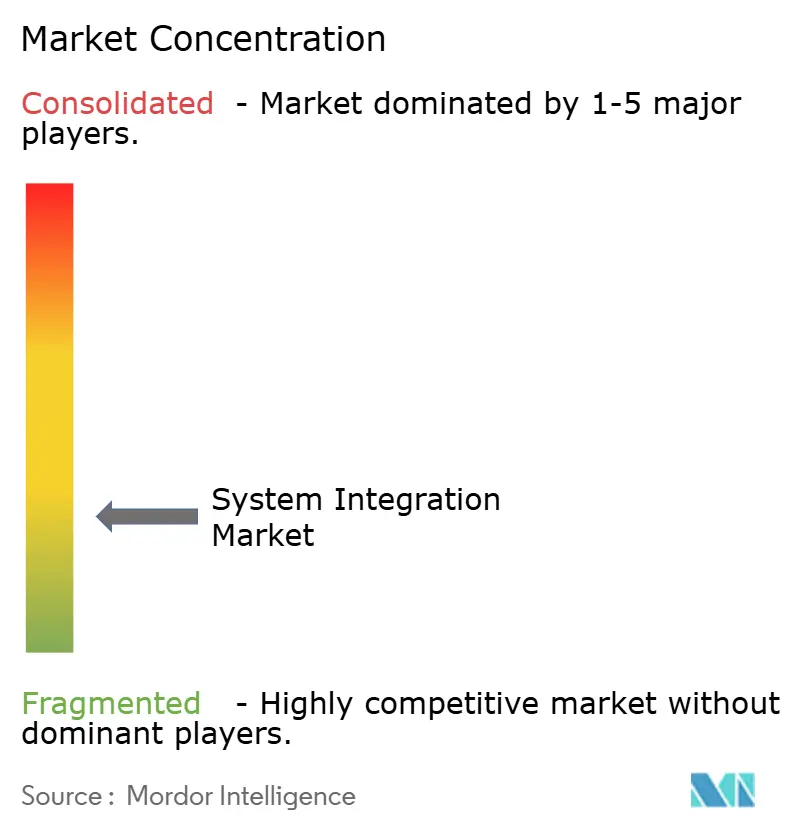
| Market Concentration | Low |
Major Players *Disclaimer: Major Players sorted in no particular order Image © Mordor Intelligence. Reuse requires attribution under CC BY 4.0. | |
System Integration Market Analysis by Mordor Intelligence
The system integration market size was valued at USD 46.91 billion in 2025 and estimated to grow from USD 49.62 billion in 2026 to reach USD 65.71 billion by 2031, at a CAGR of 5.78% during the forecast period (2026-2031). Surging demand for orchestration layers that unify on-premise, multi-cloud, and edge workloads is redefining the revenue mix away from one-time migration projects toward long-term managed services. Mandatory cyber-resilience rules on both sides of the Atlantic are pushing integration to the core of corporate governance agendas, while 5G and edge rollouts are shrinking latency budgets and elevating real-time data synchronization requirements. Hyperscalers now bundle integration natively inside their cloud platforms, compressing license margins for independent middleware vendors but expanding addressable workloads for consulting-led integrators. The talent squeeze for integration architects and the accumulated technical debt in mainframe estates temper growth, yet they also create higher-margin advisory opportunities as enterprises confront modernization bottlenecks.
Key Report Takeaways
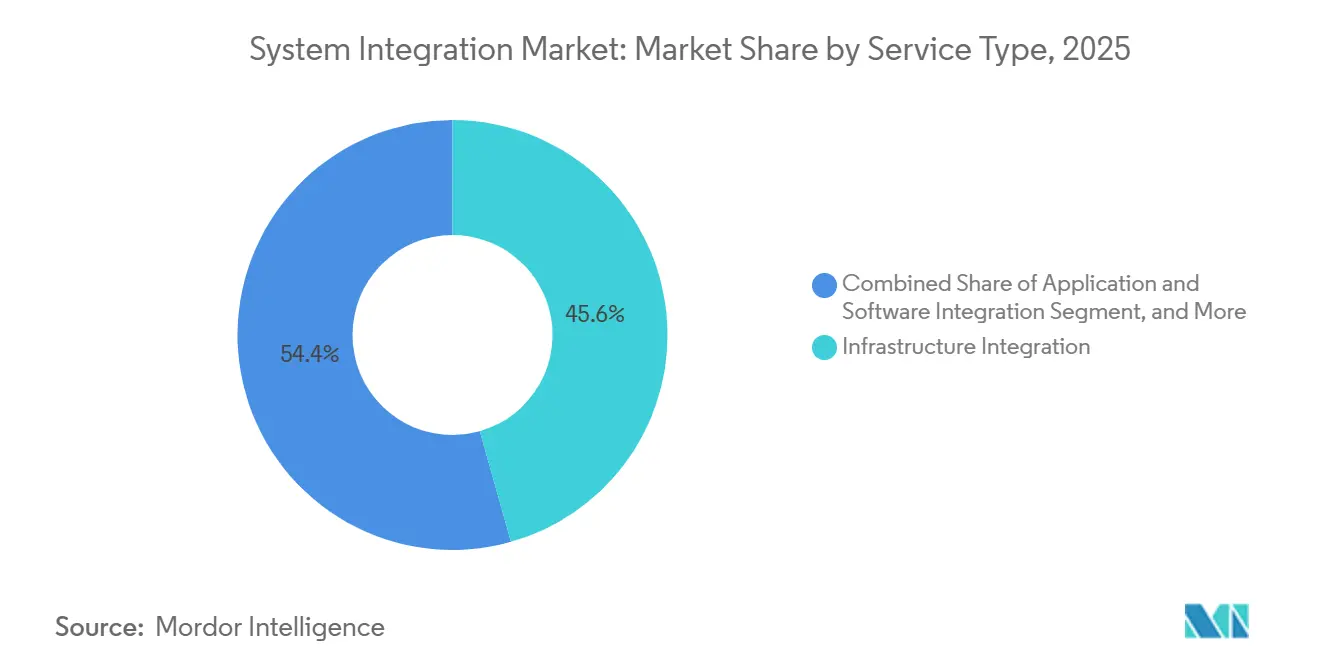
- By service type, infrastructure integration led with 45.61% of the system integration market share in 2025, while application and software integration is projected to post the fastest growth at a 6.33% CAGR through 2031.
- By deployment mode, on-premises installations commanded 59.16% of revenue share in 2025, whereas cloud-based integration platforms are set to expand at a 6.16% CAGR through 2031.
- By end-user industry, IT and telecom accounted for 27.83% of 2025 spending, while healthcare and life sciences are forecast to grow at a 7.71% CAGR over 2026-2031.
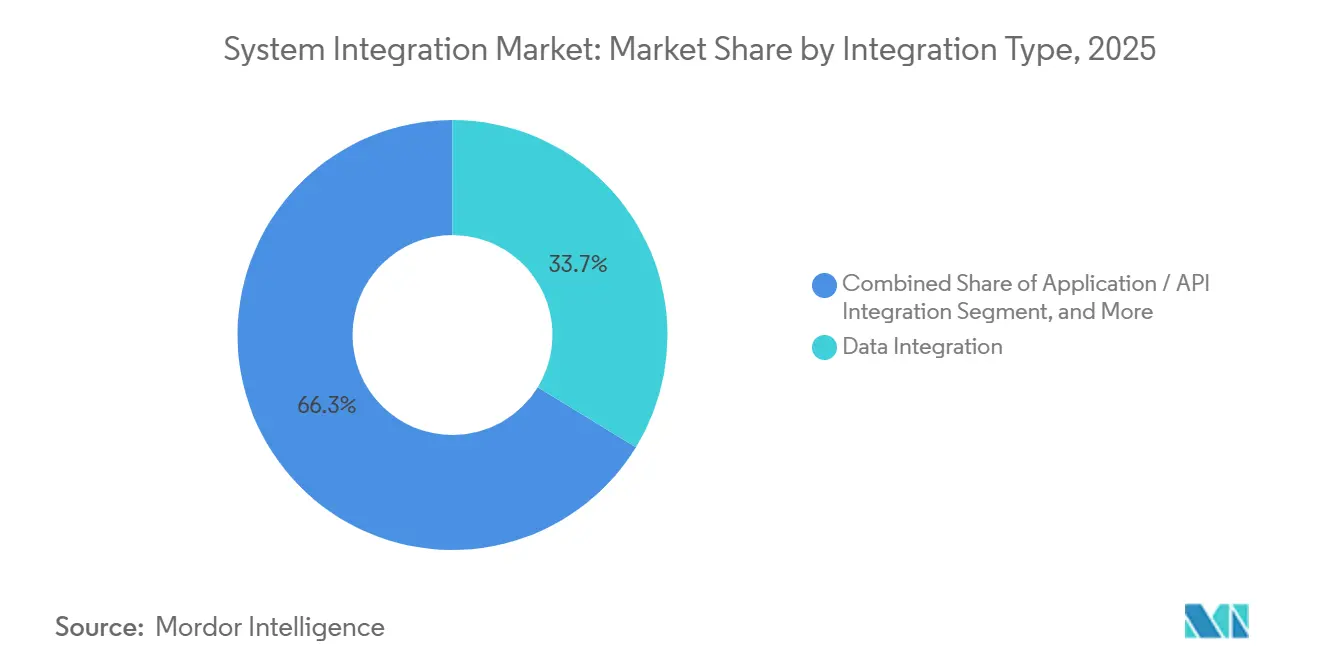
- By integration type, data integration captured 33.74% of 2025 revenue, and application and API integration is expected to accelerate at a 6.52% CAGR through 2031.
- By organization size, large enterprises accounted for 62.46% of 2025 revenue, yet small and medium enterprises are projected to grow at a 6.19% CAGR over the forecast period.
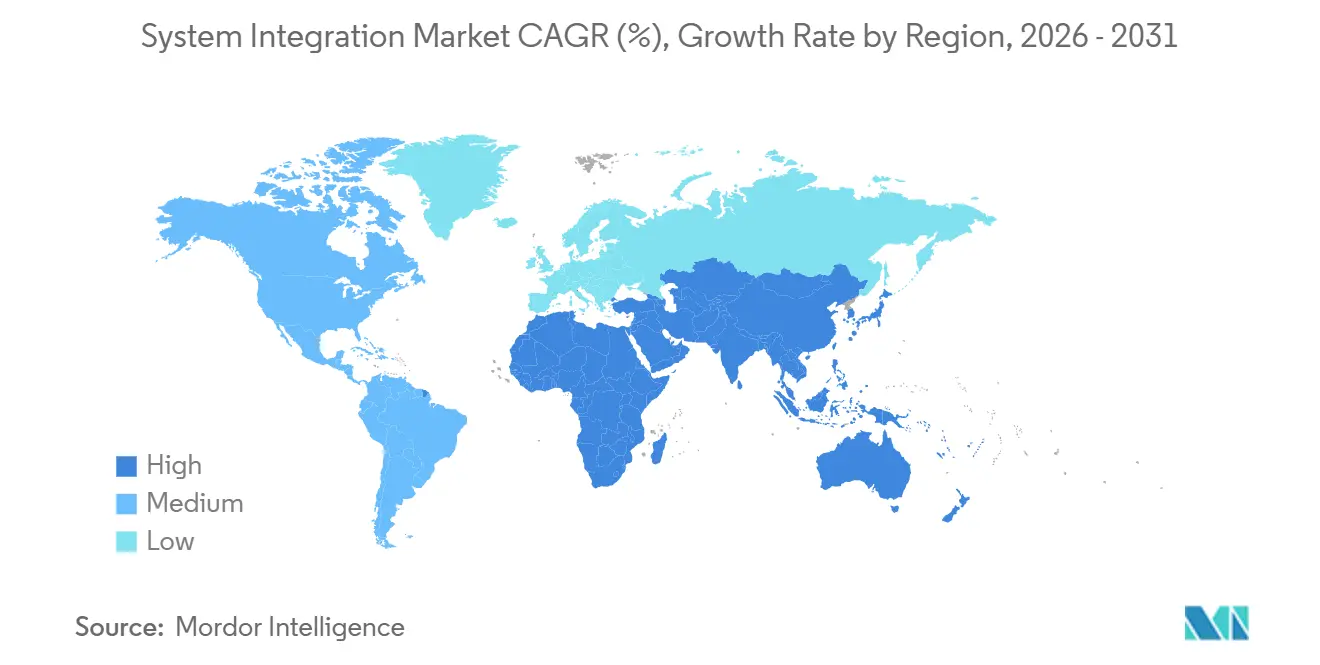
- By geography, North America dominated with a 38.91% revenue share in 2025, whereas Asia-Pacific is anticipated to register the quickest regional uptick at a 6.83% CAGR to 2031.
Note: Market size and forecast figures in this report are generated using Mordor Intelligence’s proprietary estimation framework, updated with the latest available data and insights as of 2026.
Global System Integration Market Trends and Insights
Drivers Impact Analysis*
| Driver | (~) % Impact on CAGR Forecast | Geographic Relevance | Impact Timeline |
|---|---|---|---|
| Shift to Hybrid-Multi-Cloud Integration Architectures | +1.2% | Global, concentration in North America and Europe | Medium term (2-4 years) |
| 5G and Edge-Computing Roll-Outs Demanding Low-Latency Orchestration | +0.9% | Asia-Pacific core, spill-over to North America and Middle East | Short term (≤ 2 years) |
| Rapid IT-OT Convergence in Smart Manufacturing | +1.0% | Asia-Pacific and Europe manufacturing hubs, expanding to South America | Medium term (2-4 years) |
| Cyber-Security Compliance Mandates | +0.8% | Europe and North America, influence spreading to Asia-Pacific | Short term (≤ 2 years) |
| Under-Sea Cable Upgrades Forcing Carrier-Grade Software Re-Platforming | +0.4% | Global, early impact on trans-oceanic routes | Long term (≥ 4 years) |
| AI-Driven Integration-Platform-as-Code Reducing Time-to-Value | +0.7% | North America and Europe early adopters, expanding globally | Medium term (2-4 years) |
| Source: Mordor Intelligence | |||
Shift to Hybrid-Multi-Cloud Integration Architectures
Enterprises now distribute workloads across three or more hyperscalers alongside retained on-premise estates, a pattern confirmed by a 2025 survey that found multi-cloud usage rising to 72% of large firms. Integration platforms that translate divergent APIs, identity models, and data-sovereignty constraints have therefore become strategic control planes. Financial institutions split customer data onto sovereign clouds while offloading analytics to global providers, multiplying integration touchpoints. The European Central Bank’s 2024 outsourcing guidelines require exit strategies and interoperability, further accelerating orchestration spending.[1]“Guidelines on Outsourcing to Cloud Service Providers,” European Central Bank, bankingsupervision.europa.eu Architects are pivoting toward event-driven designs and service meshes that abstract infrastructure, enabling near-real-time data fabrics across hybrid landscapes.
5G and Edge-Computing Roll-Outs Demanding Low-Latency Orchestration
Standalone 5G networks push compute to the edge, where millisecond latency budgets prohibit round-trips to central data centers. Global 5G subscriptions hit 1.9 billion in mid-2025, with network slicing creating dedicated industrial lanes.[2]“Ericsson Mobility Report,” Ericsson, ericsson.com Manufacturing plants deploy edge gateways that preprocess sensor data before syncing it with enterprise resource planning systems in the cloud. Telecom operators are re-platforming operations-support systems to expose 5G core APIs, driving demand for carrier-grade middleware. ITU’s IMT-2020 standards, finalized in 2024, codify ultra-reliable low-latency communication benchmarks that integration vendors must now meet. Edge-to-cloud orchestration is therefore essential for monetizing 5G investments rather than treating it as a discretionary upgrade.
Rapid IT-OT Convergence in Smart Manufacturing
Factories are linking programmable-logic controllers and supervisory-control systems to enterprise analytics, collapsing the historical divide between operational and information technology. Siemens reported 28% year-over-year growth in industrial edge and integration software orders during 2025, underscoring demand among automotive and electronics makers.[3]“Annual Report 2025,” Siemens AG, siemens.com The ISA/IEC 62443 security framework is now a baseline, pushing platforms to embed credential segregation and anomaly detection. Government programs such as Germany’s Industrie 4.0 and China’s Made in China 2025 tie subsidies to demonstrable gains in output quality and supply-chain transparency, intensifying brownfield integration projects that retrofit rather than rip-and-replace legacy automation assets.
Cyber-Security Compliance Mandates
The European Union’s NIS2 directive broadened the definition of critical infrastructure and required supply-chain reporting by October 2024, compelling integrators to automate compliance checks within middleware. Simultaneously, the United States Cybersecurity and Infrastructure Security Agency mandated software bills of materials for federal procurements, forcing vendors to expose component metadata. Oracle’s 2025 release of Integration Cloud 3.0 with auto-generated SBOMs illustrates how compliance-driven features have become a competitive differentiator. These regulations lengthen sales cycles but raise project value by blending legal oversight, audit-trail design, and continuous monitoring.
Restraints Impact Analysis*
| Restraint | (~) % Impact on CAGR Forecast | Geographic Relevance | Impact Timeline |
|---|---|---|---|
| Escalating Talent Shortage of Integration Architects | -0.9% | Global, acute in North America and Europe | Short term (≤ 2 years) |
| Cost Overruns from Technical Debt in Legacy Estates | -0.7% | North America and Europe, emerging impact in Asia-Pacific | Medium term (2-4 years) |
| Vendor-Lock-In Risk with Hyperscaler Services | -0.5% | Global, heightened in Europe | Medium term (2-4 years) |
| Rising Scope-3 ESG Reporting Burden Delaying Capex | -0.3% | Europe and North America, gradual in Asia-Pacific | Long term (≥ 4 years) |
| Source: Mordor Intelligence | |||
Escalating Talent Shortage of Integration Architects
LinkedIn recorded a 34% year-over-year increase in open integration-architect roles in 2025, yet the median time-to-fill still exceeded 60 days. Signing bonuses and equity grants inflate project budgets, while sector-specific knowledge demands narrow the candidate pool further. Offshore staffing mitigates costs in many IT domains but provides limited relief for hybrid-integration work that requires time-zone alignment with on-premises teams. Enterprises are experimenting with low-code tools to stretch scarce talent, though such platforms falter in deeply customized legacy estates. The shortage is expected to persist through 2028, capping the attainable speed of market expansion.
Cost Overruns from Technical Debt in Legacy Estates
A 2025 Deloitte survey found that 68% of large enterprises ranked technical debt as the primary obstacle to digital transformation, with integration projects averaging 23% cost overruns. Undocumented dependencies in COBOL systems complicate connections to real-time payment rails such as the FedNow service, which demands sub-second processing. Data-quality flaws surface once silos are bridged, triggering unplanned cleansing initiatives that consume budget. Fixed-price contracting shifts overrun risk to vendors, favoring large integrators with balance-sheet resilience but squeezing mid-tier specialists.
*Our forecasts treat driver/restraint impacts as directional, not additive. The impact forecasts reflect baseline growth, mix effects, and variable interactions.
Segment Analysis
By Service Type: Infrastructure Integration Holds Lead, Application Connectivity Gains Speed
Infrastructure integration accounted for 45.61% of the system integration market share in 2025, underscoring the need to orchestrate servers, storage, and networks across hybrid estates. Financial institutions and government agencies still depend on tightly controlled on-premise hubs, so revenue from cabling, virtualization, and resiliency engineering remains steady. Providers now bundle monitoring, patching, and capacity planning into outcome-based contracts, lengthening engagement tenures and smoothing revenue flow.
Application and software integration, meanwhile, is expanding at a 6.33% CAGR through 2031 as enterprises favor API-first models that decouple mobile apps and analytics from back-end cores. The pivot blurs the lines between the infrastructure and application layers because the same orchestration engines manage both Kubernetes clusters and gateway endpoints. IBM’s USD 4.6 billion acquisition of Apptio in 2023 highlighted demand for cost-governance tools that rationalize integration budgets. Vendors that can package infrastructure provisioning with application connectivity into a single managed service are capturing a growing share of the system integration market.


By Deployment Mode: On-Premise Dominates Today, Cloud Platforms Accelerate
On-premises installations accounted for 59.16% of 2025 revenue, reflecting data-sovereignty rules and the substantial installed base of middleware supporting regulated workloads. Even as they modernize edge nodes, banks and public agencies are extending capital investment cycles by favoring physical control over mission-critical integration hubs. This approach reflects their preference for maintaining direct oversight and security of critical infrastructure, ensuring reliability and minimizing potential risks associated with external dependencies.
Cloud-based integration platforms are growing at a 6.16% CAGR to 2031 as subscription pricing, auto-scaling, and continuous updates prove attractive to mid-market firms. MuleSoft reported that 64% of its new deployments were cloud-native in 2025, up from 48% two years earlier. The European Union Data Act, effective September 2025, grants enterprises data-portability rights, lowering switching costs and encouraging experimentation. Hybrid control-plane patterns, where data stays on-premises but orchestration logic runs in the cloud, now anchor many proofs of concept and expand the overall system integration market.
By End-User Industry: IT-Telecom Stays Largest, Healthcare Races Ahead
IT and telecom accounted for 27.83% of 2025 spending as carriers integrate 5G core networks, billing engines, and customer-experience stacks into carrier-grade meshes that assure five-nines availability. Deterministic orchestration, driven by constant traffic spikes and the need to meet service-level guarantees, plays a critical role in maintaining operational efficiency. This demand ensures that contract values remain high, reflecting its importance in managing complex network environments.
Healthcare and life sciences are projected to record the fastest growth, advancing at a 7.71% CAGR through 2031 on the back of U.S. interoperability mandates effective January 202. Hospitals fusing electronic health record platforms with payer portals drive specialized Fast Healthcare Interoperability Resources API work. Manufacturing, BFSI, and government remain sizable contributors, but interoperability rules and patient data exchange are placing healthcare at the forefront of new deal flow in the system integration market.
By Integration Type: Data Workloads Dominate, API Traffic Surges
Data integration accounted for 33.74% of 2025 revenue, reflecting enduring demand for extract-transform-load pipelines, data virtualization, and master data management that feed analytics and AI engines. Enterprises consolidating data lakes continue to prioritize reliability and lineage tooling, recognizing these as essential components for maintaining data integrity and traceability. As a result, investment in this area remains steadfast and resilient.
Application and API integration is rising at a 6.52% CAGR through 2031 as microservices replace monolithic enterprise service buses. Red Hat logged a 41% increase in OpenShift Service Mesh adoption in 2025, underscoring the appetite for encrypted service-to-service traffic shaping in container estates. Unified platforms that support data, API, and event patterns now reduce tool sprawl, making holistic stacks a must-have for buyers seeking to optimize the system integration market.
By Organization Size: Large Enterprises Anchor Demand, SMEs Close Gaps
In 2025, large enterprises dominated the revenue landscape, contributing 62.46%. Their sprawling global estates and stringent audit requirements necessitate top-tier orchestration, governance, and support. Accenture, IBM, and Tata Consultancy Services have solidified their status as leading vendors, playing a pivotal role in driving multi-year transformations across numerous systems. These companies leverage their expertise to deliver comprehensive solutions, enabling businesses to modernize operations and achieve strategic objectives effectively.
Meanwhile, small and medium enterprises (SMEs) are on an upward trajectory, projected to grow at a 6.19% CAGR. This surge is largely attributed to the rise of low-code tools, which are democratizing connectivity. Companies like Workato and Zapier are at the forefront, offering visual designers and pre-built connectors that significantly reduce development cycles. Furthermore, cloud event buses, notably AWS EventBridge, are enabling SMEs to bypass traditional legacy middleware. This leap not only narrows existing capability gaps but also broadens the addressable market within the expansive system integration industry.
Geography Analysis
In 2025, North America commanded a dominant 38.91% share of the system integration market, driven by federal zero-trust mandates and a push for banking modernization. The U.S. Office of Management and Budget emphasizes identity-centric controls, relying on detailed policy enforcement across hybrid environments. Meanwhile, Canadian companies are aligning their privacy frameworks with those of their cross-border counterparts.
Asia-Pacific is projected to grow at a 6.83% CAGR through 2031, the fastest among regions. China’s New Infrastructure program funds 5G, the industrial internet, and data-center builds, all of which require robust orchestration. India’s Unified Payments Interface processed 11.4 billion transactions in December 2025, showcasing the scale of real-time integration workloads. Japan and South Korea accelerate smart-factory and autonomous-vehicle ecosystems, each adding edge-to-cloud complexity.
Europe contributes steady growth driven by the Digital Operational Resilience Act and NIS2, which together enforce documentation, incident reporting, and third-party risk testing. Germany spearheads IT-OT convergence in automotive and machinery, France expands open-banking APIs, and the United Kingdom navigates post-Brexit divergence that elevates cross-border orchestration costs. South America, the Middle East, and Africa remain smaller slices, yet smart-city and energy-grid projects in Brazil, the United Arab Emirates, and Saudi Arabia steadily expand the global system integration market.
Mordor Intelligence provides coverage of the system integration market across other key regional markets. Detailed country-level analysis extends to Australia and Singapore incorporating local coverage and market participation, as required.

Regulatory Landscape
System integration programs are increasingly shaped by rules that require interoperability, traceability, and third-party risk controls across hybrid environments. In Europe, enforcement has moved from framework-setting to supervision and specification, including the European Commission’s 2026 Digital Markets Act (DMA) review and implementation reporting that addressed interoperability topics such as connected-device requirements for Apple, which reinforces the need for integrators to operationalize API-level interoperability and governance across ecosystems.
Cyber-resilience and telecom security scrutiny also affect integration scope and delivery models, especially where workloads touch regulated communications networks and critical services. In the United States, Federal Communications Commission actions in 2026, including national-security related telecom-service authorization decisions, point to a compliance burden around vendor provenance, network access, and auditability that system integrators must build into design, procurement, and managed operations across multi-vendor environments.
Value Chain Analysis
The value chain runs from strategy and architecture advisory through solution design, platform and connector selection, implementation, testing, and long-term managed services. Inputs include hyperscaler services and marketplaces (cloud integration, eventing, identity), enterprise application and database platforms (ERP/CRM/HCM), integration tooling (API management, iPaaS, service mesh, and data ingestion/ETL), cybersecurity controls (SBOM, zero-trust, logging), and edge/IoT gateways for IT-OT convergence. Delivery is carried out by global SIs, regional integrators, and specialist boutiques, typically with program governance and compliance documentation.
Bottlenecks center on integration-architect capacity, dependency mapping in legacy estates, and the physical infrastructure behind high-throughput workloads (data center interconnect and optical connectivity). Partnerships and ecosystems increasingly shape access to enabling infrastructure and platforms, as shown by 3M’s July 2026 strategic partnership with Microsoft to deploy optical connectivity technology within Azure infrastructure, alongside use of Microsoft AI for enterprise transformation. This highlights how integrators coordinate across cloud, hardware connectivity, and software layers to deliver end-to-end outcomes.
Competitive Landscape
In 2025, the top 10 suppliers commanded about 40% of the global revenue, showcasing a moderate concentration yet allowing space for regional specialists. Accenture, IBM, and Tata Consultancy Services harness global delivery centers and industry accelerators to clinch multi-year transformation deals. Meanwhile, hyperscalers integrate native connectors, not only compressing middleware margins but also broadening total workloads.
Oracle and SAP protect their enterprise resource planning franchises by bundling connectors and event streams within their application suites, appealing to clients who want single-vendor accountability. MuleSoft, Red Hat, and EPAM Systems carve profitable niches in API management, service meshes, and nearshore agile delivery. Cisco and Siemens formed a 2024 partnership to ship pre-integrated networking and industrial-automation bundles, illustrating a trend toward verticalized, ready-made blueprints.
Competitive differentiation increasingly hinges on AI-assisted mapping, compliance-as-code, and edge-native orchestration. Cognizant’s USD 300 million pledge to co-build Google Cloud accelerators in 2025 exemplifies investment aimed at shortening time-to-value. Vendors able to balance proprietary value with open-source interoperability are best positioned to capture incremental share as the system integration market evolves.
System Integration Industry Leaders
Accenture plc
IBM Corporation
Tata Consultancy Services Limited
Oracle Corporation
BAE Systems plc
- *Disclaimer: Major Players sorted in no particular order

Market Opportunities and Future Outlook
Compliance-driven integration is a recurring source of higher-value work where buyers need auditability, software-component transparency, and controlled interoperability across suppliers and platforms. European triggers include NIS2 obligations (with many requirements tied to October 2024 deadlines) and the EU Data Act effective in September 2025, both of which increase demand for integration patterns that support data portability, governed API exposure, and exit-ready architectures across multi-cloud and on-premise deployments.
Event-driven data fabrics, streaming, and edge-to-cloud orchestration are widening whitespace, particularly in telecom and IT-OT environments where latency and synchronization requirements are tightening. Industry moves such as IBM’s completion of the Confluent acquisition in March 2026 and its earlier July 2024 completion of StreamSets and webMethods integration assets indicate continued emphasis on real-time data movement and integration tooling, creating more platform-centric engagement models for integrators. Alongside this, AI-era infrastructure build-outs, including large 2026 semiconductor and data-center investments (for example, Intel’s announced EUR 5 billion investment at Leixlip), reinforce demand for integration across compute, data, security controls, and operational workflows as enterprises scale AI-enabled services across distributed environments.
Recent Industry Developments
- June 2026: Accenture announced a strategic investment in AlphaSense through Accenture Ventures and formed a partnership to bring AI-powered market intelligence into enterprise workflows. The move strengthens Accenture’s agentic-AI delivery by integrating external intelligence signals into decision and operations systems that typically require complex data, API, and governance integration.
- March 2026: IBM completed the acquisition of Confluent for about USD 11 billion to expand real-time data streaming capabilities across its AI and automation portfolio. The transaction increases the strategic importance of streaming-led architectures in integration programs, as enterprises connect event data to applications, analytics, and AI agents with tighter latency and governance requirements.
- July 2024: IBM completed the acquisition of StreamSets and webMethods from Software AG to bolster data ingestion, integration, and API management capabilities. This added tooling depth for modernization engagements that replace brittle point-to-point connections with governed integration platforms spanning on-premise and cloud environments.


Research Methodology Framework and Report Scope
Market Definition and Coverage
For this study, the system integration market is defined as revenue earned from planning, designing, building, connecting, and testing multi-vendor IT and OT systems so they work as one solution for an end customer.
Scope exclusions: We exclude pure software license revenue and standalone IT staffing that is not sold as an integration project or integration-led managed service.
Segmentation Overview
- By Service Type
- Infrastructure Integration
- Application and Software Integration
- Consulting and Advisory
- By Deployment Mode
- On-Premise
- Cloud
- By End-User Industry
- IT and Telecom
- BFSI
- Healthcare and Life Sciences
- Manufacturing
- Government and Utilities
- Energy and Oil and Gas
- Retail and E-Commerce
- Aerospace and Defense
- Automotive
- Other End-User Industries
- By Integration Type
- Data Integration
- Process / Workflow Integration
- Application / API Integration
- Device / IoT Integration
- By Organization Size
- Large Enterprises
- Small and Medium Enterprises
- By Geography
- North America
- United States
- Canada
- Mexico
- South America
- Brazil
- Argentina
- Rest of South America
- Europe
- United Kingdom
- Germany
- France
- Italy
- Rest of Europe
- Asia Pacific
- China
- Japan
- India
- South Korea
- Rest of Asia Pacific
- Middle East and Africa
- Middle East
- United Arab Emirates
- Saudi Arabia
- Rest of Middle East
- Africa
- South Africa
- Egypt
- Rest of Africa
- Middle East
- North America
Data Sources, Market Sizing, and Validation
Desk Research
Desk research starts with pinning down the demand pool and the supply landscape, and then mapping how integration revenue typically shows up in public records. We referenced public sources such as the US Bureau of Labor Statistics, US Census trade data, Eurostat, OECD digital economy statistics, and ITU indicators to understand enterprise technology spend signals and regional adoption patterns.
To translate those signals into a market model, we also used company annual reports, 10-K style filings, investor presentations, contract announcements, and credible association or standards-body publications (such as ISO and NIST guidance) to clarify which activities are treated as integration versus adjacent services. Where needed, paid subscriptions were used for company financials and intelligence, patent databases, shipment-level import and export checks for selected hardware-heavy programs, and global contracts and tenders to validate deal flow. The sources listed here are illustrative only, and we used additional public and paid references to collect, cross-check, and clarify data points during analysis.
Primary Interviews and Surveys
Primary work was used to test what is really being billed as system integration across industries and geographies, since labels can vary by contract language. We spoke with delivery leaders, sales and bid teams, customer IT heads, and procurement contacts to confirm service scope, typical project sizing, pricing levers, and the mix shift between one-time integration and integration-led managed services across major regions.
Distribution of primary research fieldwork respondents
| Company type | Respondent position | Region |
|---|---|---|
| Top tier: 32% | CXOs: 14% | APAC: 41% |
| Mid tier: 52% | Functional/Unit leaders: 35% | EMEA: 34% |
| Smaller Players: 16% | Managers: 51% | Americas: 25% |
Market-Sizing & Forecasting
Sizing was built using a top-down and bottom-up approach, with the main totals reconstructed from enterprise technology spending signals and then filtered into integration-addressable work by region and industry. In practice, the top-down build uses adoption and spend indicators to estimate integration intensity, and then splits the pool by common delivery types such as application integration, infrastructure integration, and OT-IT integration where applicable.
To keep the totals realistic, we corroborated results with selective bottom-up checks like sampled project values by integration type, typical billed rates for key roles, and channel checks on large contract awards, and then adjusted the model where a clear gap showed up. Inputs that were watched closely include large-enterprise IT services spend direction, cloud migration and hybrid estate penetration, cybersecurity and compliance program intensity, manufacturing and utilities automation rollouts, and multi-year managed services attach rates, which together influence both volumes and pricing. For forecasting, scenario analysis was used because demand is heavily tied to macro budgets and program timing, and the scenarios were anchored in what interviewees expect for large transformation cycles, renewal behavior, and price progression. When bottom-up visibility was thin in smaller countries or niche verticals, we used proxy ratios from comparable markets and validated them through follow-up calls before finalizing.
Data Validation & Update Cycle
Outputs were validated through triangulation across independent signals, and then reviewed for unusual jumps by geography, industry, and service category. We run variance checks against known deal flow patterns, public spend indicators, and company-level revenue disclosures to make sure growth rates do not drift away from observable demand.
Before sign-off, the model and assumptions go through a multi-step analyst review where outliers are investigated, and if needed experts are re-contacted to clarify the reason for a mismatch. The report is refreshed annually, and interim updates are made when major events materially change budgets, sourcing patterns, or regulatory requirements. Right before delivery, a final review pass is completed so the numbers reflect the latest available information.
Mordor Intelligence's Global System Integration Market Estimate Compared With Other Published Estimates
Published market sizes for system integration often vary because the service lines sit close to consulting, outsourcing, and product-led deployments, so different studies draw the line in different places. Differences also come from the year used as the starting point, how multi-year contracts are recognized, and whether estimates are updated after large budget shifts.
A common gap driver is scope, where some figures fold in broad IT services that are not integration-led, or they include software and cloud resale that is booked as product revenue. Another gap shows up in pricing and volume logic, since some estimates apply a uniform growth rate to a single IT spend series, while others model project mix changes like cloud-to-hybrid integration, OT-IT programs, and managed services attach rates. The table highlights this spread, and the tighter total comes from counting only integration-delivered services and validating the split using tender signals and service mix checks, which is how the 2026 value is constructed by Mordor Intelligence.
Benchmark comparison
| Source | Market Size | Gaps in Research Methodology |
|---|---|---|
| Mordor Intelligence | USD 49.62 B (2026) | |
| Global Consultancy A | USD 58.90 B (2026) | Uses a wider IT services scope that blends integration with consulting and outsourcing, and applies higher assumed managed services penetration without consistent contract-level validation. |
| Industry Association B | USD 44.30 B (2025) | Anchors the value to a different base year and relies on member-reported activity that can undercount non-member revenues and large multi-region programs booked through global delivery centers. |
Looking across the three figures, most of the difference is explained by what gets counted as integration revenue and how service mix is translated into pricing over time. By keeping the inclusion rules tied to integration-led delivery and rechecking assumptions against multiple demand signals, the resulting number stays easier to trace and repeat when the model is updated.


Key Questions Answered in the Report
How fast is spending on hybrid-cloud system integration expected to grow?
Expenditure on cloud-based integration platforms is projected to rise at a 6.16% CAGR between 2026 and 2031, outpacing on-premise investments.
Which industry vertical will add the most new integration spending through 2031?
Healthcare and life sciences is forecast to expand integration outlays at a 7.71% CAGR as interoperability mandates drive electronic health record consolidation.
Why do enterprises cite talent as a bottleneck for integration projects?
Open roles for integration architects grew 34% year-over-year in 2025, and median hiring cycles exceeded 60 days, pushing project costs higher and extending timelines.
What is the largest regional market for system integration today?
North America leads with 38.91% of 2025 revenue, supported by zero-trust mandates and rapid financial-services modernization.
How are hyperscalers influencing competition among integration vendors?
Cloud providers embed native orchestration services that compress middleware license margins, compelling traditional vendors to differentiate through compliance features and multi-vendor governance capabilities.
Page last updated on:






