
Synchronous Motor Market Size and Share
Market Overview
| Study Period | 2020 - 2031 |
|---|---|
| Market Size (2026) | USD 25.82 Billion |
| Market Size (2031) | USD 31.06 Billion |
| Growth Rate (2026 - 2031) | 3.76% CAGR |
| Fastest Growing Market | Asia-Pacific |
| Largest Market | Asia Pacific |
| Market Concentration | Medium |
Major Players *Disclaimer: Major Players sorted in no particular order Image © Mordor Intelligence. Reuse requires attribution under CC BY 4.0. | |
Synchronous Motor Market Analysis by Mordor Intelligence
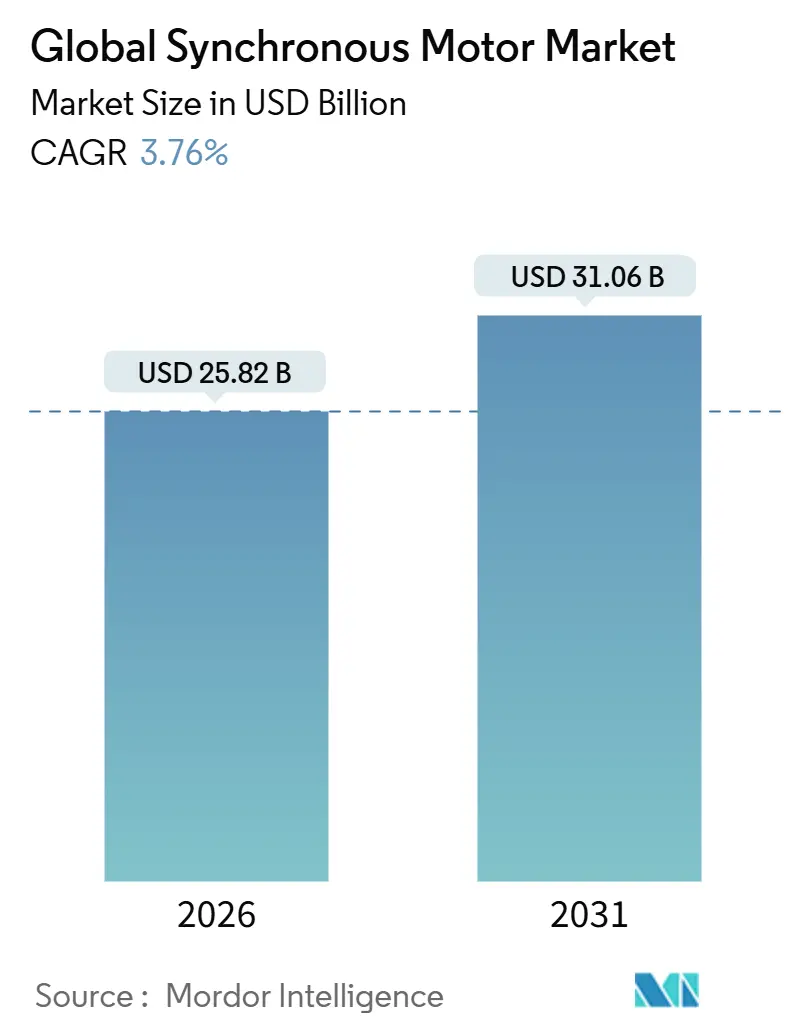
The synchronous motor market size stood at USD 25.82 billion in 2026 and is projected to reach USD 31.06 billion by 2031, reflecting a 3.76% CAGR across the forecast horizon. Demand is pivoting from rare-earth permanent-magnet rotors toward reluctance-based alternatives, while traction and propulsion requirements are reshaping power-rating preferences in the synchronous motor market. Regulatory efficiency mandates, the electrification of transport, and distributed manufacturing are widening the addressable opportunity, but supply-chain turbulence for rare earths and thermal-management limits temper short-term adoption curves. Market participants continue to divest low-margin induction portfolios and consolidate intellectual property around synchronous technologies, positioning themselves to capitalize on efficiency-driven retrofit cycles and greenfield renewable-energy investments. With Asia-Pacific enforcing stricter performance standards and serving as both a manufacturing hub and an end-use center, regional dynamics will heavily influence competitive strategy in the synchronous motor market.
Key Report Takeaways
- By rotor construction, permanent-magnet designs led with 47.80% revenue share in 2025, while reluctance variants are poised for an 11.80% CAGR to 2031.
- By power rating, the 1-10 megawatt tier captured 38.50% of synchronous motor market share in 2025, yet the sub-1 megawatt tier is forecast to expand at a 10.40% CAGR.
- By end-user industry, oil and gas held 24.30% of 2025 revenue, whereas electric-vehicle OEM demand is projected to rise at a 13.50% CAGR through 2031.
- By application, pumps accounted for 29.10% of 2025 installations, but traction and propulsion uses are advancing at a 14.20% CAGR.
- By geography, Asia-Pacific commanded 34.80% of 2025 revenue, and it is expected to maintain the fastest regional growth at 12.10% annually.
Note: Market size and forecast figures in this report are generated using Mordor Intelligence’s proprietary estimation framework, updated with the latest available data and insights as of January 2026.
Global Synchronous Motor Market Trends and Insights
Drivers Impact Analysis*
| Driver | (~) % Impact on CAGR Forecast | Geographic Relevance | Impact Timeline |
|---|---|---|---|
| Stringent IE3/IE4 Energy-Efficiency Mandates | +1.2% | Global, with early enforcement in EU, China, and select US states | Medium term (2-4 years) |
| Expansion of HVAC and Industrial Automation | +0.9% | North America, Europe, Asia-Pacific industrial corridors | Medium term (2-4 years) |
| Surge in Electric Vehicle and Traction Motor Demand | +1.5% | Asia-Pacific core, spill-over to North America and Europe | Long term (≥ 4 years) |
| Grid-Scale Renewable Projects, Hydro-Pumped Storage | +0.7% | Europe, China, India, select Middle East markets | Long term (≥ 4 years) |
| Rare-Earth-Free Synchronous Reluctance Motor Adoption Momentum | +1.1% | Global, concentrated in Europe and Asia-Pacific | Medium term (2-4 years) |
| High-Speed Magnetic Bearing Micro-Turbines | +0.3% | North America, Europe, Japan | Long term (≥ 4 years) |
| Source: Mordor Intelligence | |||
Stringent IE3/IE4 Energy-Efficiency Mandates
Efficiency regulations anchored in IEC 60034-30-1 and codified into European Union Ecodesign Regulation 2019/1781 have tightened procurement specifications, pushing buyers toward synchronous technologies that readily achieve IE4 and IE5 grades without copper-rotor complexity[1]Source: International Electrotechnical Commission, “IEC 60034-30-1: Efficiency Classes of Line Operated AC Motors,” IEC.CH. China enacted a parallel leap under GB 18613-2020 during 2025, spurring local OEM capacity expansions and accelerating the replacement of legacy induction stock[2]Source: ABB Ltd., “ABB Expands IE5 SynRM Motor Production to Meet Growing Demand,” ABB.COM . Utility and industrial operators with energy expenditures above 40% of total operating cost now see compliance-driven retrofits delivering sub-three-year paybacks, fueling recurrent upgrade cycles across water utilities and petrochemical plants. Market-wide, these mandates lift the synchronous motor market by expanding both baseline volumes and premium-efficiency price points.
Expansion of HVAC and Industrial Automation
Building-code revisions such as ASHRAE Standard 90.1-2022 compel variable-speed control on motors above 10 horsepower, positioning synchronous motors as the preferred choice for rooftop units and chillers that run at part-load most of the year. Equipment launched by Danfoss and Trane in 2025 integrates synchronous reluctance rotors with intelligent drives, documenting 15%–25% electricity savings in field pilots. Parallel gains in factory automation emerge through servo-grade synchronous motors that enable rapid acceleration, regenerative braking, and predictive health analytics via edge-connected drives like Siemens Sinamics S210. These combined HVAC and automation pull-through effects widen the synchronous motor market footprint in both commercial buildings and discrete manufacturing.
Surge in Electric Vehicle and Traction Motor Demand
Automotive electrification is the fastest-growing vector, elevating propulsion-specific design requirements in the synchronous motor market. BorgWarner’s 800-volt permanent-magnet traction platform, awarded by a top Chinese automaker in 2024, typifies the move toward higher-voltage stacks that slim copper cross-sections and enable rapid charging. Concurrently, IEEE-published studies confirm that ferrite-assisted synchronous reluctance rotors achieve 92%-plus drive-cycle efficiency, removing rare-earth constraints without ceding performance. NASA’s 2025 validation of SynRM for regional e-aircraft underscores cross-sector synergies that accelerate R&D investments and volume scaling. As electric vehicles, rail, and marine applications align around high-torque, low-weight architectures, they create multi-year ordering visibility and raise the design-complexity barriers for new entrants.
Rare-Earth-Free Synchronous Reluctance Motor Momentum
Chinese export controls on neodymium and dysprosium compounds tightened in 2024, triggering material-cost spikes and extended lead times that eroded the cost advantage of permanent-magnet machines. European Parliament assessments flagged rare-earth dependence as a strategic vulnerability, promoting investment in ferrite-based or magnet-free rotors. ABB and WEG responded by scaling IE5-rated synchronous reluctance lines across Finland, India, and Brazil, with ABB investing INR 140 crore (USD 17 million) in 2025 capacity. Adoption momentum now spans pumps, fans, and compressors where reluctance rotors offer quick procurement and stable pricing, sustaining double-digit growth inside the synchronous motor market.
Restraints Impact Analysis*
| Restraint | (~) % Impact on CAGR Forecast | Geographic Relevance | Impact Timeline |
|---|---|---|---|
| High Up-Front Cost of Permanent-Magnet Rotors | -0.8% | Global, acute in price-sensitive emerging markets | Short term (≤ 2 years) |
| Rare-Earth Supply Volatility | -0.6% | Global, concentrated in Asia-Pacific and Europe | Medium term (2-4 years) |
| Thermal-Management Limits at High Power Density | -0.4% | Global, critical in EV and aerospace traction applications | Long term (≥ 4 years) |
| Induction-VFD Efficiency Parity Pressure | -0.5% | North America, Europe, select Asia-Pacific markets | Medium term (2-4 years) |
| Source: Mordor Intelligence | |||
High Up-Front Cost of Permanent-Magnet Rotors
Permanent-magnet synchronous units carry a 20%–40% price premium over induction counterparts, magnified in emerging markets where capital budgets are tight, and payback expectations hover under three years[3]Source: London Metal Exchange, “Rare Earth Prices,” LME.COM. Volatile spot prices for neodymium-praseodymium oxide, ranging from USD 48,000–68,000 per metric ton in 2025, translate into USD 8–12 per kilogram of sintered magnet and elevate bill-of-materials costs for every high-end motor. Municipal utilities and small manufacturers therefore defer replacements despite long-run energy savings, slowing near-term volume expansion in the synchronous motor market.
Rare-Earth Supply Volatility
Export-license regimes enacted by China in 2024 introduced supply-chain uncertainty for neodymium, dysprosium, and terbium, pressuring motor OEMs reliant on these inputs. The European Critical Raw Materials Act sets ambitious diversification targets, yet few mining projects have reached scale, keeping supply tight and prices erratic. While this volatility accelerates the pivot to reluctance architectures, the interim redesign costs and performance compromises weigh on profitability and adoption timing within the synchronous motor market.
*Our forecasts treat driver/restraint impacts as directional, not additive. The impact forecasts reflect baseline growth, mix effects, and variable interactions.
Segment Analysis
By Rotor Construction: Reluctance Designs Accelerate Amid Supply-Chain Hedging
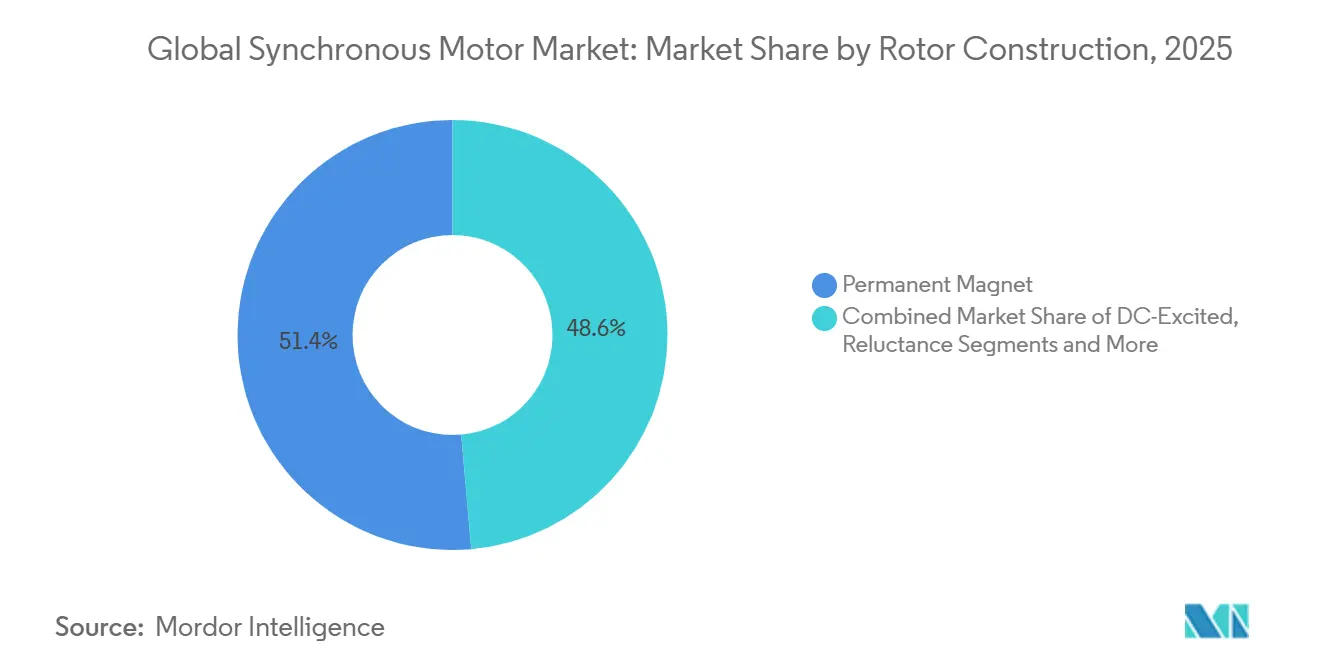
Permanent-magnet rotors retained 47.80% share of 2025 revenue, anchoring high-torque and traction roles where their density justifies cost. However, reluctance designs are forecast to grow at an 11.80% CAGR, driven by ABB’s IE5 and forthcoming IE6 lines and WEG’s 2025-launched W50 platform, which incorporates Regal Rexnord intellectual property. Europe’s regulatory push toward IE5, combined with the scarcity of rare earths, is driving demand for magnet-free or ferrite-assisted options in pumps, fans, and compressors. DC-excited machines remain relevant in hydro-pumped storage and marine propulsion because their field-winding flexibility provides reactive power and voltage support. Hysteresis rotors remain niche, serving precision lab equipment and timing devices where ultra-smooth torque is prized.
Reluctance adoption momentum is especially sharp in Asia-Pacific and Europe, where OEMs report reduced lead times and 20%-plus unit-cost savings versus permanent-magnet equivalents. IEEE research during 2024 confirmed ferrite-assisted synchronous reluctance efficiencies topping 94%, narrowing any practical gulf with neodymium designs and slicing material costs by about one-third. As traction vehicles, HVAC OEMs, and food processors validate these systems, rotor-type balances will realign by 2031, driving fresh competition and technical road-maps inside the synchronous motor market.


By Power Rating: Sub-Megawatt Growth Signals Distributed Adoption
The 1-10 megawatt band dominated with 38.50% of 2025 installations, aligning with centrifugal compressors, chiller drives, and mid-scale industrial automation projects. Yet the sub-1 megawatt class is projected to post a 10.40% CAGR, fueled by distributed manufacturing, modular water treatment, and food processing upgrades, where right-sizing motors trims energy waste. Schneider Electric’s 2024 Altivar Process drive, coupled with 0.75–500 kilowatt synchronous motors, brings cloud-based predictive analytics that help plant managers slash downtime.
Industrial users participating in the United States Better Buildings Initiative logged 15%–30% power savings when oversized induction units were swapped for optimized synchronous machines, with rebate programs pulling payback under two years. While motors exceeding 10 megawatts stay entrenched in wind turbines and large hydro units, the swelling sub-megawatt base indicates that small-horsepower innovation will underpin the next leg of expansion for the synchronous motor market size.
By End-User Industry: EV OEMs Overtake Traditional Heavy Industry Momentum
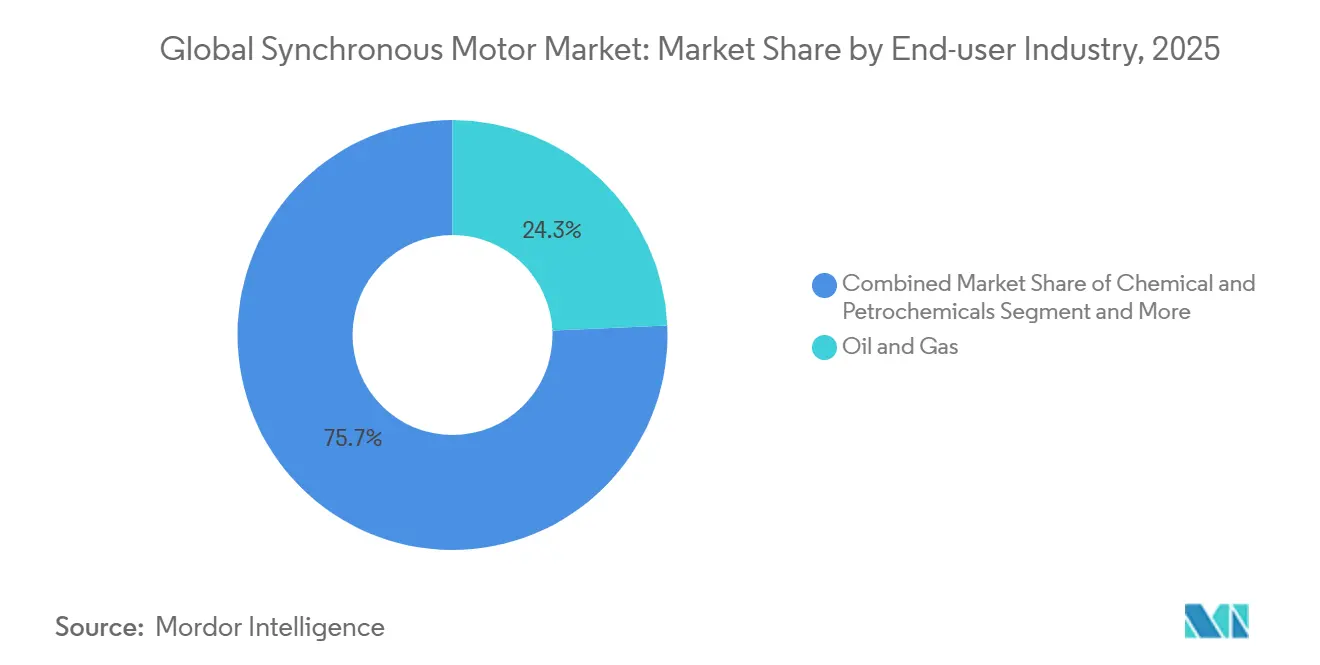
Oil and gas held 24.30% of 2025 demand, sustained by compressor and pump fleets along pipelines and liquefied natural-gas plants. Electric-vehicle OEMs, however, represent the fastest rising customer pool with a 13.50% CAGR, mirroring global passenger-EV penetration and 800-volt drivetrain architectures. Chemicals, water utilities, and metals together comprise roughly one-third of revenue, exploiting variable-speed synchronous motors for agitators, blowers, and grinding mills.
Food and beverage plants increasingly specify stainless-steel IP-rated synchronous units for hygienic conveyors and refrigeration compressors. Discrete manufacturing, especially automotive and electronics assembly, deploys servo-grade synchronous motors across robotic arms and CNC stages, guided by Mitsubishi Electric and Yaskawa control ecosystems. This diverse uptake underscores that the synchronous motor market is no longer monolithic, but rather a mosaic of high-growth e-mobility users and steady-state industrial stalwarts.
By Application: Traction and Propulsion Outpace Stationary Loads
Pumps remained the largest slice at 29.10% in 2025, reflecting massive installed bases in water utilities and chemical processing. Yet traction and propulsion applications are accelerating at a 14.20% CAGR, driven by electric cars, e-buses, rail, and marine electrification. Siemens Mobility’s Velaro Novo high-speed train employs permanent-magnet drives that cut traction power by 30% while retrieving up to 15% energy during braking. Fans, blowers, compressors, and material-handling equipment together anchor roughly half of total installations.
Marine adopters favor synchronous podded drives for cruise ships and ferries, citing tighter maneuverability and silent operation advantages. As mobile use cases spread, rotor topology, cooling systems, and integration software are tuned for lighter, thermally-efficient assemblies, further diversifying the synchronous motor market.
Geography Analysis
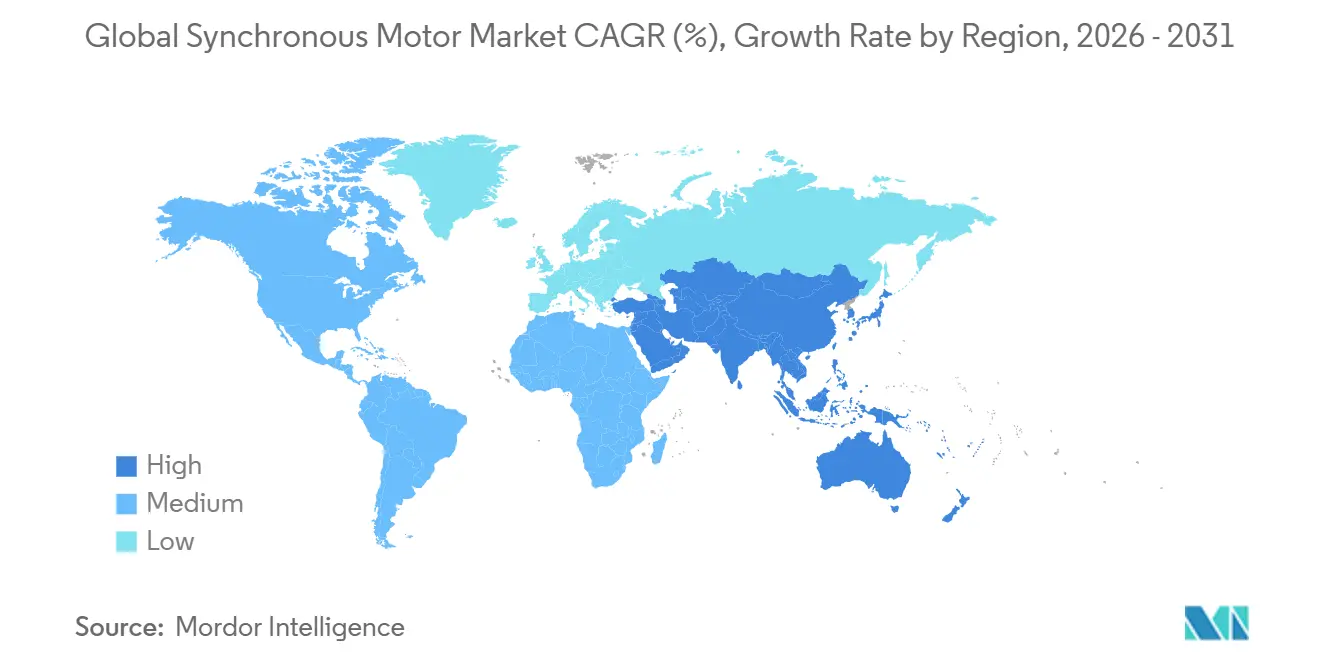
Asia-Pacific, holding 34.80% of 2025 revenue, is on track for a 12.10% CAGR through 2031 as China, India, and Southeast Asian nations raise minimum efficiency thresholds and expand factory automation. Chinese producers such as Wolong Electric funneled CNY 500 million (USD 70 million) into Zhejiang facilities in 2025 to scale IE3 and above units, while India’s Production-Linked Incentive scheme spurred Kirloskar Electric’s new Maharashtra plant capable of 50,000 high-efficiency motors annually. Japan’s Nidec posted 18% synchronous revenue growth in fiscal 2024, benefitting from traction-motor design wins in China and Europe.
North America and Europe combined to capture about 45% of 2025 value. In the United States, Industrial Assessment Centers documented that motor-system upgrades accounted for 22% of recommended efficiency projects, with synchronous equipment specified in more than one-third of replacements. Europe’s Green Deal Industrial Plan earmarked EUR 3 billion (USD 3.3 billion) to back domestic clean-tech manufacturing, financing new motor lines in Poland and Spain. The Middle East pursues large synchronous pump motors for desalination, yet regional share stays below 5%.
South America centers on Brazil, where WEG’s Jaraguá do Sul complex produced more than two million units in 2024, increasingly synchronous as energy costs bite. African demand skews toward mining clusters in South Africa and the Copperbelt, leveraging ABB and Siemens high-horsepower solutions for grinding mills and ventilation. Across regions, the synchronous motor market tracks a two-tier pattern: mature economies retrofit for higher efficiency, while developing markets leapfrog directly to premium-grade synchronous options amid new industrialization.

Regulatory Landscape
Regulation is increasingly centered on harmonized efficiency classification and verification, with IEC 60034-30-1 (2nd edition, published 1 December 2025) serving as the primary reference point for IE-class definitions across line-operated AC motors. In the European Union, Ecodesign Regulation (EU) 2019/1781 continues to shape procurement requirements for motors and variable speed drives, and the European Commission’s ongoing evaluation and impact assessment runs from December 2024 to Spring 2027, indicating a live policy cycle rather than a static rule set.
In the United States, the Department of Energy amended energy conservation standards for Expanded Scope Electric Motors via a final rule effective 7 April 2025, with compliance required from 1 January 2029, creating a long-lead redesign and certification runway for OEMs supplying North America. DOE also issued an enforcement policy on 10 June 2026 that extends the delayed enforcement period for voluntary representations covering inverter-only, synchronous, and expanded-scope electric motors until 14 October 2026, affecting how suppliers communicate performance as test procedures and enforcement timing settle. Beyond pure energy performance, the EU policy stack is also expanding through the Ecodesign for Sustainable Products Regulation (ESPR) toward durability and recyclability criteria, increasing the importance of materials disclosure and repairability for motor platforms sold into Europe.
Value Chain Analysis
The value chain runs from upstream electrical steels and copper through precision rotor and stator component fabrication (lamination stamping, stack assembly, winding, and machining), followed by motor assembly, test and certification, and then integration into a system with drives, gearboxes, sensors/encoders, and controls. A recurring bottleneck sits at rotor lamination stamping for synchronous designs, where specialized tooling, tight tolerances, and limited supplier capacity (notably in North America) constrain responsiveness; for imported components into the United States, lead times of about 10 to 16 weeks plus an additional 2 to 4 weeks for customs and logistics raise the value of regional assembly and dual sourcing.
Downstream, demand is increasingly pulled through by integrated motor-drive packages sold via OEM channels (HVAC, pumps, compressors, automation equipment) and by EPC/utilities for grid-related synchronous applications, while service networks (spares, rewinds excluded from market sizing, condition monitoring, and energy analytics) support lifecycle value. The supplier base is also shifting with the move toward magnet-free synchronous reluctance architectures to reduce reliance on rare-earth permanent magnets, while major manufacturers broaden standardized SynRM portfolios. For example, ABB is extending its IE5-rated SynRM range across additional frame sizes and covering roughly 0.75 kW to 450 kW to simplify sourcing and accelerate retrofit deployments. For custom or safety-critical configurations, buyers increasingly lock in production slots through longer-horizon blanket purchase orders, reflecting higher engineering content and component specificity versus commodity induction motors.
Competitive Landscape
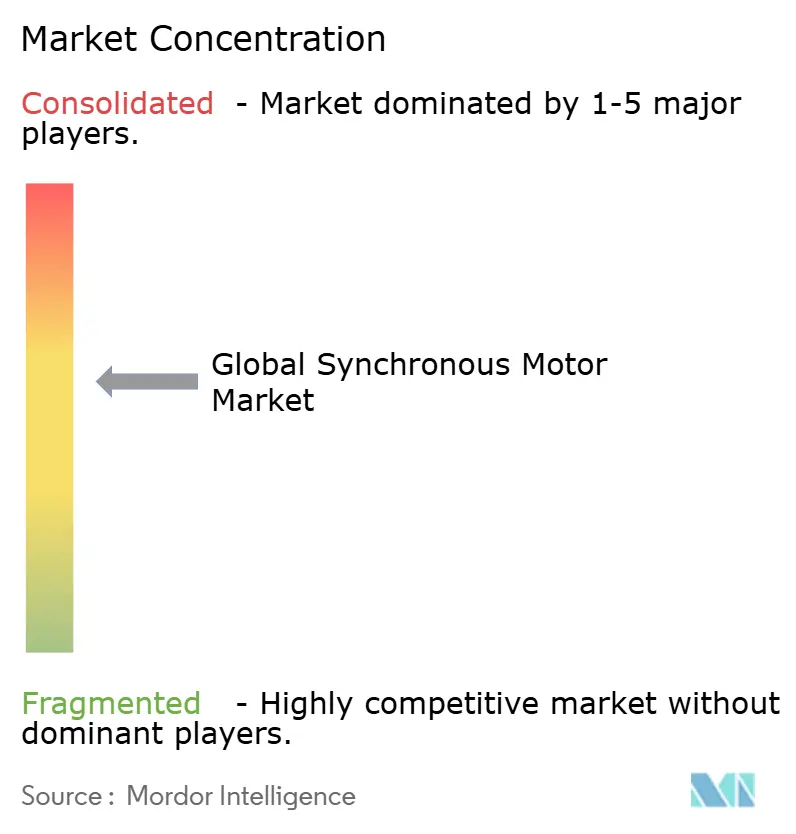
The synchronous motor market exhibits moderate concentration, with ABB, Siemens, WEG, Nidec, and Toshiba commanding an estimated 40%–45% of 2025 revenue. Vendors are differentiating through rotor technology, integrated drives, and digital-service ecosystems that embed condition monitoring and energy analytics. ABB’s 2025 rollout of expanded IE5 reluctance production across Finland, India, and China reinforces its bet on rare-earth-free platforms, while Siemens leverages its TIA Portal software stack to bind drive and automation layers together.
Mergers and acquisitions accelerate the pivot away from commoditized induction portfolios toward high-margin synchronous offerings. WEG finalized the USD 1.7 billion purchase of Regal Rexnord’s motor division in 2024, gaining reluctance IP and expanding U.S. and Mexican footprints. EBARA’s planned 2026 closure of Mitsubishi Electric’s three-phase motor business deepens integration around pump-motor packages for water utilities. Smaller specialists such as SEVA-tec and Dunkermotoren thrive in servo and micro-motor niches, offering customized rotors and embedded encoders where incumbent mass-production models lack agility.
Standards harmonization under the forthcoming IEC 60034-30-2 revision will tighten verification protocols, curbing efficiency over-statement and sharpening price-performance competition. In parallel, next-generation applications in electric aviation and high-speed micro-turbines entice both incumbents and start-ups, hinting at future market fragments that reward thermal-management and rotor-topology breakthroughs. The interplay of consolidation, R&D realignment, and regulatory scrutiny sets the stage for an increasingly innovation-driven synchronous motor market.
Synchronous Motor Industry Leaders
ABB Ltd.
Siemens AG
WEG S.A.
Nidec Corporation
Toshiba Corporation
- *Disclaimer: Major Players sorted in no particular order

Market Opportunities and Future Outlook
A near-term opportunity set is forming around ultra-premium efficiency upgrades and compliance-ready platforms as IEC 60034-30-1 (2nd edition, December 2025) and the ongoing EU Ecodesign review activity tighten scrutiny on measured performance and, increasingly, material attributes under ESPR. Product moves such as ABBs May 2026 launch of a magnet-free IE6 Hyper-Efficiency motor certified to ATEX and IECEx for hazardous areas expand the addressable footprint for synchronous reluctance motors into regulated, safety-sensitive industrial environments where standardization and certification are major adoption gates.
Grid connection and power-quality needs are also creating an adjacent growth lane for synchronous machines beyond classic drives, particularly where renewable-heavy systems and large new loads require inertia and reactive power support. ABBs June 2026 introduction of a pre-engineered, modular synchronous condenser package targeted at data center grid connection points highlights a packaged-equipment pathway that can shorten engineering cycles for utilities and hyperscalers. On the supply side, capacity and localization investments in high-voltage PMSM production add whitespace in heavy-industry and high-power duty cycles; for example, Inovance Technology commenced development in April 2026 of a new RMB 2 billion manufacturing and R&D base in Dalian for high-voltage permanent-magnet synchronous motors, signaling intensifying competition in high-power segments while also improving availability for end users pursuing direct-drive efficiency improvements.
Recent Industry Developments
- May 2026: ABB launched the first IE6 Hyper-Efficiency motor certified to ATEX and IECEx for hazardous areas (Zones 1 and 2), using magnet-free synchronous reluctance technology. The launch expands compliant options for oil and gas, chemicals, and other regulated industrial sites seeking IE6-class efficiency without rare-earth exposure. It also raises the benchmark for OEMs bundling motors with variable speed drives in hazardous-area packages.
- November 2025: EBARA announced an agreement to acquire Mitsubishi Electric’s three-phase motor operations, covering motors up to 500 kW along with associated plants and intellectual property. The transaction supports tighter pump-and-motor integration for infrastructure and water-related applications where packaged efficiency and lifecycle service are key buying criteria. It also reshapes competitive positioning in the sub-1 MW and mid-power industrial segments where Mitsubishi Electric has established footprints.
- May 2024: WEG completed the USD 1.7 billion acquisition of Regal Rexnord’s motor division, expanding its North American and Mexico manufacturing footprint and adding synchronous-related intellectual property. The deal strengthens WEG’s ability to supply a broader range of synchronous and high-efficiency motor platforms to OEM and distributor channels. It also accelerates consolidation dynamics among multi-regional suppliers as customers standardize on fewer qualified motor-drive ecosystems.


Research Methodology Framework and Report Scope
Market Definition and Coverage
We size the global synchronous motor market as the value of newly manufactured AC synchronous motors sold as complete motors, where rotor speed stays locked to supply frequency through excitation, permanent magnets, or reluctance designs.
Scope exclusions: Stand-alone synchronous condensers, stepper motors, refurbished or rewound units, and generator retrofit packages are not counted.
Segmentation Overview
- By Rotor Construction
- DC-Excited
- Permanent Magnet
- Reluctance
- Hysteresis
- By Power Rating
- ≤1 MW
- 1-10 MW
- >10 MW
- By End-User Industry
- Oil and Gas
- Chemicals and Petrochemicals
- Power Generation
- Water and Wastewater
- Metals and Mining
- Food and Beverage
- Discrete Manufacturing
- HVAC and Refrigeration
- By Application
- Pumps
- Compressors
- Fans and Blowers
- Conveyors and Hoists
- Traction/Propulsion
- Other Applications
- By Geography
- North America
- United States
- Canada
- Mexico
- Europe
- Germany
- United Kingdom
- France
- Italy
- Spain
- Russia
- Rest of Europe
- Asia-Pacific
- China
- Japan
- India
- South Korea
- Australia
- Rest of Asia-Pacific
- Middle East
- Saudi Arabia
- United Arab Emirates
- Turkey
- Rest of Middle East
- Africa
- South Africa
- Nigeria
- Rest of Africa
- South America
- Brazil
- Argentina
- Rest of South America
- North America
Data Sources, Market Sizing, and Validation
Desk Research
Desk work starts by anchoring the demand pool and the typical installation settings for synchronous motors, then we layer in pricing and shipment signals for those same end-use contexts. Public sources such as the International Energy Agency (IEA), the International Trade Centre (ITC) trade statistics portal, UN Comtrade, and the US Energy Information Administration (EIA) are used to validate industrial activity and power sector direction that tends to move motor demand.
We also pull in standards and efficiency policy references (including US Department of Energy programs and European Commission frameworks), along with technical papers from IEEE and similar journals, to sanity-check how efficiency classes and technology choices (excited, permanent magnet, or reluctance based) shift the mix over time. Company filings, investor decks, and trusted press releases are reviewed for capacity expansions, order commentary, and regional exposure, and then those inputs are cross-checked with paid subscriptions for company financials, patents, and shipment-level trade when needed. The sources listed here are illustrative, and other public and paid references were used to collect data, validate assumptions, and clarify market scope.
Primary Interviews and Surveys
Primary checks are done through expert interviews and structured surveys with motor manufacturers, component suppliers, distributors, system integrators, and end users in heavy industry and utilities, so gaps from desk findings get closed quickly. Because this is a global market, we cover demand patterns and pricing behavior across APAC, EMEA, and the Americas. After we receive consistent input from respondent groups, we adjust assumptions accordingly.
Distribution of primary research fieldwork respondents
| Company type | Respondent position | Region |
|---|---|---|
| Top tier: 37% | CXOs: 16% | APAC: 45% |
| Mid tier: 47% | Functional/Unit leaders: 29% | EMEA: 34% |
| Smaller Players: 16% | Managers: 55% | Americas: 21% |
Market-Sizing & Forecasting
Our sizing begins with a top-down build where industrial output signals and trade flow direction are used to reconstruct addressable installed and replacement demand for AC synchronous motors across major regions. The totals are then corroborated with selective bottom-up approximations, such as sampled supplier revenue splits, channel checks on typical price bands, and a volume times ASP cross-check for common power ranges, which helps us adjust totals when a region appears overstated.
Key inputs in the model include import and export movement for electric motors categories, industrial production and mining and metals activity, power generation additions and grid capex signals, and observable shifts toward higher efficiency motor classes that can change the technology mix. Average selling price logic is built from a practical set of checks, including how ratings, duty cycles, and customization level change pricing, and then it is validated through interview feedback before finalizing the series. For forecasting, we use scenario analysis supported by expert consensus around macro indicators, capex cycles in process industries, and expected adoption of high efficiency motor solutions. When bottom-up evidence is patchy in smaller countries, we bridge gaps using region-level ratios tied to industrial activity and trade exposure, and we keep those assumptions visible for review.
Data Validation & Update Cycle
Validation is done through several passes, where model outputs are compared against independent signals such as trade direction, sector capex commentary, and regional industrial momentum, and then outliers are investigated. We also run variance checks by region and by demand driver so a single data series does not dominate the result, and then a second analyst reviews the logic and inputs before sign-off.
The report is refreshed annually, and interim updates are triggered when major events materially change prices, supply availability, or end market investment sentiment. Before delivery, we perform a fresh review pass so clients receive the most current view available at that time.
Mordor Intelligence's Global Synchronous Motor Market Size Measured Against Other Published Estimates
Published market values for synchronous motors often do not match because the included product boundaries are not identical, and pricing and refresh timing also differ. Some studies include adjacent equipment or service value, while others count only the motor, which changes the final number even if the growth narrative appears similar.
The main gap comes from whether stand-alone synchronous condensers, refurbished or rewound units, and generator retrofit work are counted, and these items are left out in Mordor Intelligence so the value tracks only newly manufactured AC synchronous motors sold as complete motors. Differences can also show up when one publisher builds ASP growth from broad inflation assumptions, while another ties pricing to rating mix and end-use duty changes, and when currency conversion is applied at different points in the year. Update cadence also matters because industrial capex and energy efficiency policy changes can shift orders quickly, and an estimate that is not refreshed after major events may lag those effects.
Benchmark comparison
| Source | Market Size | Gaps in Research Methodology |
|---|---|---|
| Mordor Intelligence | USD 25.82 B (2026) | |
| Industry Data Publisher A | USD 25.38 B (2025) | Uses a different base year and does not clearly separate new motor sales from refurbished or replacement activity, which can compress the value when pricing mix is not updated by rating and duty cycle. |
| Press Release B | USD 22.30 B (2026) | Appears to rely on a narrower end-use and product scope and may exclude parts of industrial demand, and the estimate is presented at a headline level with limited visibility into ASP logic and currency timing. |
The table indicates that much of the spread can be traced to scope handling and to how pricing and timing assumptions are applied, rather than disagreement on demand direction. By keeping the counted items tied to complete new motor shipments, and by checking the totals against trade and industry activity signals, the sizing stays traceable to inputs that a reader can follow and revisit over time.


Key Questions Answered in the Report
What was the synchronous motor market size in 2026, and how fast is it growing?
The synchronous motor market size reached USD 25.82 billion in 2026 and is forecast to grow at a 3.76% CAGR to USD 31.06 billion by 2031.
Which region leads current demand for synchronous motors?
Asia-Pacific led with 34.80% revenue share in 2025 and is expected to grow fastest at 12.10% annually through 2031.
Which rotor technology is expanding quickest?
Reluctance-based rotors are projected to register an 11.80% CAGR, outpacing permanent-magnet designs due to rare-earth supply concerns and regulatory pressure.
How are electric vehicles influencing synchronous motor demand?
Electric-vehicle OEMs form the fastest-growing end-user segment at 13.50% CAGR as they deploy high-voltage permanent-magnet and reluctance traction motors.
Page last updated on:






