| Study Period | 2017 - 2030 |
| Base Year For Estimation | 2024 |
| Forecast Data Period | 2025 - 2030 |
| Market Size (2025) | USD 60.64 Billion |
| Market Size (2030) | USD 81.88 Billion |
| CAGR (2025 - 2030) | 6.19 % |
| Market Concentration | Low |
Major Players*Disclaimer: Major Players sorted in no particular order |

Sugar Confectionery Market Analysis
The Sugar Confectionery Market size is estimated at 60.64 billion USD in 2025, and is expected to reach 81.88 billion USD by 2030, growing at a CAGR of 6.19% during the forecast period (2025-2030).
The sugar confectionery industry is experiencing significant transformation driven by evolving consumer preferences and consumption patterns. Modern consumers are increasingly incorporating candy products into their daily routines, particularly as post-meal treats and snacks. This trend is especially prominent in developed markets, where in 2022, the average American consumed approximately 34 teaspoons of sugar daily, with 10% specifically attributed to candy consumption. The integration of confectionery into celebration culture has become more pronounced, with 84% of US consumers considering candy an essential part of special celebrations and traditions.
The distribution landscape for sugar confectionery is undergoing substantial evolution, with multichannel strategies becoming increasingly important. In 2023, the industry witnessed a remarkable 37.76% growth in online retail channels compared to the previous year, highlighting the growing significance of digital commerce in candy industry sales. Traditional retail channels are adapting to changing consumer behaviors by implementing strategic product placement and offering innovative shopping experiences, with convenience stores leveraging checkout areas for impulse purchases and supermarkets expanding their product assortments to capture market share.
Product innovation in the sugar confectionery sector is increasingly focused on meeting diverse consumer preferences and health considerations. Manufacturers are developing sugar-free alternatives and incorporating functional ingredients such as vitamins, minerals, and natural fruit extracts to appeal to health-conscious consumers. The gummy format has gained particular traction among younger demographics, with 67% of US consumers aged 18-34 showing a strong preference for this category. This trend has prompted manufacturers to expand their gummy product lines with innovative flavors and functional benefits.
Regional consumption patterns reveal distinct preferences and cultural influences on confectionery consumption. In European markets, particularly Germany, confectionery has become deeply integrated into snacking habits, with 72% of German snackers consuming candy and chocolate bars on a weekly basis in 2022. The industry is responding to these regional preferences by developing market-specific products and adapting marketing strategies to align with local celebrations and traditions. Manufacturers are also focusing on seasonal offerings and special editions to capitalize on festival-driven consumption patterns across different regions.
Global Sugar Confectionery Market Trends
Impulse buying and visual appeal play a significant role in the growth of the market worldwide
- Sugar confectionery consumption around the globe is attributed to factors like traditional customs, cultural celebrations, and regular snacking among the population in particular regions. In Asia-Pacific, about 78% of consumers preferred consuming hard candies during their work and traveling period in 2022-2023.
- Under product attributes, consumers are significantly focusing on brand image. Around 70% of the total population prefers products that come with a good brand image. Packaging is considered the second most important product attribute for confectionery products, which determines the likelihood of their purchasing.
- In 2023, sugar confections witnessed a hike in their sales by 4.5% compared to 2022. The sales growth was linked to the growing consumer density for sugar confectionery with unique flavors. Under sugar confectionery, hard candy gained a significant volume of popularity in 2022 as consumers preferred them during traveling and working hours.
- Product marketing and advertisement play important roles in the consumption and selling of products. Products with labels that advertise the “immune-boosting” or “herbal” anti-oxidant benefits are being introduced more frequently. Sugar-free claims are also attracting consumer interest, with more than 40% of consumers looking for low-sugar claims when choosing new products in the global market.
Understand The Key Trends Shaping This Market
Download PDF
OTHER KEY INDUSTRY TRENDS COVERED IN THE REPORT
- Confectionery Ingredients may be hampered by the negative effects of synthetic colors and tight FDA rules for private brands
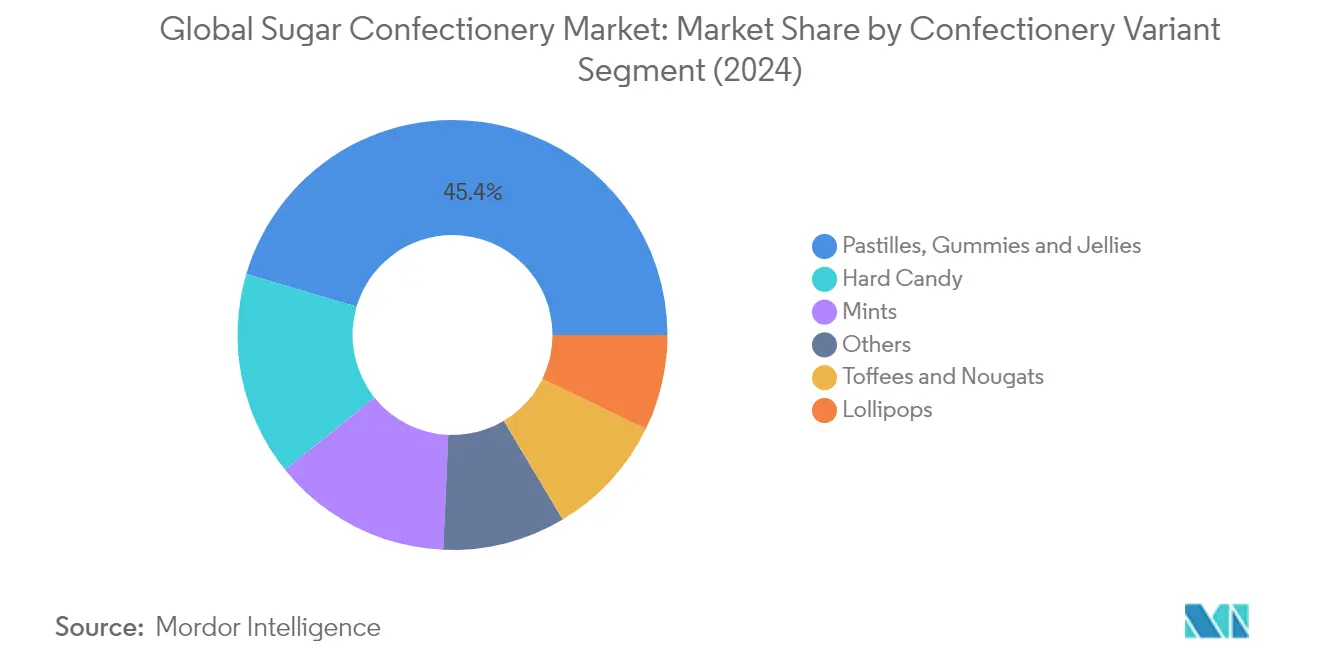
Segment Analysis: Confectionery Variant
Pastilles, Gummies, and Jellies Segment in Global Sugar Confectionery Market
The pastilles, gummies, and jellies segment dominates the global sugar confectionery market, commanding approximately 45% market share in 2024. This significant market position is primarily driven by the increasing consumer preference for diverse textures and flavors, particularly among health-conscious consumers focusing on preventive healthcare. The segment's growth is further supported by the rising demand for functional gummy candy fortified with vitamins, minerals, and natural ingredients. Major global brands like Haribo, Chupa Chups, Cloetta, and Albanese have expanded their product portfolios to include sugar-free variants and innovative formulations that cater to evolving consumer preferences. The segment's success is also attributed to the widespread availability of these products across various distribution channels and their popularity as convenient snacking options.
Pastilles, Gummies, and Jellies Segment Growth in Global Sugar Confectionery Market
As the fastest-growing segment in the global sugar confectionery market, pastilles, gummies, and jellies are projected to maintain a robust growth trajectory of approximately 6% during 2024-2029. This exceptional growth is fueled by continuous product innovations, particularly in the development of functional and fortified variants. Manufacturers are increasingly focusing on incorporating vegetable-based proteins and natural gelling agents such as starch and pectin in jellies, replacing traditional animal-based ingredients to cater to the growing vegetarian and vegan consumer base. The segment's growth is further accelerated by the rising demand for sugar-free alternatives and the increasing incorporation of natural fruit juices and functional ingredients that enhance the nutritional value of these confectionery products.
Remaining Segments in Confectionery Variant
The other segments in the sugar confectionery market, including hard candy, mints, toffees and nougats, and lollipops, each play distinct roles in shaping the overall market landscape. Hard candy maintains its position as a traditional favorite, particularly during festive seasons and celebrations. The mints segment continues to grow steadily, driven by increasing awareness of oral hygiene and fresh breath solutions. Toffees and nougats remain popular due to their indulgent nature and variety of flavor combinations, while lollipops maintain their appeal through innovative shapes, flavors, and packaging designs targeting both children and adults. These segments collectively contribute to the market's diversity and cater to different consumer preferences and occasions.
Segment Analysis: Distribution Channel
Convenience Store Segment in Global Sugar Confectionery Market
Convenience stores represent the dominant distribution channel in the global sugar confectionery market, commanding approximately 41% market share in 2024. The segment's leadership position is primarily attributed to the strategic positioning of sugar confectionery products at checkout areas, which effectively triggers impulse buying behavior among consumers. These stores have gained significant popularity due to their accessibility, being simple to enter and exit compared to larger retail formats. Their smaller size typically results in fewer shoppers and faster transactions, making them particularly attractive to time-conscious consumers. Additionally, convenience stores maintain consistent inventory levels of popular confectionery items that may not always be available at bigger box stores, further strengthening their market position.
Online Retail Store Segment in Global Sugar Confectionery Market
The online retail store segment is experiencing remarkable growth in the sugar confectionery market, projected to expand at approximately 7% CAGR from 2024 to 2029. This accelerated growth is driven by the increasing penetration of internet usage and rising adoption of e-commerce platforms worldwide. Online retailers are attracting consumers through user-friendly applications that showcase a wide variety of sugar confectionery products from leading market players. The segment's growth is further supported by the convenience of product identification through user-friendly options on shopping websites, complemented by flexible delivery and payment solutions. The rising number of smartphone users, coupled with widespread internet penetration across key regions, is anticipated to continue fostering online sales of confectionery during the forecast period.
Remaining Segments in Distribution Channel
The supermarket/hypermarket and other distribution channels continue to play vital roles in the sugar confectionery market. Supermarkets and hypermarkets maintain their significance by offering extensive product selections and the advantage of allowing consumers to physically examine products before purchase. These larger format stores typically provide loyalty benefits and regular promotional offers to retain customers. The 'Others' category, which includes specialty stores, warehouse clubs, drug stores, vending machines, forecourt retailers, and direct selling, serves specific consumer needs through various unique selling propositions such as bulk purchases, specialized product ranges, and convenient access points.
Sugar Confectionery Market Geography Segment Analysis
Sugar Confectionery Market in Africa
The African sugar confectionery market demonstrates strong regional variations in consumer preferences and consumption patterns across Egypt, Nigeria, and South Africa. The market is characterized by increasing urbanization, a growing youth population, and rising disposable incomes, which drive consumption. Traditional retail channels coexist with modern retail formats, while international brands compete with local manufacturers who understand regional taste preferences. The region shows particular strength in hard candies and toffees, with increasing demand for innovative flavors and healthier alternatives.
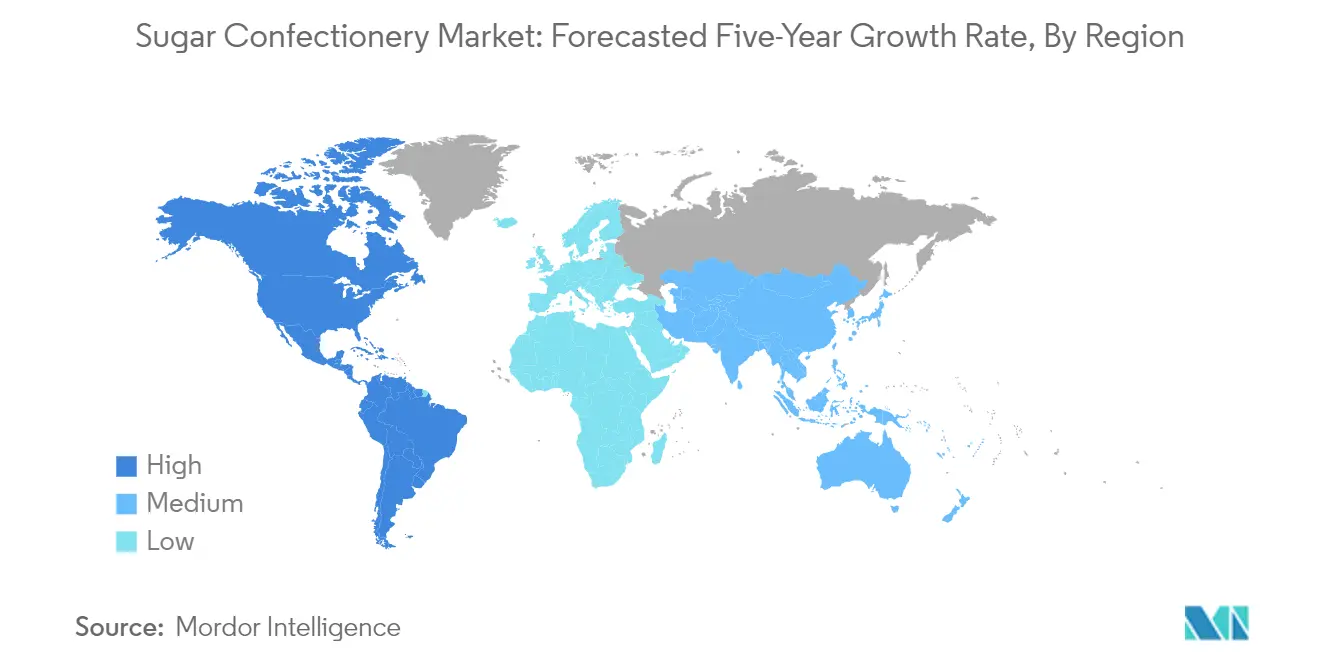
Sugar Confectionery Market in South Africa
South Africa stands as the region's largest sugar confectionery market, with approximately 25% market share in 2024. The country's market is driven by well-established distribution networks and a strong presence of both international and local manufacturers. Consumer preferences in South Africa lean heavily toward pastilles, gummies, and jellies, which have gained prominence in the health and wellness industry. The market shows particular strength in premium confectionery products, with manufacturers focusing on innovative flavors and natural ingredients to meet evolving consumer demands. Beauty gummies have emerged as a notable trend, representing a fusion of confectionery with functional confectionery benefits.
Sugar Confectionery Market in Nigeria
Nigeria emerges as Africa's fastest-growing sugar confectionery market, projected to grow at approximately 12% during 2024-2029. The country's market expansion is driven by its large youth population and increasing urbanization. Nigerian consumers show a strong preference for hard candies and lollipops, with unique local flavors gaining popularity. The market is witnessing significant innovation in product development, particularly in sugar-free variants and natural flavoring. Local manufacturers are increasingly focusing on developing products that cater to regional taste preferences while maintaining competitive pricing strategies. The growing middle class and increasing retail modernization further support market expansion.
Get Analysis on Important Geographic Markets
Download PDF
Sugar Confectionery Industry Overview
Top Companies in Sugar Confectionery Market
The global sugar confectionery market is characterized by intense competition and continuous innovation among key players. Companies, including some of the largest candy companies, are focusing on developing healthier alternatives, including sugar-free variants and natural ingredients, to meet evolving consumer preferences. Product innovation remains a crucial strategy, with manufacturers introducing unique flavors, textures, and functional ingredients like vitamins and probiotics. Operational agility is demonstrated through investments in advanced manufacturing facilities and automation to improve production efficiency. Strategic expansion moves include establishing new production facilities in emerging markets and strengthening distribution networks. Companies are also emphasizing sustainable practices, from sourcing raw materials to packaging, while simultaneously expanding their presence through both organic growth and strategic acquisitions in key markets.
Market Structure Shows Mixed Global-Local Dynamics
The sugar confectionery market exhibits a moderately fragmented structure with a mix of global conglomerates and regional specialists. Global players leverage their extensive distribution networks, brand recognition, and research capabilities to maintain market leadership, while local players compete through specialized product offerings and a deep understanding of regional preferences. The market is characterized by the presence of both diversified food companies with confectionery divisions and specialized confectionery manufacturers, creating a dynamic competitive environment.
Market consolidation is gradually increasing through strategic acquisitions and partnerships, particularly in emerging markets. Large companies are acquiring local brands to expand their geographical presence and product portfolio, while smaller players are forming alliances to enhance their competitive position. The industry witnesses regular merger and acquisition activities, with larger companies particularly interested in acquiring brands with a strong regional presence or unique product offerings that complement their existing portfolio.
Innovation and Adaptability Drive Future Success
For incumbent players to maintain and increase their market share, a focus on product innovation and health-conscious offerings is crucial. Companies need to invest in research and development to create products that align with changing consumer preferences, particularly regarding natural ingredients and reduced sugar content. Building strong distribution networks, especially in emerging markets, while maintaining operational efficiency through technological advancement and automation, will be essential for sustained growth. Additionally, developing sustainable practices and transparent supply chains will become increasingly important for maintaining consumer trust and market leadership.
New entrants and challenger brands can gain ground by focusing on niche market segments and innovative product formulations. Success factors include developing unique flavor profiles, targeting specific candy target market demographics, and leveraging digital marketing channels for brand building. Companies must also consider potential regulatory changes regarding sugar content and labeling requirements, while maintaining flexibility to adapt to evolving market conditions. Building strong relationships with retailers and investing in efficient production capabilities will be crucial for long-term success, along with the ability to respond quickly to changing consumer preferences and market dynamics. The candy industry must keep abreast of candy industry trends and conduct thorough candy industry analysis to stay competitive.
Sugar Confectionery Market Leaders
-
HARIBO Holding GmbH & Co. KG
-
Mars Incorporated
-
Mondelēz International Inc.
-
Nestlé SA
-
Perfetti Van Melle BV
- *Disclaimer: Major Players sorted in no particular order

Need More Details on Market Players and Competiters?
Download PDF
Sugar Confectionery Market News
- July 2023: HARIBO® officially began gummi production at its first-ever North American manufacturing facility, located in Pleasant Prairie, Wis. The brand-new, state-of-the-art factory was created to meet the growing demand by US consumers of the beloved gummi brand, which produces over 25 varieties of gummi treats in the US and more than 1,200 types globally.
- June 2023: Tic Tac launched a new spearmint flavor variant in India. The introduction of this refreshing and strong mint variant is aimed at meeting the longstanding demand for a flavor that can be enjoyed in diverse moments throughout the day, such as after meals, workouts, and before important meetings.
- May 2023: Mondelēz International Inc. opened its new Global Research & Development (R&D) Innovation Center in Whippany, New Jersey. The state-of-the-art facility, which is supported by an investment of nearly USD 50 million, includes pilot and scale-up capability for cookies, crackers, and candy.
Free With This Report
We provide a comprehensive and exhaustive set of data pointers for global, regional, and country-level metrics that illustrate the fundamentals of the confectionery industry. With the help of 45+ free charts, clients can access in-depth market analysis based on price trend analysis of confectionery ingredients and per capita consumption of confections, through granular-level segmental information supported by a repository of market data, trends, and expert analysis. Data and analysis on confections, confectionery variants, sugar content, insights into consumer preferences and purchasing patterns, an overview of key market players, etc., are available in the form of comprehensive reports as well as excel-based data worksheets.


Sugar Confectionery Market Report - Table of Contents
1. EXECUTIVE SUMMARY & KEY FINDINGS
2. REPORT OFFERS
3. INTRODUCTION
- 3.1 Study Assumptions & Market Definition
- 3.2 Scope of the Study
- 3.3 Research Methodology
4. KEY INDUSTRY TRENDS
- 4.1 Regulatory Framework
- 4.2 Consumer Buying Behavior
- 4.3 Ingredient Analysis
- 4.4 Value Chain & Distribution Channel Analysis
5. MARKET SEGMENTATION (includes market size in Value in USD and Volume, Forecasts up to 2030 and analysis of growth prospects)
-
5.1 Confectionery Variant
- 5.1.1 Hard Candy
- 5.1.2 Lollipops
- 5.1.3 Mints
- 5.1.4 Pastilles, Gummies, and Jellies
- 5.1.5 Toffees and Nougats
- 5.1.6 Others
-
5.2 Distribution Channel
- 5.2.1 Convenience Store
- 5.2.2 Online Retail Store
- 5.2.3 Supermarket/Hypermarket
- 5.2.4 Others
-
5.3 Region
- 5.3.1 Africa
- 5.3.1.1 By Country
- 5.3.1.1.1 Egypt
- 5.3.1.1.2 Nigeria
- 5.3.1.1.3 South Africa
- 5.3.1.1.4 Rest of Africa
- 5.3.2 Asia-Pacific
- 5.3.2.1 By Country
- 5.3.2.1.1 Australia
- 5.3.2.1.2 China
- 5.3.2.1.3 India
- 5.3.2.1.4 Indonesia
- 5.3.2.1.5 Japan
- 5.3.2.1.6 Malaysia
- 5.3.2.1.7 New Zealand
- 5.3.2.1.8 South Korea
- 5.3.2.1.9 Rest of Asia-Pacific
- 5.3.3 Europe
- 5.3.3.1 By Country
- 5.3.3.1.1 Belgium
- 5.3.3.1.2 France
- 5.3.3.1.3 Germany
- 5.3.3.1.4 Italy
- 5.3.3.1.5 Netherlands
- 5.3.3.1.6 Russia
- 5.3.3.1.7 Spain
- 5.3.3.1.8 Switzerland
- 5.3.3.1.9 Turkey
- 5.3.3.1.10 United Kingdom
- 5.3.3.1.11 Rest of Europe
- 5.3.4 Middle East
- 5.3.4.1 By Country
- 5.3.4.1.1 Bahrain
- 5.3.4.1.2 Kuwait
- 5.3.4.1.3 Oman
- 5.3.4.1.4 Qatar
- 5.3.4.1.5 Saudi Arabia
- 5.3.4.1.6 United Arab Emirates
- 5.3.4.1.7 Rest of Middle East
- 5.3.5 North America
- 5.3.5.1 By Country
- 5.3.5.1.1 Canada
- 5.3.5.1.2 Mexico
- 5.3.5.1.3 United States
- 5.3.5.1.4 Rest of North America
- 5.3.6 South America
- 5.3.6.1 By Country
- 5.3.6.1.1 Argentina
- 5.3.6.1.2 Brazil
- 5.3.6.1.3 Rest of South America
6. COMPETITIVE LANDSCAPE
- 6.1 Key Strategic Moves
- 6.2 Market Share Analysis
- 6.3 Company Landscape
-
6.4 Company Profiles
- 6.4.1 Arcor S.A.I.C
- 6.4.2 August Storck KG
- 6.4.3 Cloetta AB
- 6.4.4 Ferrero International SA
- 6.4.5 HARIBO Holding GmbH & Co. KG
- 6.4.6 Mars Incorporated
- 6.4.7 Meiji Holdings Company Ltd
- 6.4.8 Mondelēz International Inc.
- 6.4.9 Mount Franklin Foods LLC
- 6.4.10 Nestlé SA
- 6.4.11 Oy Karl Fazer Ab
- 6.4.12 Perfetti Van Melle BV
- 6.4.13 The Hershey Company
- *List Not Exhaustive
7. KEY STRATEGIC QUESTIONS FOR CONFECTIONERY CEOS
8. APPENDIX
-
8.1 Global Overview
- 8.1.1 Overview
- 8.1.2 Porter’s Five Forces Framework
- 8.1.3 Global Value Chain Analysis
- 8.1.4 Market Dynamics (DROs)
- 8.2 Sources & References
- 8.3 List of Tables & Figures
- 8.4 Primary Insights
- 8.5 Data Pack
- 8.6 Glossary of Terms
You Can Purchase Parts Of This Report. Check Out Prices For Specific Sections
Get Price Break-up Now
List of Tables & Figures
- Figure 1:
- VOLUME OF SUGAR CONFECTIONERY MARKET, METRIC TONNES, GLOBAL, 2018 - 2030
- Figure 2:
- VALUE OF SUGAR CONFECTIONERY MARKET, USD, GLOBAL, 2018 - 2030
- Figure 3:
- VOLUME OF SUGAR CONFECTIONERY MARKET BY CONFECTIONERY VARIANT, METRIC TONNES, GLOBAL, 2018 - 2030
- Figure 4:
- VALUE OF SUGAR CONFECTIONERY MARKET BY CONFECTIONERY VARIANT, USD, GLOBAL, 2018 - 2030
- Figure 5:
- VOLUME SHARE OF SUGAR CONFECTIONERY MARKET BY CONFECTIONERY VARIANT, %, GLOBAL, 2018 VS 2024 VS 2030
- Figure 6:
- VALUE SHARE OF SUGAR CONFECTIONERY MARKET BY CONFECTIONERY VARIANT, %, GLOBAL, 2018 VS 2024 VS 2030
- Figure 7:
- VOLUME OF HARD CANDY MARKET, METRIC TONNES, GLOBAL, 2018 - 2030
- Figure 8:
- VALUE OF HARD CANDY MARKET, USD, GLOBAL, 2018 - 2030
- Figure 9:
- VALUE SHARE OF HARD CANDY MARKET BY DISTRIBUTION CHANNEL, %, GLOBAL, 2023 VS 2030
- Figure 10:
- VOLUME OF LOLLIPOPS MARKET, METRIC TONNES, GLOBAL, 2018 - 2030
- Figure 11:
- VALUE OF LOLLIPOPS MARKET, USD, GLOBAL, 2018 - 2030
- Figure 12:
- VALUE SHARE OF LOLLIPOPS MARKET BY DISTRIBUTION CHANNEL, %, GLOBAL, 2023 VS 2030
- Figure 13:
- VOLUME OF MINTS MARKET, METRIC TONNES, GLOBAL, 2018 - 2030
- Figure 14:
- VALUE OF MINTS MARKET, USD, GLOBAL, 2018 - 2030
- Figure 15:
- VALUE SHARE OF MINTS MARKET BY DISTRIBUTION CHANNEL, %, GLOBAL, 2023 VS 2030
- Figure 16:
- VOLUME OF PASTILLES, GUMMIES, AND JELLIES MARKET, METRIC TONNES, GLOBAL, 2018 - 2030
- Figure 17:
- VALUE OF PASTILLES, GUMMIES, AND JELLIES MARKET, USD, GLOBAL, 2018 - 2030
- Figure 18:
- VALUE SHARE OF PASTILLES, GUMMIES, AND JELLIES MARKET BY DISTRIBUTION CHANNEL, %, GLOBAL, 2023 VS 2030
- Figure 19:
- VOLUME OF TOFFEES AND NOUGATS MARKET, METRIC TONNES, GLOBAL, 2018 - 2030
- Figure 20:
- VALUE OF TOFFEES AND NOUGATS MARKET, USD, GLOBAL, 2018 - 2030
- Figure 21:
- VALUE SHARE OF TOFFEES AND NOUGATS MARKET BY DISTRIBUTION CHANNEL, %, GLOBAL, 2023 VS 2030
- Figure 22:
- VOLUME OF OTHERS MARKET, METRIC TONNES, GLOBAL, 2018 - 2030
- Figure 23:
- VALUE OF OTHERS MARKET, USD, GLOBAL, 2018 - 2030
- Figure 24:
- VALUE SHARE OF OTHERS MARKET BY DISTRIBUTION CHANNEL, %, GLOBAL, 2023 VS 2030
- Figure 25:
- VOLUME OF SUGAR CONFECTIONERY MARKET BY DISTRIBUTION CHANNEL, METRIC TONNES, GLOBAL, 2018 - 2030
- Figure 26:
- VALUE OF SUGAR CONFECTIONERY MARKET BY DISTRIBUTION CHANNEL, USD, GLOBAL, 2018 - 2030
- Figure 27:
- VOLUME SHARE OF SUGAR CONFECTIONERY MARKET BY DISTRIBUTION CHANNEL, %, GLOBAL, 2018 VS 2024 VS 2030
- Figure 28:
- VALUE SHARE OF SUGAR CONFECTIONERY MARKET BY DISTRIBUTION CHANNEL, %, GLOBAL, 2018 VS 2024 VS 2030
- Figure 29:
- VOLUME OF SUGAR CONFECTIONERY MARKET SOLD VIA CONVENIENCE STORE, METRIC TONNES, GLOBAL, 2018 - 2030
- Figure 30:
- VALUE OF SUGAR CONFECTIONERY MARKET SOLD VIA CONVENIENCE STORE, USD, GLOBAL, 2018 - 2030
- Figure 31:
- VALUE SHARE OF SUGAR CONFECTIONERY MARKET SOLD VIA CONVENIENCE STORE BY CONFECTIONERY VARIANTS, %, GLOBAL, 2023 VS 2030
- Figure 32:
- VOLUME OF SUGAR CONFECTIONERY MARKET SOLD VIA ONLINE RETAIL STORE, METRIC TONNES, GLOBAL, 2018 - 2030
- Figure 33:
- VALUE OF SUGAR CONFECTIONERY MARKET SOLD VIA ONLINE RETAIL STORE, USD, GLOBAL, 2018 - 2030
- Figure 34:
- VALUE SHARE OF SUGAR CONFECTIONERY MARKET SOLD VIA ONLINE RETAIL STORE BY CONFECTIONERY VARIANTS, %, GLOBAL, 2023 VS 2030
- Figure 35:
- VOLUME OF SUGAR CONFECTIONERY MARKET SOLD VIA SUPERMARKET/HYPERMARKET, METRIC TONNES, GLOBAL, 2018 - 2030
- Figure 36:
- VALUE OF SUGAR CONFECTIONERY MARKET SOLD VIA SUPERMARKET/HYPERMARKET, USD, GLOBAL, 2018 - 2030
- Figure 37:
- VALUE SHARE OF SUGAR CONFECTIONERY MARKET SOLD VIA SUPERMARKET/HYPERMARKET BY CONFECTIONERY VARIANTS, %, GLOBAL, 2023 VS 2030
- Figure 38:
- VOLUME OF SUGAR CONFECTIONERY MARKET SOLD VIA OTHERS, METRIC TONNES, GLOBAL, 2018 - 2030
- Figure 39:
- VALUE OF SUGAR CONFECTIONERY MARKET SOLD VIA OTHERS, USD, GLOBAL, 2018 - 2030
- Figure 40:
- VALUE SHARE OF SUGAR CONFECTIONERY MARKET SOLD VIA OTHERS BY CONFECTIONERY VARIANTS, %, GLOBAL, 2023 VS 2030
- Figure 41:
- VOLUME OF SUGAR CONFECTIONERY MARKET BY REGION, METRIC TONNES, GLOBAL, 2018 - 2030
- Figure 42:
- VALUE OF SUGAR CONFECTIONERY MARKET BY REGION, USD, GLOBAL, 2018 - 2030
- Figure 43:
- VOLUME SHARE OF SUGAR CONFECTIONERY MARKET BY REGION, %, GLOBAL, 2018 VS 2024 VS 2030
- Figure 44:
- VALUE SHARE OF SUGAR CONFECTIONERY MARKET BY REGION, %, GLOBAL, 2018 VS 2024 VS 2030
- Figure 45:
- VOLUME OF SUGAR CONFECTIONERY MARKET BY COUNTRY, METRIC TONNES, AFRICA, 2018 - 2030
- Figure 46:
- VALUE OF SUGAR CONFECTIONERY MARKET BY COUNTRY, USD, AFRICA, 2018 - 2030
- Figure 47:
- VOLUME SHARE OF SUGAR CONFECTIONERY MARKET BY COUNTRY, %, AFRICA, 2018 VS 2024 VS 2030
- Figure 48:
- VALUE SHARE OF SUGAR CONFECTIONERY MARKET BY COUNTRY, %, AFRICA, 2018 VS 2024 VS 2030
- Figure 49:
- VOLUME OF SUGAR CONFECTIONERY MARKET, METRIC TONNES, EGYPT, 2018 - 2030
- Figure 50:
- VALUE OF SUGAR CONFECTIONERY MARKET, USD, EGYPT, 2018 - 2030
- Figure 51:
- VALUE SHARE OF SUGAR CONFECTIONERY MARKET BY CONFECTIONERY VARIANTS, %, EGYPT, 2023 VS 2030
- Figure 52:
- VOLUME OF SUGAR CONFECTIONERY MARKET, METRIC TONNES, NIGERIA, 2018 - 2030
- Figure 53:
- VALUE OF SUGAR CONFECTIONERY MARKET, USD, NIGERIA, 2018 - 2030
- Figure 54:
- VALUE SHARE OF SUGAR CONFECTIONERY MARKET BY CONFECTIONERY VARIANTS, %, NIGERIA, 2023 VS 2030
- Figure 55:
- VOLUME OF SUGAR CONFECTIONERY MARKET, METRIC TONNES, SOUTH AFRICA, 2018 - 2030
- Figure 56:
- VALUE OF SUGAR CONFECTIONERY MARKET, USD, SOUTH AFRICA, 2018 - 2030
- Figure 57:
- VALUE SHARE OF SUGAR CONFECTIONERY MARKET BY CONFECTIONERY VARIANTS, %, SOUTH AFRICA, 2023 VS 2030
- Figure 58:
- VOLUME OF SUGAR CONFECTIONERY MARKET, METRIC TONNES, REST OF AFRICA, 2018 - 2030
- Figure 59:
- VALUE OF SUGAR CONFECTIONERY MARKET, USD, REST OF AFRICA, 2018 - 2030
- Figure 60:
- VALUE SHARE OF SUGAR CONFECTIONERY MARKET BY CONFECTIONERY VARIANTS, %, REST OF AFRICA, 2023 VS 2030
- Figure 61:
- VOLUME OF SUGAR CONFECTIONERY MARKET BY COUNTRY, METRIC TONNES, ASIA-PACIFIC, 2018 - 2030
- Figure 62:
- VALUE OF SUGAR CONFECTIONERY MARKET BY COUNTRY, USD, ASIA-PACIFIC, 2018 - 2030
- Figure 63:
- VOLUME SHARE OF SUGAR CONFECTIONERY MARKET BY COUNTRY, %, ASIA-PACIFIC, 2018 VS 2024 VS 2030
- Figure 64:
- VALUE SHARE OF SUGAR CONFECTIONERY MARKET BY COUNTRY, %, ASIA-PACIFIC, 2018 VS 2024 VS 2030
- Figure 65:
- VOLUME OF SUGAR CONFECTIONERY MARKET, METRIC TONNES, AUSTRALIA, 2018 - 2030
- Figure 66:
- VALUE OF SUGAR CONFECTIONERY MARKET, USD, AUSTRALIA, 2018 - 2030
- Figure 67:
- VALUE SHARE OF SUGAR CONFECTIONERY MARKET BY CONFECTIONERY VARIANTS, %, AUSTRALIA, 2023 VS 2030
- Figure 68:
- VOLUME OF SUGAR CONFECTIONERY MARKET, METRIC TONNES, CHINA, 2018 - 2030
- Figure 69:
- VALUE OF SUGAR CONFECTIONERY MARKET, USD, CHINA, 2018 - 2030
- Figure 70:
- VALUE SHARE OF SUGAR CONFECTIONERY MARKET BY CONFECTIONERY VARIANTS, %, CHINA, 2023 VS 2030
- Figure 71:
- VOLUME OF SUGAR CONFECTIONERY MARKET, METRIC TONNES, INDIA, 2018 - 2030
- Figure 72:
- VALUE OF SUGAR CONFECTIONERY MARKET, USD, INDIA, 2018 - 2030
- Figure 73:
- VALUE SHARE OF SUGAR CONFECTIONERY MARKET BY CONFECTIONERY VARIANTS, %, INDIA, 2023 VS 2030
- Figure 74:
- VOLUME OF SUGAR CONFECTIONERY MARKET, METRIC TONNES, INDONESIA, 2018 - 2030
- Figure 75:
- VALUE OF SUGAR CONFECTIONERY MARKET, USD, INDONESIA, 2018 - 2030
- Figure 76:
- VALUE SHARE OF SUGAR CONFECTIONERY MARKET BY CONFECTIONERY VARIANTS, %, INDONESIA, 2023 VS 2030
- Figure 77:
- VOLUME OF SUGAR CONFECTIONERY MARKET, METRIC TONNES, JAPAN, 2018 - 2030
- Figure 78:
- VALUE OF SUGAR CONFECTIONERY MARKET, USD, JAPAN, 2018 - 2030
- Figure 79:
- VALUE SHARE OF SUGAR CONFECTIONERY MARKET BY CONFECTIONERY VARIANTS, %, JAPAN, 2023 VS 2030
- Figure 80:
- VOLUME OF SUGAR CONFECTIONERY MARKET, METRIC TONNES, MALAYSIA, 2018 - 2030
- Figure 81:
- VALUE OF SUGAR CONFECTIONERY MARKET, USD, MALAYSIA, 2018 - 2030
- Figure 82:
- VALUE SHARE OF SUGAR CONFECTIONERY MARKET BY CONFECTIONERY VARIANTS, %, MALAYSIA, 2023 VS 2030
- Figure 83:
- VOLUME OF SUGAR CONFECTIONERY MARKET, METRIC TONNES, NEW ZEALAND, 2018 - 2030
- Figure 84:
- VALUE OF SUGAR CONFECTIONERY MARKET, USD, NEW ZEALAND, 2018 - 2030
- Figure 85:
- VALUE SHARE OF SUGAR CONFECTIONERY MARKET BY CONFECTIONERY VARIANTS, %, NEW ZEALAND, 2023 VS 2030
- Figure 86:
- VOLUME OF SUGAR CONFECTIONERY MARKET, METRIC TONNES, SOUTH KOREA, 2018 - 2030
- Figure 87:
- VALUE OF SUGAR CONFECTIONERY MARKET, USD, SOUTH KOREA, 2018 - 2030
- Figure 88:
- VALUE SHARE OF SUGAR CONFECTIONERY MARKET BY CONFECTIONERY VARIANTS, %, SOUTH KOREA, 2023 VS 2030
- Figure 89:
- VOLUME OF SUGAR CONFECTIONERY MARKET, METRIC TONNES, REST OF ASIA-PACIFIC, 2018 - 2030
- Figure 90:
- VALUE OF SUGAR CONFECTIONERY MARKET, USD, REST OF ASIA-PACIFIC, 2018 - 2030
- Figure 91:
- VALUE SHARE OF SUGAR CONFECTIONERY MARKET BY CONFECTIONERY VARIANTS, %, REST OF ASIA-PACIFIC, 2023 VS 2030
- Figure 92:
- VOLUME OF SUGAR CONFECTIONERY MARKET BY COUNTRY, METRIC TONNES, EUROPE, 2018 - 2030
- Figure 93:
- VALUE OF SUGAR CONFECTIONERY MARKET BY COUNTRY, USD, EUROPE, 2018 - 2030
- Figure 94:
- VOLUME SHARE OF SUGAR CONFECTIONERY MARKET BY COUNTRY, %, EUROPE, 2018 VS 2024 VS 2030
- Figure 95:
- VALUE SHARE OF SUGAR CONFECTIONERY MARKET BY COUNTRY, %, EUROPE, 2018 VS 2024 VS 2030
- Figure 96:
- VOLUME OF SUGAR CONFECTIONERY MARKET, METRIC TONNES, BELGIUM, 2018 - 2030
- Figure 97:
- VALUE OF SUGAR CONFECTIONERY MARKET, USD, BELGIUM, 2018 - 2030
- Figure 98:
- VALUE SHARE OF SUGAR CONFECTIONERY MARKET BY CONFECTIONERY VARIANTS, %, BELGIUM, 2023 VS 2030
- Figure 99:
- VOLUME OF SUGAR CONFECTIONERY MARKET, METRIC TONNES, FRANCE, 2018 - 2030
- Figure 100:
- VALUE OF SUGAR CONFECTIONERY MARKET, USD, FRANCE, 2018 - 2030
- Figure 101:
- VALUE SHARE OF SUGAR CONFECTIONERY MARKET BY CONFECTIONERY VARIANTS, %, FRANCE, 2023 VS 2030
- Figure 102:
- VOLUME OF SUGAR CONFECTIONERY MARKET, METRIC TONNES, GERMANY, 2018 - 2030
- Figure 103:
- VALUE OF SUGAR CONFECTIONERY MARKET, USD, GERMANY, 2018 - 2030
- Figure 104:
- VALUE SHARE OF SUGAR CONFECTIONERY MARKET BY CONFECTIONERY VARIANTS, %, GERMANY, 2023 VS 2030
- Figure 105:
- VOLUME OF SUGAR CONFECTIONERY MARKET, METRIC TONNES, ITALY, 2018 - 2030
- Figure 106:
- VALUE OF SUGAR CONFECTIONERY MARKET, USD, ITALY, 2018 - 2030
- Figure 107:
- VALUE SHARE OF SUGAR CONFECTIONERY MARKET BY CONFECTIONERY VARIANTS, %, ITALY, 2023 VS 2030
- Figure 108:
- VOLUME OF SUGAR CONFECTIONERY MARKET, METRIC TONNES, NETHERLANDS, 2018 - 2030
- Figure 109:
- VALUE OF SUGAR CONFECTIONERY MARKET, USD, NETHERLANDS, 2018 - 2030
- Figure 110:
- VALUE SHARE OF SUGAR CONFECTIONERY MARKET BY CONFECTIONERY VARIANTS, %, NETHERLANDS, 2023 VS 2030
- Figure 111:
- VOLUME OF SUGAR CONFECTIONERY MARKET, METRIC TONNES, RUSSIA, 2018 - 2030
- Figure 112:
- VALUE OF SUGAR CONFECTIONERY MARKET, USD, RUSSIA, 2018 - 2030
- Figure 113:
- VALUE SHARE OF SUGAR CONFECTIONERY MARKET BY CONFECTIONERY VARIANTS, %, RUSSIA, 2023 VS 2030
- Figure 114:
- VOLUME OF SUGAR CONFECTIONERY MARKET, METRIC TONNES, SPAIN, 2018 - 2030
- Figure 115:
- VALUE OF SUGAR CONFECTIONERY MARKET, USD, SPAIN, 2018 - 2030
- Figure 116:
- VALUE SHARE OF SUGAR CONFECTIONERY MARKET BY CONFECTIONERY VARIANTS, %, SPAIN, 2023 VS 2030
- Figure 117:
- VOLUME OF SUGAR CONFECTIONERY MARKET, METRIC TONNES, SWITZERLAND, 2018 - 2030
- Figure 118:
- VALUE OF SUGAR CONFECTIONERY MARKET, USD, SWITZERLAND, 2018 - 2030
- Figure 119:
- VALUE SHARE OF SUGAR CONFECTIONERY MARKET BY CONFECTIONERY VARIANTS, %, SWITZERLAND, 2023 VS 2030
- Figure 120:
- VOLUME OF SUGAR CONFECTIONERY MARKET, METRIC TONNES, TURKEY, 2018 - 2030
- Figure 121:
- VALUE OF SUGAR CONFECTIONERY MARKET, USD, TURKEY, 2018 - 2030
- Figure 122:
- VALUE SHARE OF SUGAR CONFECTIONERY MARKET BY CONFECTIONERY VARIANTS, %, TURKEY, 2023 VS 2030
- Figure 123:
- VOLUME OF SUGAR CONFECTIONERY MARKET, METRIC TONNES, UNITED KINGDOM, 2018 - 2030
- Figure 124:
- VALUE OF SUGAR CONFECTIONERY MARKET, USD, UNITED KINGDOM, 2018 - 2030
- Figure 125:
- VALUE SHARE OF SUGAR CONFECTIONERY MARKET BY CONFECTIONERY VARIANTS, %, UNITED KINGDOM, 2023 VS 2030
- Figure 126:
- VOLUME OF SUGAR CONFECTIONERY MARKET, METRIC TONNES, REST OF EUROPE, 2018 - 2030
- Figure 127:
- VALUE OF SUGAR CONFECTIONERY MARKET, USD, REST OF EUROPE, 2018 - 2030
- Figure 128:
- VALUE SHARE OF SUGAR CONFECTIONERY MARKET BY CONFECTIONERY VARIANTS, %, REST OF EUROPE, 2023 VS 2030
- Figure 129:
- VOLUME OF SUGAR CONFECTIONERY MARKET BY COUNTRY, METRIC TONNES, MIDDLE EAST, 2018 - 2030
- Figure 130:
- VALUE OF SUGAR CONFECTIONERY MARKET BY COUNTRY, USD, MIDDLE EAST, 2018 - 2030
- Figure 131:
- VOLUME SHARE OF SUGAR CONFECTIONERY MARKET BY COUNTRY, %, MIDDLE EAST, 2018 VS 2024 VS 2030
- Figure 132:
- VALUE SHARE OF SUGAR CONFECTIONERY MARKET BY COUNTRY, %, MIDDLE EAST, 2018 VS 2024 VS 2030
- Figure 133:
- VOLUME OF SUGAR CONFECTIONERY MARKET, METRIC TONNES, BAHRAIN, 2018 - 2030
- Figure 134:
- VALUE OF SUGAR CONFECTIONERY MARKET, USD, BAHRAIN, 2018 - 2030
- Figure 135:
- VALUE SHARE OF SUGAR CONFECTIONERY MARKET BY CONFECTIONERY VARIANTS, %, BAHRAIN, 2023 VS 2030
- Figure 136:
- VOLUME OF SUGAR CONFECTIONERY MARKET, METRIC TONNES, KUWAIT, 2018 - 2030
- Figure 137:
- VALUE OF SUGAR CONFECTIONERY MARKET, USD, KUWAIT, 2018 - 2030
- Figure 138:
- VALUE SHARE OF SUGAR CONFECTIONERY MARKET BY CONFECTIONERY VARIANTS, %, KUWAIT, 2023 VS 2030
- Figure 139:
- VOLUME OF SUGAR CONFECTIONERY MARKET, METRIC TONNES, OMAN, 2018 - 2030
- Figure 140:
- VALUE OF SUGAR CONFECTIONERY MARKET, USD, OMAN, 2018 - 2030
- Figure 141:
- VALUE SHARE OF SUGAR CONFECTIONERY MARKET BY CONFECTIONERY VARIANTS, %, OMAN, 2023 VS 2030
- Figure 142:
- VOLUME OF SUGAR CONFECTIONERY MARKET, METRIC TONNES, QATAR, 2018 - 2030
- Figure 143:
- VALUE OF SUGAR CONFECTIONERY MARKET, USD, QATAR, 2018 - 2030
- Figure 144:
- VALUE SHARE OF SUGAR CONFECTIONERY MARKET BY CONFECTIONERY VARIANTS, %, QATAR, 2023 VS 2030
- Figure 145:
- VOLUME OF SUGAR CONFECTIONERY MARKET, METRIC TONNES, SAUDI ARABIA, 2018 - 2030
- Figure 146:
- VALUE OF SUGAR CONFECTIONERY MARKET, USD, SAUDI ARABIA, 2018 - 2030
- Figure 147:
- VALUE SHARE OF SUGAR CONFECTIONERY MARKET BY CONFECTIONERY VARIANTS, %, SAUDI ARABIA, 2023 VS 2030
- Figure 148:
- VOLUME OF SUGAR CONFECTIONERY MARKET, METRIC TONNES, UNITED ARAB EMIRATES, 2018 - 2030
- Figure 149:
- VALUE OF SUGAR CONFECTIONERY MARKET, USD, UNITED ARAB EMIRATES, 2018 - 2030
- Figure 150:
- VALUE SHARE OF SUGAR CONFECTIONERY MARKET BY CONFECTIONERY VARIANTS, %, UNITED ARAB EMIRATES, 2023 VS 2030
- Figure 151:
- VOLUME OF SUGAR CONFECTIONERY MARKET, METRIC TONNES, REST OF MIDDLE EAST, 2018 - 2030
- Figure 152:
- VALUE OF SUGAR CONFECTIONERY MARKET, USD, REST OF MIDDLE EAST, 2018 - 2030
- Figure 153:
- VALUE SHARE OF SUGAR CONFECTIONERY MARKET BY CONFECTIONERY VARIANTS, %, REST OF MIDDLE EAST, 2023 VS 2030
- Figure 154:
- VOLUME OF SUGAR CONFECTIONERY MARKET BY COUNTRY, METRIC TONNES, NORTH AMERICA, 2018 - 2030
- Figure 155:
- VALUE OF SUGAR CONFECTIONERY MARKET BY COUNTRY, USD, NORTH AMERICA, 2018 - 2030
- Figure 156:
- VOLUME SHARE OF SUGAR CONFECTIONERY MARKET BY COUNTRY, %, NORTH AMERICA, 2018 VS 2024 VS 2030
- Figure 157:
- VALUE SHARE OF SUGAR CONFECTIONERY MARKET BY COUNTRY, %, NORTH AMERICA, 2018 VS 2024 VS 2030
- Figure 158:
- VOLUME OF SUGAR CONFECTIONERY MARKET, METRIC TONNES, CANADA, 2018 - 2030
- Figure 159:
- VALUE OF SUGAR CONFECTIONERY MARKET, USD, CANADA, 2018 - 2030
- Figure 160:
- VALUE SHARE OF SUGAR CONFECTIONERY MARKET BY CONFECTIONERY VARIANTS, %, CANADA, 2023 VS 2030
- Figure 161:
- VOLUME OF SUGAR CONFECTIONERY MARKET, METRIC TONNES, MEXICO, 2018 - 2030
- Figure 162:
- VALUE OF SUGAR CONFECTIONERY MARKET, USD, MEXICO, 2018 - 2030
- Figure 163:
- VALUE SHARE OF SUGAR CONFECTIONERY MARKET BY CONFECTIONERY VARIANTS, %, MEXICO, 2023 VS 2030
- Figure 164:
- VOLUME OF SUGAR CONFECTIONERY MARKET, METRIC TONNES, UNITED STATES, 2018 - 2030
- Figure 165:
- VALUE OF SUGAR CONFECTIONERY MARKET, USD, UNITED STATES, 2018 - 2030
- Figure 166:
- VALUE SHARE OF SUGAR CONFECTIONERY MARKET BY CONFECTIONERY VARIANTS, %, UNITED STATES, 2023 VS 2030
- Figure 167:
- VOLUME OF SUGAR CONFECTIONERY MARKET, METRIC TONNES, REST OF NORTH AMERICA, 2018 - 2030
- Figure 168:
- VALUE OF SUGAR CONFECTIONERY MARKET, USD, REST OF NORTH AMERICA, 2018 - 2030
- Figure 169:
- VALUE SHARE OF SUGAR CONFECTIONERY MARKET BY CONFECTIONERY VARIANTS, %, REST OF NORTH AMERICA, 2023 VS 2030
- Figure 170:
- VOLUME OF SUGAR CONFECTIONERY MARKET BY COUNTRY, METRIC TONNES, SOUTH AMERICA, 2018 - 2030
- Figure 171:
- VALUE OF SUGAR CONFECTIONERY MARKET BY COUNTRY, USD, SOUTH AMERICA, 2018 - 2030
- Figure 172:
- VOLUME SHARE OF SUGAR CONFECTIONERY MARKET BY COUNTRY, %, SOUTH AMERICA, 2018 VS 2024 VS 2030
- Figure 173:
- VALUE SHARE OF SUGAR CONFECTIONERY MARKET BY COUNTRY, %, SOUTH AMERICA, 2018 VS 2024 VS 2030
- Figure 174:
- VOLUME OF SUGAR CONFECTIONERY MARKET, METRIC TONNES, ARGENTINA, 2018 - 2030
- Figure 175:
- VALUE OF SUGAR CONFECTIONERY MARKET, USD, ARGENTINA, 2018 - 2030
- Figure 176:
- VALUE SHARE OF SUGAR CONFECTIONERY MARKET BY CONFECTIONERY VARIANTS, %, ARGENTINA, 2023 VS 2030
- Figure 177:
- VOLUME OF SUGAR CONFECTIONERY MARKET, METRIC TONNES, BRAZIL, 2018 - 2030
- Figure 178:
- VALUE OF SUGAR CONFECTIONERY MARKET, USD, BRAZIL, 2018 - 2030
- Figure 179:
- VALUE SHARE OF SUGAR CONFECTIONERY MARKET BY CONFECTIONERY VARIANTS, %, BRAZIL, 2023 VS 2030
- Figure 180:
- VOLUME OF SUGAR CONFECTIONERY MARKET, METRIC TONNES, REST OF SOUTH AMERICA, 2018 - 2030
- Figure 181:
- VALUE OF SUGAR CONFECTIONERY MARKET, USD, REST OF SOUTH AMERICA, 2018 - 2030
- Figure 182:
- VALUE SHARE OF SUGAR CONFECTIONERY MARKET BY CONFECTIONERY VARIANTS, %, REST OF SOUTH AMERICA, 2023 VS 2030
- Figure 183:
- MOST ACTIVE COMPANIES BY NUMBER OF STRATEGIC MOVES, COUNT, GLOBAL, 2018 - 2023
- Figure 184:
- MOST ADOPTED STRATEGIES, COUNT, GLOBAL, 2018 - 2023
- Figure 185:
- VALUE SHARE OF MAJOR PLAYERS, %, GLOBAL
Sugar Confectionery Industry Segmentation
Hard Candy, Lollipops, Mints, Pastilles, Gummies, and Jellies, Toffees and Nougats, Others are covered as segments by Confectionery Variant. Convenience Store, Online Retail Store, Supermarket/Hypermarket, Others are covered as segments by Distribution Channel. Africa, Asia-Pacific, Europe, Middle East, North America, South America are covered as segments by Region.| Confectionery Variant | Hard Candy | |||
| Lollipops | ||||
| Mints | ||||
| Pastilles, Gummies, and Jellies | ||||
| Toffees and Nougats | ||||
| Others | ||||
| Distribution Channel | Convenience Store | |||
| Online Retail Store | ||||
| Supermarket/Hypermarket | ||||
| Others | ||||
| Region | Africa | By Country | Egypt | |
| Nigeria | ||||
| South Africa | ||||
| Rest of Africa | ||||
| Asia-Pacific | By Country | Australia | ||
| China | ||||
| India | ||||
| Indonesia | ||||
| Japan | ||||
| Malaysia | ||||
| New Zealand | ||||
| South Korea | ||||
| Rest of Asia-Pacific | ||||
| Europe | By Country | Belgium | ||
| France | ||||
| Germany | ||||
| Italy | ||||
| Netherlands | ||||
| Russia | ||||
| Spain | ||||
| Switzerland | ||||
| Turkey | ||||
| United Kingdom | ||||
| Rest of Europe | ||||
| Middle East | By Country | Bahrain | ||
| Kuwait | ||||
| Oman | ||||
| Qatar | ||||
| Saudi Arabia | ||||
| United Arab Emirates | ||||
| Rest of Middle East | ||||
| North America | By Country | Canada | ||
| Mexico | ||||
| United States | ||||
| Rest of North America | ||||
| South America | By Country | Argentina | ||
| Brazil | ||||
| Rest of South America | ||||
Need A Different Region or Segment?
Customize Now
Market Definition
- Milk and White Chocolate - Milk chocolates is a solid chocolate made with milk (in the form of either milk powder, liquid milk, or condensed milk) and cocoa solids. White chocolate is made from cocoa butter and milk and contains no cocoa solids whatsoever. The scope includes regular chocolates, low-sugar, and sugar-free variants
- Toffees & Nougats - Toffees include hard, chewy, and small or one-bite candies marketed with labels as toffee or toffee-like confectionery. Nougat is a chewy confection with almond, sugar, and egg white as a basic ingredient; and it originated in Europe and Middle East countries.
- Cereals Bars - A snack composed of breakfast cereal that has been compressed into a bar shape and is held together with a form of edible adhesive. The scope includes snack bars made with cereals such as rice, oats, corn, etc. mixed with a binding syrup. These also include products labeled as cereal bars, cereal treat bars, or grain bars.
- Chewing Gum - This is a preparation for chewing, usually made of flavored and sweetened chicle or such substitutes as polyvinyl acetate. The types of chewing gums included in the scope are sugar-chewing gums and sugar-free chewing gums
| Keyword | Definition |
|---|---|
| Dark Chocolate | Dark chocolate is a form of chocolate containing cocoa solids and cocoa butter without the milk. |
| White Chocolate | White chocolate is the type of chocolate containing the highest percentage of milk solids, typically around or over 30 percent. |
| Milk Chocolate | Milk chocolate is made from dark chocolate that has a low cocoa solid content and higher sugar content, plus a milk product. |
| Hard Candy | A candy made of sugar and corn syrup boiled without crystallizing. |
| Toffees | A hard, chewy, often brown sweet that is made from sugar boiled with butter. |
| Nougats | A chewy or brittle candy containing almonds or other nuts and sometimes fruit. |
| Cereal bar | A cereal bar is a bar-shaped food product, made by pressing cereals and usually dried fruit or berries, which are in most cases held together by glucose syrup. |
| Protein bar | Protein bars are nutrition bars that contain a high proportion of protein to carbohydrates/fats. |
| Fruit & Nut bar | These are often based on dates with other dried fruit and nut additions and, in some cases, flavorings. |
| NCA | The National Confectioners Association is an American trade organization that promotes chocolate, candy, gum and mints, and the companies that make these treats. |
| CGMP | Current good manufacturing practices are those conforming to the guidelines recommended by relevant agencies. |
| Unstandardized foods | Unstandardized foods are those that do not have a standard of identity or that deviate from a prescribed standard in any manner. |
| GI | The glycemic index (GI) is a way of ranking carbohydrate-containing foods based on how slowly or quickly they are digested and increase blood glucose levels over a period of time |
| Skimmed milk powder | Skimmed milk powder is obtained by removing water from pasteurized skim milk by spray-drying. |
| Flavanols | Flavanols are a group of compounds found in cocoa, tea, apples, and many other plant-based foods and beverages. |
| WPC | Whey protein concentrate- the substance obtained by the removal of sufficient nonprotein constituents from pasteurized whey so that the finished dry product contains greater than 25% protein. |
| LDL | Low density Lipoprotein- the bad cholesterol |
| HDL | High density Lipoprotein- the good cholesterol |
| BHT | butylated Hydroxytoluene is a lab-made chemical that is added to foods as a preservative. |
| Carrageenan | Carrageenan is an additive used to thicken, emulsify, and preserve foods and drinks. |
| Free form | Not containing certain ingredients, such as gluten, dairy, or sugar. |
| Cocoa butter | It is a fatty substance obtained from cocoa beans, used in the manufacture of confectionery. |
| Pastellies | A type of of Brazilian candy made from sugar, eggs, and milk. |
| Draggees | Small, round candies that are coated with a hard sugar shell |
| CHOPRABISCO | Royal Belgian Association of the chocolate, pralines, biscuit, and confectionery industry- A trade association that represents the Belgian chocolate industry. |
| European Directive 2000/13 | A European Union directive that regulates the labeling of food products |
| Kakao-Verordnung | The German chocolate ordinance, a set of regulations that define what can be labeled as "chocolate" in Germany. |
| FASFC | Federal Agency for the Safety of the Food Chain |
| Pectin | A natural substance that is derived from fruits and vegetables. It is used in confectionery to create a gel-like texture. |
| Invert sugars | A type of sugar that is made up of glucose and fructose. |
| Emulsifier | A substance that helps to mix to liquids that does not mix together. |
| Anthocyanins | A type of flavonoid that is responsible for the red, purple, and blue colors of confectionery. |
| Functional Foods | Foods that have been modified to provide additional health benefits beyond basic nutrition. |
| Kosher certificate | This certification verifies that the ingredients, production process including all machinery, and/or food-service process complies with the standards of Jewish dietary law |
| Chicory root extract | A natural extract from the chicory root that is a good source of fiber, calcium, phosphorous, and folate |
| RDD | Recommended daily dose |
| Gummies | A chewy gelatin-based candy that is often flavored with fruit. |
| Nutraceuticals | Food or dietary supplements that are claimed to have health benefits. |
| Energy bars | Snack bars that are high in carbohydrates and calories are designed to provide energy on the go. |
| BFSO | Belgian Food Safety Organization for the food chain. |
Need More Details on Market Definition?
Ask a Question
Research Methodology
Mordor Intelligence follows a four-step methodology in all our reports.
- Step-1: Identify Key Variables: In order to build a robust forecasting methodology, the variables and factors identified in Step 1 are tested against available historical market numbers. Through an iterative process, the variables required for market forecast are set, and the model is built on the basis of these variables.
- Step-2: Build a Market Model: Market-size estimations for the forecast years are in nominal terms. Inflation is not a part of the pricing, and the average selling price (ASP) is kept constant throughout the forecast period for each country.
- Step-3: Validate and Finalize: In this important step, all market numbers, variables, and analyst calls are validated through an extensive network of primary research experts from the market studied. The respondents are selected across levels and functions to generate a holistic picture of the market studied.
- Step-4: Research Outputs: Syndicated Reports, Custom Consulting Assignments, Databases & Subscription Platforms

Get More Details On Research Methodology
Download PDF


