
Subscription-Based Gaming Market Size and Share
Market Overview
| Study Period | 2020 - 2031 |
|---|---|
| Market Size (2026) | USD 13.1 Billion |
| Market Size (2031) | USD 20.38 Billion |
| Growth Rate (2026 - 2031) | 9.25% CAGR |
| Fastest Growing Market | Asia Pacific |
| Largest Market | North America |
| Market Concentration | Medium |
Major Players *Disclaimer: Major Players sorted in no particular order Image © Mordor Intelligence. Reuse requires attribution under CC BY 4.0. | |
Subscription-Based Gaming Market Analysis by Mordor Intelligence
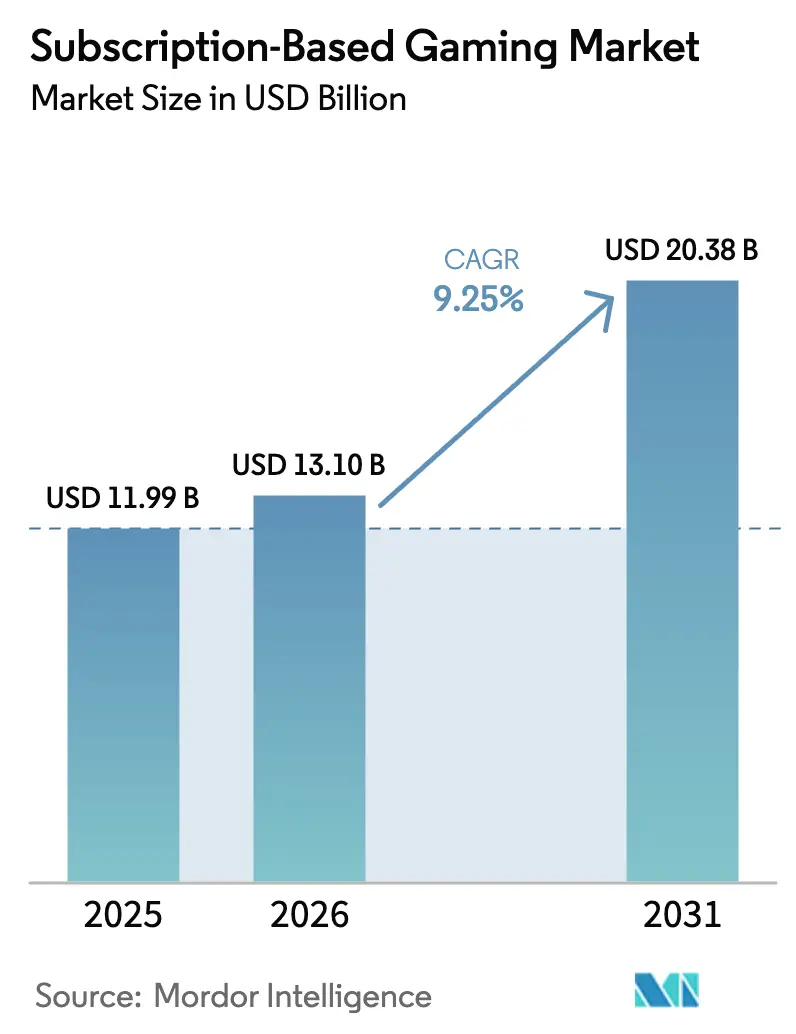
The subscription-based gaming market size is expected to grow from USD 11.99 billion in 2025 to USD 13.1 billion in 2026 and is forecast to reach USD 20.38 billion by 2031 at 9.25% CAGR over 2026-2031. The growth curve mirrors a wider pivot across digital entertainment from ownership toward on-demand access, an evolution fueled by the rollout of 5G networks, maturing edge-compute infrastructure, and content libraries that now launch cloud-native AAA titles on day one. Platform holders are reallocating budgets from loot-box mechanics to recurring revenue models in response to tightening regulations, which further accelerates the adoption of subscription plans over one-time purchases. Cross-platform account portability, improved payment localization in emerging markets, and bundled telco offers that wrap connectivity with game passes continue to enlarge the global subscriber base. As a result, the subscription-based gaming market is moving from an early-adopter niche to a mainstream revenue generator across consoles, PCs, and mobile devices.
Key Report Takeaways
- By gaming type, console commanded 54.35% of subscription-based gaming market share in 2025, while mobile is forecast to expand at a 9.95% CAGR through 2031.
- By platform type, download-to-device services held 60.32% share of the subscription-based gaming market size in 2025; cloud streaming is advancing at an 11.05% CAGR to 2031.
- By subscription tier, premium plans accounted for 48.55% of 2025 revenue, whereas family tiers are tracking a 10.05% CAGR to 2031.
- By end-user demographic, millennials captured 45.62% of subscription-based gaming market share in 2025; Gen Z usage is growing at a 10.35% CAGR through 2031.
- By geography, North America led with 72.35% revenue share in 2025, but Asia-Pacific is projected to record the fastest 10.6% CAGR to 2031.
Note: Market size and forecast figures in this report are generated using Mordor Intelligence’s proprietary estimation framework, updated with the latest available data and insights as of 2026.
Global Subscription-Based Gaming Market Trends and Insights
Drivers Impact Analysis*
| Driver | (~) % Impact on CAGR Forecast | Geographic Relevance | Impact Timeline |
|---|---|---|---|
| Cloud-native AAA launches | +1.8% | Global – early lift in North America and Europe | Medium term (2-4 years) |
| Cross-platform account portability | +1.5% | Global – strongest in Asia-Pacific mobile markets | Short term (≤ 2 years) |
| Device-inclusive family plans | +1.2% | North America and Europe core – expanding to LATAM | Medium term (2-4 years) |
| Bundled telco-gaming offers | +2.1% | Asia-Pacific, MEA, and LATAM | Long term (≥ 4 years) |
| Gen-AI personalized curation | +1.4% | Global – advanced rollouts in developed economies | Medium term (2-4 years) |
| Regulatory caps on loot-boxes | +1.8% | Europe and select Asia-Pacific jurisdictions | Short term (≤ 2 years) |
| Source: Mordor Intelligence | |||


Cloud-Native AAA Launches Accelerate Paid Adoption
Subscribing now guarantees immediate access to blockbuster releases, turning a service once defined by back-catalog access into a launch-day destination. [1]Nasdaq, “GameSquare Completes FaZe Clan Acquisition,” nasdaq.com Publishers like Microsoft funnel more than USD 1 billion per year into day-one Game Pass additions, a commitment that elevates perceived value, supports higher price points, and lowers churn. Cloud-native pipelines remove boxed-product risk, enable simultaneous global launches, and support real-time updates that lengthen engagement cycles. As latency gaps close, fidelity matches local installs, and players increasingly accept streaming as a default. The subscription-based gaming market thus gains momentum from content that historically required USD 70 out-of-pocket purchases.
Cross-Platform Account Portability Boosts Perceived Value
Seamless identity and inventory migration across console, PC, and mobile erodes the psychological cost of switching hardware.[2]Microsoft Corp., “Xbox Game Pass,” microsoft.com Xsolla’s purchase of AcceleratXR underscores the arms race around back-end tooling that keeps progress persistent regardless of device. For consumers in Asia-Pacific, where session hopping between handset and home screen is common, portability transforms a monthly fee into a long-term asset. Implementing this feature demands unified authentication layers and cross-store entitlements, investments few smaller rivals can match. The result is a widening performance gap that favors scaled services in the subscription-based gaming market.
Device-Inclusive Family Plans Expand Addressable Base
Family tiers bundle 4-6 concurrent streams, shared libraries, and parental controls at up to 60% lower per-capita cost than standalone accounts. Households persuade multiple members to join under one master plan, driving higher penetrations at near-zero incremental acquisition spend. Because cancellations require consensus from several users, retention improves measurably versus single-seat subscriptions. The model also dovetails with cross-generational play trends, making the subscription-based gaming market more resilient to seasonal spending swings.
Bundled Telco-Gaming Offers in Emerging Markets
Carrier billing sidesteps credit-card barriers in Indonesia, India, and Nigeria, unlocking hundreds of millions of potential subscribers. Operators include gaming passes within data plans, guaranteeing both bandwidth and content for one fee, while platform owners gain low-cost distribution into prepaid user pools. These bundles also integrate network-level quality-of-service that mitigates cloud-gaming latency. Over the long term, telco alliances will contribute the biggest additive lift to subscription-based gaming market revenue across mobile-first economies.
Restraints Impact Analysis*
| Restraint | (~) % Impact on CAGR Forecast | Geographic Relevance | Impact Timeline |
|---|---|---|---|
| Rising content-licensing costs | -1.6% | Global – pressure most acute on smaller and regional platforms | Medium term (2-4 years) |
| App-store commission policies | -1.1% | Global mobile markets – strongest on iOS and Android ecosystems | Short term (≤ 2 years) |
| Limited broadband capacity slows cloud streaming | -1.4% | Emerging markets with lower fixed-line and 5G penetration | Long term (≥ 4 years) |
| Subscription fatigue from overlapping gaming passes | -0.8% | North America and Europe where multiple services compete | Medium term (2-4 years) |
| Source: Mordor Intelligence | |||
Rising Content-Licensing Costs Squeeze Margins
The check writers funding day-one launches now face escalating bid prices as multiple services compete for the same signature franchises. Microsoft already spends more than USD 1 billion annually on Game Pass licensing, a figure that sets the industry benchmark. Smaller entrants without similar budgets either accept thinner catalogs or pivot to niche content, narrowing their audience ceiling inside the subscription-based gaming market. Over time, differentiation will hinge on proprietary intellectual property and in-house studios that can lower per-title acquisition costs.
App-Store Commission Policies Limit Mobile Pass Profitability
Standard 30% fees on iOS and Android reduce gross margins and force either higher retail prices or scaled-back content investment. Direct-to-consumer web billing and region-specific regulation offer partial relief, yet uncertain timelines keep mobile subscription economics volatile. For now, service providers bundle incentives such as loyalty points or cross-platform perks to offset the commission drag, but profitability gaps remain a headwind for the broader subscription-based gaming market.
*Our forecasts treat driver/restraint impacts as directional, not additive. The impact forecasts reflect baseline growth, mix effects, and variable interactions.
Segment Analysis
By Gaming Type: Console Strength Meets Mobile Velocity
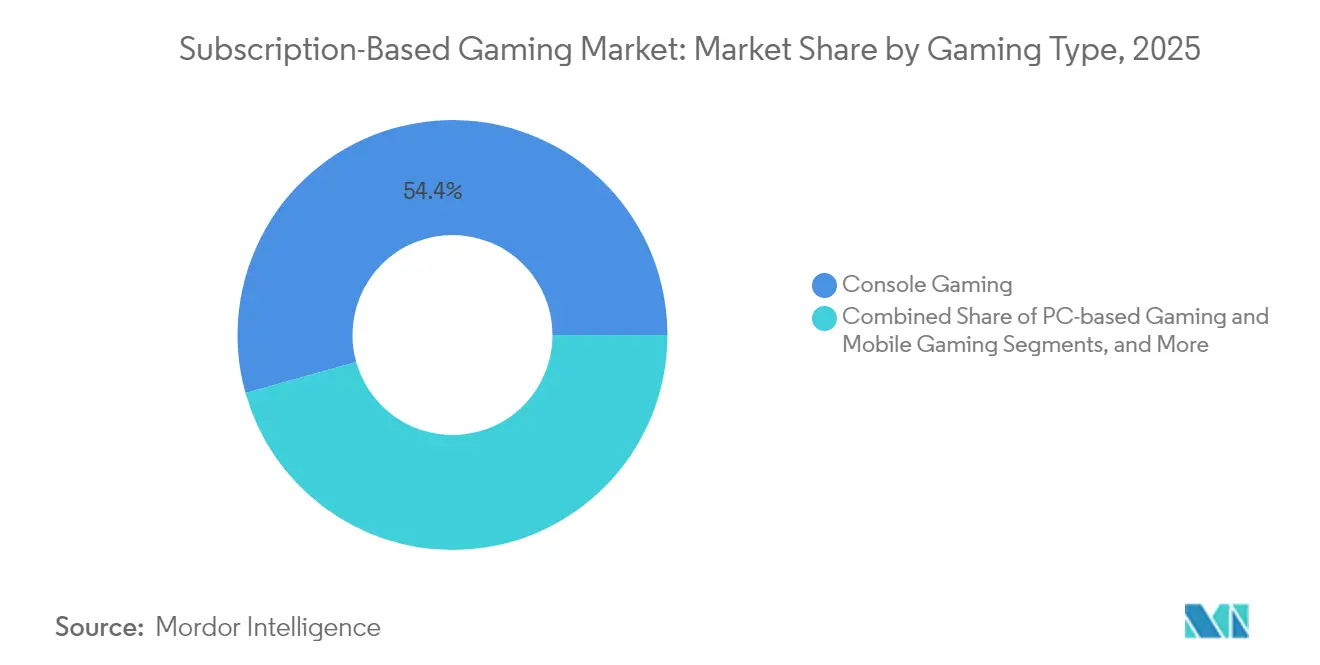
Console subscriptions generated 54.35% of 2025 revenue, underscoring the deep catalog, high-fidelity graphics, and exclusive launch pipelines that appeal to core gamers. Within this cohort, the subscription-based gaming market size for consoles climbed to USD 6.52 billion in 2025 and is pacing an 7.7% CAGR through 2031. Xbox Game Pass and PlayStation Plus extend back-compatibility libraries that push perceived value well beyond the monthly fee. Conversely, mobile subscriptions—currently a smaller slice—are expanding at a 9.95% CAGR as smartphone penetration eclipses 90% in several Southeast Asian countries. Cloud streaming bridges hardware gaps, delivering console-quality titles on midrange devices and pulling younger demographics into paid ecosystems.
Mobile’s ascent also reflects shorter session loops, social sharing norms, and incremental payment habits shaped by free-to-play culture. Bundled telco passes lower friction, while identity portability keeps progress intact across handset upgrades, reducing churn risk. PC subscriptions occupy a middle ground, leaning on storefronts like Steam to test curated passes, though competition from both mobile accessibility and console exclusivity remains intense. The interplay among these three form factors continues to shape the trajectory of the subscription-based gaming market, encouraging hybrid offerings that let one account roam freely across screens.


By Platform Type: Download Supremacy Faces Cloud Challenge
Download-to-device services still hold 60.32% of overall revenue because local installation assures performance regardless of connectivity, a fact valued by latency-sensitive competitive players. At the same time, cloud streaming platforms are racing ahead with an 11.05% CAGR, lifted by 5G backhaul, edge compute, and codecs that now deliver 60 fps gameplay at 1080p on mid-tier networks. That momentum is steering content owners to dual-release strategies, offering both download and stream options within one subscription, thereby hedging against bandwidth disparities.
Hybrid architecture has become central to value propositions. Subscribers download for offline play yet retain the freedom to stream instantly on devices lacking storage. The subscription-based gaming market, therefore, is no longer an “either-or” platform battleground but a continuum where infrastructure quality, not consumer preference, decides the dominant access mode. As fiber deployment widens and cross-device handoff tightens, pure streaming could overtake downloads, but for now coexistence defines the competitive landscape.
By Subscription Tier: Premium Price Gives Way to Family Economics
Premium tiers represent 48.55% of top-line revenue, fueled by early access, exclusive cosmetics, and ad-free experiences that justify a USD 16-20 monthly fee in developed markets. Yet the strongest growth lives inside family-oriented plans, rising at 10.05% CAGR as households opt to share one subscription across multiple profiles. Those plans often cost just 40-60% of the combined individual outlay, tilting upgrade math in their favor. Content holders respond by adding parental dashboards, cloud-based save partitions, and age ratings that coexist under a single license.
Basic tiers remain a gateway in price-sensitive regions; however, upsell funnels built around seasonal battle passes coax gamers toward richer packages. The subscription-based gaming market accommodates this laddered approach by linking cross-tier benefits: points earned in basic can be redeemed at a discount when upgrading to premium, while family plans inherit premium perks. Over time, tier engineering is expected to follow a “good-better-best” template refined in video and music streaming.
By End-User Demographic: Millennials Anchor, Gen Z Accelerates
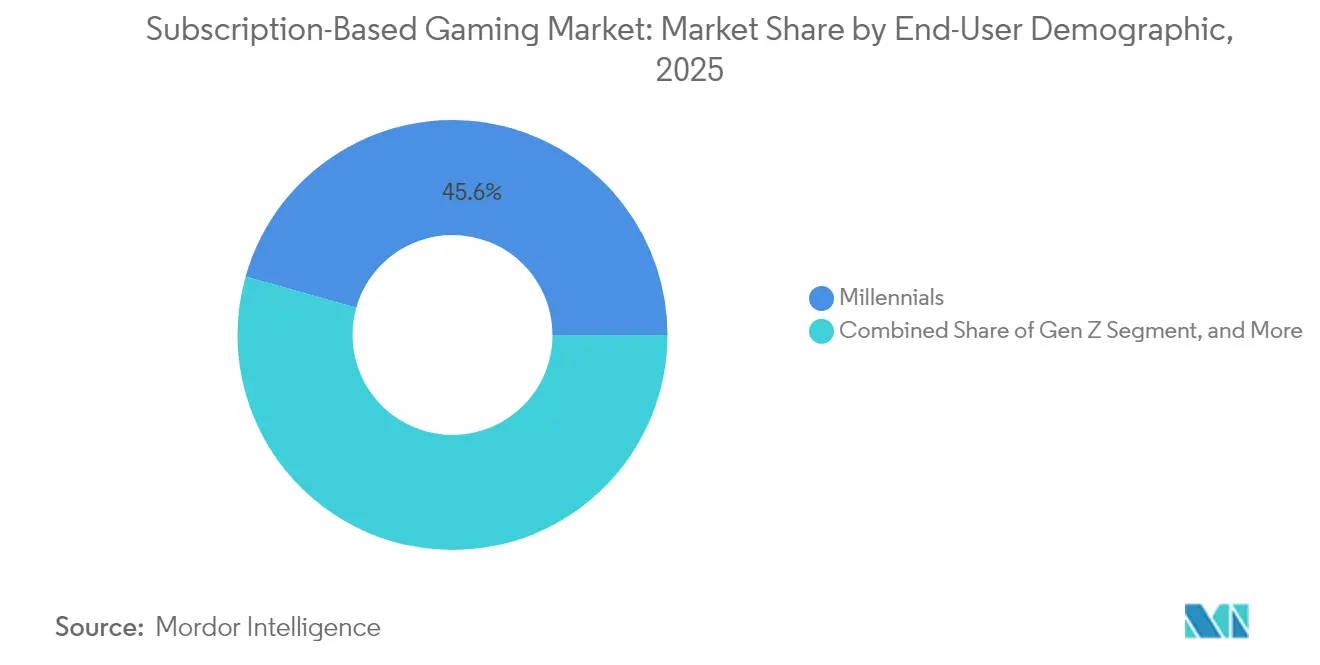
Millennials account for 45.62% of current subscribers, retaining loyalty to franchises they grew up with and possessing disposable income that supports monthly fees. They are also the generation most likely to purchase premium hardware, reinforcing console segment dominance. Gen Z, however, demonstrates the swiftest adoption curve at a 10.35% CAGR, driven by social co-op modes, influencer-led discovery, and preference for cross-play convenience. Content personalization powered by AI resonates with their demand for curated experiences over massive backlogs.
Gen X and baby boomers form a smaller yet profitable segment seeking variety and convenience, making them receptive to family bundles that require minimal setup. Multi-generational households amplify cross-selling opportunities, with younger members introducing subscription services and older members maintaining renewal because of shared engagement. Demographic dynamics thus shape marketing, content acquisition, and feature roadmaps as the subscription-based gaming market matures.
By Revenue Model: Hybrid Strategies Capture Wallet Share
Pure subscription access, while transparent, leaves revenue on the table once a player exhausts must-try titles. Hybrid models blend flat-rate libraries with optional season passes, cosmetics, or expansion packs, achieving higher average revenue per user without alienating cost-sensitive audiences. Publishers reap diversified income streams while giving subscribers the choice to spend more for cosmetic prestige or stick to included content. Regulatory scrutiny dampens the appeal of randomized loot boxes, favoring non-gambling add-ons such as fixed-price battle passes.
In practice, services gate certain samplers behind a subscription wall and then monetize additional DLC through one-off fees. The subscription-based gaming market thereby mirrors evolving film and music ecosystems where base access is table stakes and premium tiers unlock exclusive perks. As cross-media franchises rise, expect synergistic bundles that fuse games with comics, film, and physical merchandise, widening the canvas for hybrid monetization.
Geography Analysis
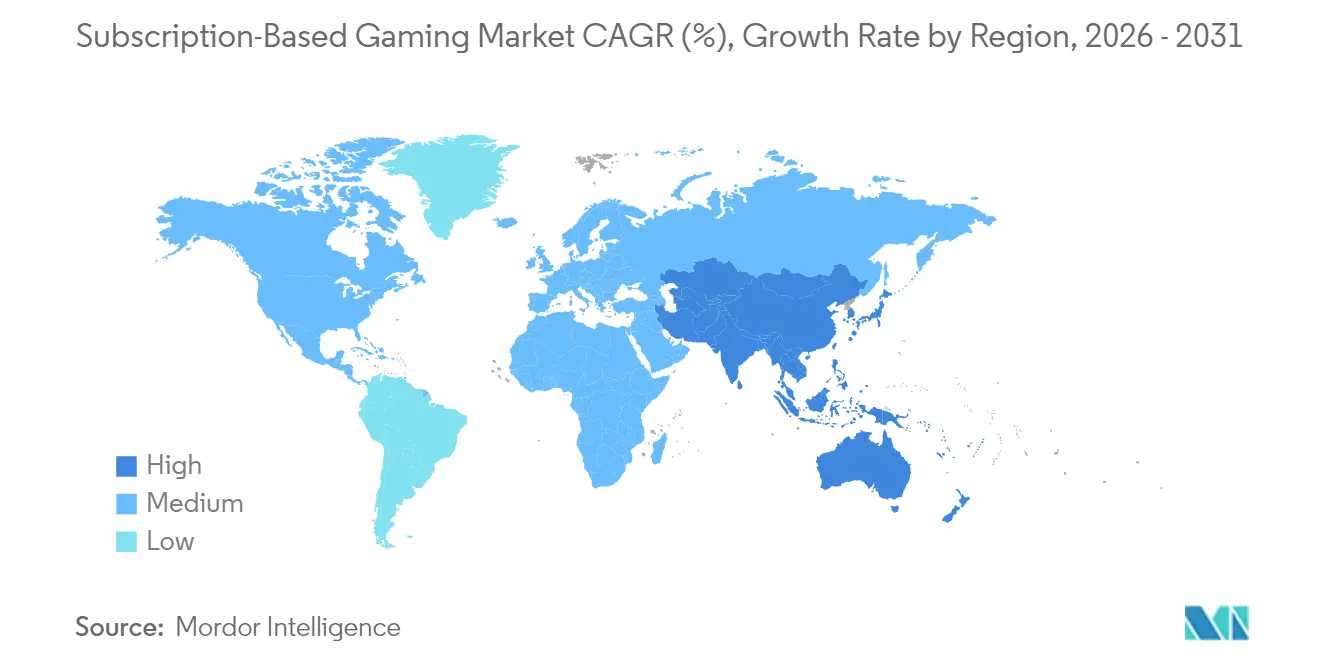
North America generated 72.35% of 2025 revenue and continues to anchor the subscription-based gaming market owing to universal broadband, high console ownership, and frictionless digital wallets. Cross-platform account syncing is near standard, reinforcing ecosystem stickiness and justifying higher monthly pricing. Canada shows above-average family-plan penetration and benefits from favorable exchange rates that stretch purchasing power. Regulatory focus remains light compared with Europe, yet probes into app-store commissions and child protections may reshape fee economics.
Asia-Pacific recorded the fastest 10.6% CAGR and will add the largest absolute subscriber count through 2031. Smartphone ubiquity gives mobile the edge, while telco bundles combined with direct carrier billing unlock segments historically outside the banking system. Indonesia, India, and Vietnam exemplify this trajectory, with gaming time in Southeast Asia rising 53% during 2024. Japan, though more mature, leads in loyalty-program integrations that tie point systems to subscription renewals. China remains complex: domestic titans Tencent and NetEase dominate, yet regulatory caps on screen time and foreign content approvals temper growth. Europe stands as a mature yet policy-shifting territory; Belgium and Netherlands restrict loot-boxes, encouraging publishers to pivot to service passes. Localization in languages, payment preferences, and content ratings increases operational cost, but successful adaptation yields durable positions in a region with high average revenue per user. Latin America is an emerging prize: Brazil’s volume of downloads paired with improved payment rails signals readiness for broader subscription uptake. Africa, with the gaming market hitting USD 1.8 billion in 2024, shows 12.4% annual growth, 90% of which is mobile-driven, indicating a greenfield scenario for bundle-centric offerings

Regulatory Landscape
Regulation affecting subscription-based gaming increasingly targets monetization transparency, consumer subscription terms, and child protection, which is pushing a shift away from randomized loot boxes toward recurring passes and fixed-price add-ons. In Europe, loot-box restrictions in countries such as Belgium and the Netherlands continue to pressure publishers to re-balance revenue models. In the United Kingdom, the Digital Markets, Competition and Consumers Act introduced stronger subscription-related consumer-law enforcement from April 2025, with penalties that can reach up to 10% of global turnover for non-compliance.
Policy attention is also moving toward algorithmic curation and interface design, including how these choices can shape purchasing and engagement. The EU AI Act adds governance requirements for certain recommender and moderation systems (documentation, risk classification, and related controls). Legal commentators have flagged the European Commission's planned Digital Fairness Act (tabled timeframe referenced as Q4 2026) as a potential next step on dark patterns and virtual-currency clarity. Outside Europe, child-safety and monetization constraints remain a swing factor across multiple jurisdictions, shaping how subscription platforms design onboarding, parental controls, and in-app purchasing flows.
Value Chain Analysis
The subscription-based gaming value chain starts with game creation and rights ownership (first-party studios, third-party publishers, and licensors), then moves into aggregation and merchandising by platform holders that curate libraries and negotiate content terms. Monetization relies primarily on periodic subscription fees recognized over the subscription period (consistent with the accounting policies described by large platform owners in public reporting), supplemented by hybrid add-ons such as DLC or fixed-price cosmetics. Delivery splits across download-to-device and cloud streaming stacks, using identity services, entitlement management, recommendation engines, anti-cheat, and live-ops toolchains to support cross-platform play and retention.
Distribution and payments influence unit economics. Console storefronts and mobile app stores act as key gatekeepers, while telco bundles and carrier billing expand reach in markets with lower card penetration. Infrastructure partners, including cloud providers, CDNs, and edge compute, affect costs and experience for streaming. Device and OS ecosystems also constrain pricing flexibility through commission policies. Operationally, platform owners manage compliance and procurement expectations across the supply base, including via Nintendo CSR Procurement Guidelines for business partners, reflecting broader requirements around legal compliance, safety, and responsible sourcing that increasingly accompany global digital services.
Competitive Landscape
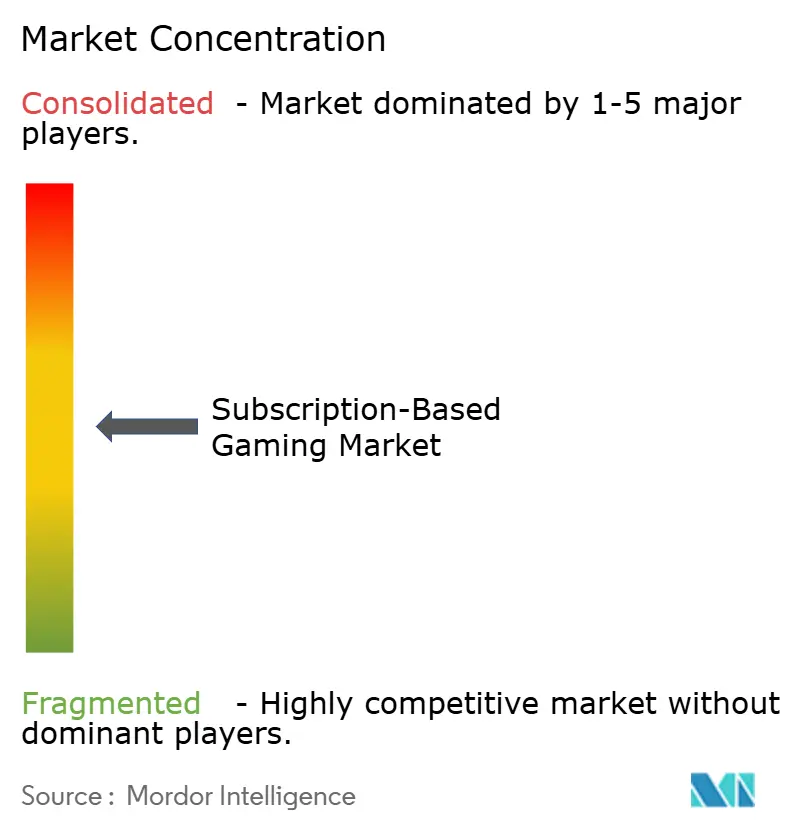
The subscription-based gaming market features moderate concentration where ecosystem giants leverage exclusives and deep wallets to secure day-one launches. Microsoft devotes more than USD 1 billion each year to Game Pass content, ensuring a steady cadence of high-profile titles that sustain engagement. Sony counters with a tiered PlayStation Plus that layers cloud streaming, classic libraries, and discounted add-ons to retain its console audience. Nintendo remains selective, channeling a curated catalog into its Online Expansion Pack and banking on first-party nostalgia.
Outside the console triumvirate, Netflix has inserted itself by offering 70 mobile titles as part of a broader entertainment package, evidencing the blurring lines between media verticals. Xsolla’s acquisition of AcceleratXR highlights the importance of infrastructure that supports cross-platform portability and frictionless payments. Meanwhile, GameSquare’s merger with FaZe Clan demonstrates how esports influence and creator networks can amplify subscriber acquisition funnels.[3]Xsolla, “Gaming and Payments in Asia,” xsolla.com
Smaller hopefuls either occupy niche lanes—retro arcades, indie-only selections—or exit the field under scale pressure, as illustrated by Utomik’s 2025 shutdown. Telco-backed entrants emerge in Africa and Southeast Asia, wielding billing integration and zero-rating data allowances as competitive wedges. Over the medium term, competitive advantage will hinge on proprietary IP, AI-driven personalization, and cross-media franchises that extend beyond pure gameplay. For consumers, the escalating battle promises richer catalogs and bundled perks, reinforcing the appeal of the subscription-based gaming market.
Subscription-Based Gaming Industry Leaders
Microsoft Corporation (Xbox Game Pass)
Sony Group Corporation (PlayStation Plus)
Nintendo Co., Ltd. (Nintendo Switch Online)
Apple Inc. (Apple Arcade)
Electronic Arts Inc. (EA Play)
- *Disclaimer: Major Players sorted in no particular order

Market Opportunities and Future Outlook
Opportunity clusters around deterministic monetization and compliance-forward design, as regulators scrutinize random-outcome mechanics and subscription practices. Subscriptions, battle passes, and direct cosmetic purchases provide a clearer value exchange than loot boxes and reduce exposure to enforcement actions tied to consumer protection and children's issues, consistent with the report observation that tightening loot-box caps are pushing spend toward recurring models. Product and pricing actions by leading platforms also indicate ongoing experimentation to defend perceived value at scale, including Microsoft's changes to Xbox Game Pass pricing in April 2026, alongside continued investment in day-one titles and library breadth.
A second whitespace is in distribution and payments, particularly in mobile-first and underbanked geographies where carrier billing and telco bundles reduce friction. The report already highlights Indonesia, India, and Nigeria as markets where carrier billing can unlock large prepaid user pools and where bundled connectivity plus a game pass supports adoption. This creates room for partnerships that combine localized payments, QoS-aware delivery for cloud and hybrid play, and multi-profile family tiers. On the supply side, rising content-licensing costs reinforce the incentive to build proprietary IP, secure longer-duration rights, and improve personalization and discovery so platforms can monetize broader catalogs without continuously escalating third-party acquisition spend.
Recent Industry Developments
- July 2026: Sony Group Corporation: PlayStation Plus game catalog for July 2026 updated with Avatar Frontiers of Pandora and Rise of the Ronin. Catalog expansion for PS Plus. Enhanced subscriber engagement and retention across platforms.
- July 2026: Microsoft Corporation: Xbox Game Pass added Winds of Arcana: Ruination and Gears of War: Reloaded. Library expansion for Game Pass. Strengthened platform stickiness and potential subscriber growth.
- June 2026: Microsoft Corporation: Xbox Game Pass June 2026 wave-2 expands library. Mid-year library expansion for Game Pass. Improved value proposition to retain and grow subscribers.


Research Methodology Framework and Report Scope
Market Definition and Coverage
This market covers revenue earned from paid subscription plans that give users recurring access to a library of video games or game access benefits across console, PC, and mobile, including cloud streaming and download-to-device delivery.
Scope exclusions: One-time game purchases and standalone in-game item spending are excluded unless they are bundled into a subscription plan price.
Segmentation Overview
- By Gaming Type
- Console Gaming
- PC-based Gaming
- Mobile Gaming
- By Platform Type
- Cloud Streaming
- Download-to-Device
- By Subscription Tier
- Basic
- Premium
- Family/Group
- By End-User Demographic
- Gen Z (10-24 yrs)
- Millennials (25-40 yrs)
- Gen X and Older (41+ yrs)
- By Revenue Model
- Pure-play Subscription
- Hybrid (Subscription + Micro-transactions)
- By Geography
- North America
- United States
- Canada
- South America
- Brazil
- Argentina
- Rest of South America
- Europe
- Germany
- United Kingdom
- France
- Russia
- Rest of Europe
- Asia Pacific
- China
- Japan
- South Korea
- India
- Rest of Asia Pacific
- Middle East
- United Arab Emirates
- Saudi Arabia
- Rest of Middle East
- Africa
- South Africa
- Rest of Africa
- North America
Data Sources, Market Sizing, and Validation
Desk Research
Desk research was used to map the addressable subscription gaming revenue pool and to ground the model in observable signals that can be checked year over year. We typically start with published statistics and measurement notes from sources such as the ITU (broadband and mobile connectivity), the World Bank (macro indicators and household spend context), OECD (digital economy indicators), UN Comtrade (device and console trade flows as a supporting proxy), and regulator releases where subscription billing or consumer protection rules affect pricing and churn.
On the industry side, we review platform and publisher financial disclosures, annual reports, investor decks, and earnings call transcripts to understand how subscription revenue is reported and what is bundled into it. We also use paid databases for company financials and intelligence, news and financials, and patent databases to cross-check service rollouts, content investment cycles, and regional expansion timing. The sources listed here are illustrative only, and other public and paid references were used for data collection, validation, and clarification.
Primary Interviews and Surveys
Primary work was done to pressure-test the subscription revenue logic, particularly where public reporting mixes bundles, promotions, or hybrid monetization. We spoke with executives and operating leaders across subscription service operators, publishers, payment and billing partners, and channel specialists, then used short surveys to confirm pricing ranges, churn patterns, and bundle attachment by region. Because adoption differs by device and connectivity, inputs were validated across APAC, EMEA, and the Americas before assumptions were finalized.
Distribution of primary research fieldwork respondents
| Company type | Respondent position | Region |
|---|---|---|
| Top tier: 35% | CXOs: 20% | APAC: 39% |
| Mid tier: 44% | Functional/Unit leaders: 25% | EMEA: 37% |
| Smaller Players: 21% | Managers: 55% | Americas: 24% |
Market-Sizing & Forecasting
Sizing is built using a combined top-down and bottom-up logic so the totals stay realistic even when disclosure is uneven. First, a top-down demand pool is reconstructed by estimating paid subscriber counts by region and platform, and then applying average monthly price and effective paid months, which are adjusted for bundles, promotions, and family plans that dilute reported list prices.
To keep the model tied to market fingerprints, inputs are guided by indicators such as broadband and 5G availability, active gamer base trends, subscription price ladders by tier, cloud streaming take-up, and the cadence of major content drops that can lift sign-ups and reduce churn. Selective bottom-up approximations are then used as a cross-check, including sampled plan price x estimated subscribers for key services, along with channel checks on bundle penetration through telcos and device ecosystems. Where bottom-up detail is missing for smaller regions, gaps are handled through proxy adoption curves, then scaled back to match observable connectivity and spending capacity.
For forecasting, scenario analysis is used with a base case anchored to expected subscriber growth, pricing progression (including discount normalization), and content investment signals. Downside and upside paths reflect slower or faster cloud streaming adoption and changes in bundle intensity. The final forecast is reviewed with primary respondents so the growth curve matches what operators and publishers are budgeting for over the next few years.
Data Validation & Update Cycle
Validation is done through triangulation across independent checks, so no single source drives the outcome. We compare model outputs against platform disclosures, regional connectivity trends, and other demand signals, then run variance checks to spot step-changes that do not align with known launches, price moves, or reporting shifts.
Before sign-off, the work goes through multi-step analyst review, where assumptions are challenged and recalculated using alternative inputs to confirm stability. If a large variance appears, respondents are re-contacted to clarify whether it comes from bundling, currency conversion timing, or a real change in subscriber behavior. Reports are refreshed annually, with interim updates when material events occur, and a final pre-delivery review is completed so clients receive the latest view.
Mordor Intelligence's Global Subscription Based Gaming Market Size Compared With Other Published Estimates
Published numbers for subscription-based gaming can look far apart because the underlying counting rules are not consistent across sources, even when the topic sounds similar. Differences usually come from what gets counted as subscription revenue, how cloud streaming is treated, and whether in-game or single-title subscriptions are mixed into the same total.
The main gap comes from whether in-game and single-game subscriptions are included in the same revenue pool, where Mordor Intelligence counts only paid subscription plans that provide catalog access benefits across devices (including cloud streaming and download-to-device) and then normalizes for discounting and bundle attachment that can compress realized pricing.
Benchmark comparison
| Source | Market Size | Gaps in Research Methodology |
|---|---|---|
| Mordor Intelligence | USD 13.10 B (2026) | |
| Trade Journal A | USD 19.00 B (2024) | Uses a broader game subscription definition that can include in-game or single-title subscriptions, and the year basis differs, which can lift the apparent total when compared against a later base year with normalized pricing. |
| Industry Publisher B | USD 15.50 B (2025) | Often reflects a platform-inclusive view across many subscription types and relies on longer-horizon projections, which can carry forward list pricing without fully adjusting for bundles, promotions, and family plans that reduce realized revenue per paid user. |
Taken together, the spread is mainly explained by scope and year alignment, followed by how pricing is converted from list plans to realized revenue. By keeping the counting rules tied to paid plan value, observed adoption signals, and repeatable price and churn assumptions, the resulting estimate stays transparent and easier to audit over time.


Key Questions Answered in the Report
What is the projected value of the subscription-based gaming market by 2031?
The market is expected to reach USD 20.38 billion by 2031, expanding at a 9.25% CAGR
Which region is growing fastest for subscription-based gaming?
Asia-Pacific is pacing an 10.6% CAGR through 2031, driven by mobile-first usage and telco bundles.
Why are family subscription tiers gaining popularity?
Family plans offer shared access for multiple users at up to 60% cost savings, boosting household penetration and retention.
How do regulatory actions affect subscription growth?
Restrictions on loot-boxes in Europe and parts of Asia push publishers toward transparent recurring revenue, benefiting subscription adoption.
Which platform model is growing faster, download or cloud streaming?
Cloud streaming is expanding at an 11.05% CAGR as 5G and edge computing improve latency, though downloads still dominate revenue today.
Page last updated on:






