
Market Overview
| Study Period | 2020 - 2031 |
|---|---|
| Market Size (2026) | USD 77.53 Billion |
| Market Size (2031) | USD 95.49 Billion |
| Growth Rate (2026 - 2031) | 4.25 % |
| Fastest Growing Market | Asia-Pacific |
| Largest Market | North America |
| Market Concentration | Low |
Major Players *Disclaimer: Major Players sorted in no particular order Image © Mordor Intelligence. Reuse requires attribution under CC BY 4.0. | |
Strategic Consulting Services Market Analysis by Mordor Intelligence
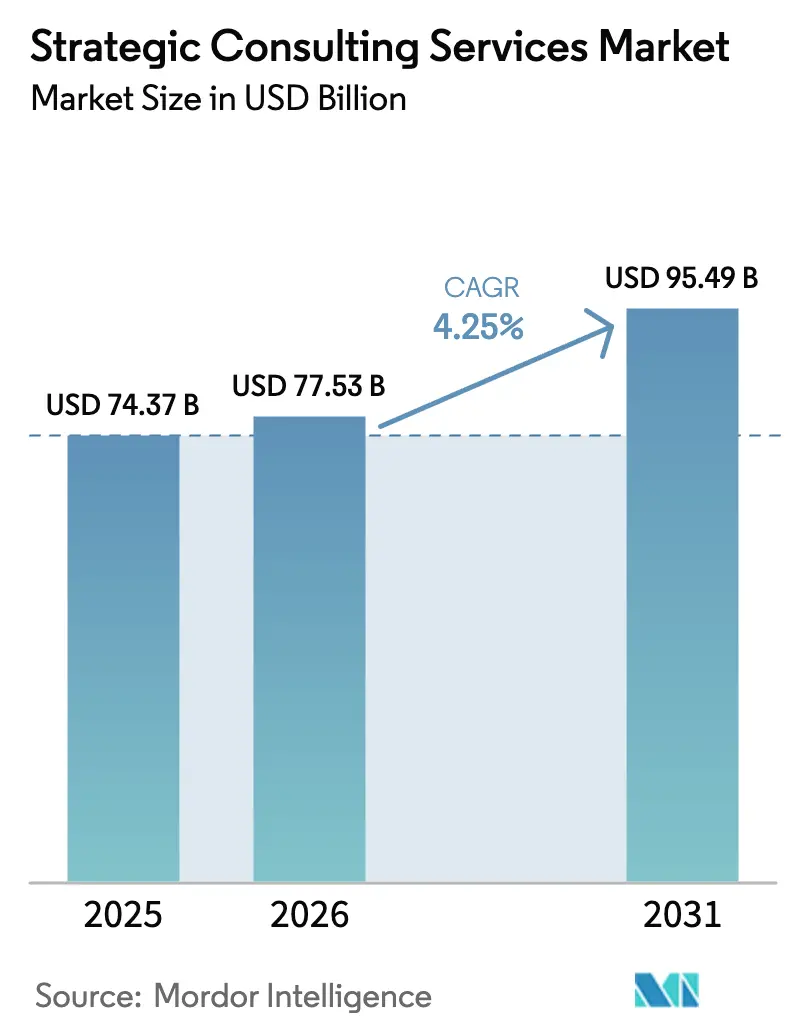
The strategic consulting services market size is expected to grow from USD 74.37 billion in 2025 to USD 77.53 billion in 2026 and is forecast to reach USD 95.49 billion by 2031 at 4.25% CAGR over 2026-2031. The measured growth reflects a maturing sector navigating widespread artificial-intelligence deployment, proliferating regulatory requirements, and rising client expectations for outcome-based engagements. Enterprise digital-transformation budgets remain the primary catalyst, with 72% of digital leaders planning higher 2025 spending that channels advisory demand toward AI governance and change-management roadmaps.[1] In parallel, the global M&A pipeline swelled to nearly USD 3.5 trillion in 2024, increasing complexity in cross-border integrations and fueling transaction advisory revenue streams.[2] Competitive intensity is elevated as boutique specialists, independent freelancers, and AI-powered platforms erode the historic dominance of large firms. These pressures are accelerating outcome-based pricing adoption, platform-enabled delivery, and talent model reinvention across the strategic consulting services market.
Key Report Takeaways
- By service type, functional strategy consulting commanded 38.22% of strategic consulting services market share in 2025, while digital strategy consulting recorded the fastest 4.67% CAGR through 2031.
- By organization size, large enterprises held 62.32% of the strategic consulting services market in 2025, whereas small enterprises are projected to grow at a 5.28% CAGR to 2031.
- By engagement model, project-based advisory accounted for 54.05% of the strategic consulting services market size in 2025, and outcome-based consulting is expanding at a 5.15% CAGR over the forecast period.
- By end-user industry, financial services led with 29.63% revenue share in 2025 in the strategic consulting services market and healthcare and life sciences is expected to exhibit the highest growth momentum through 2031.
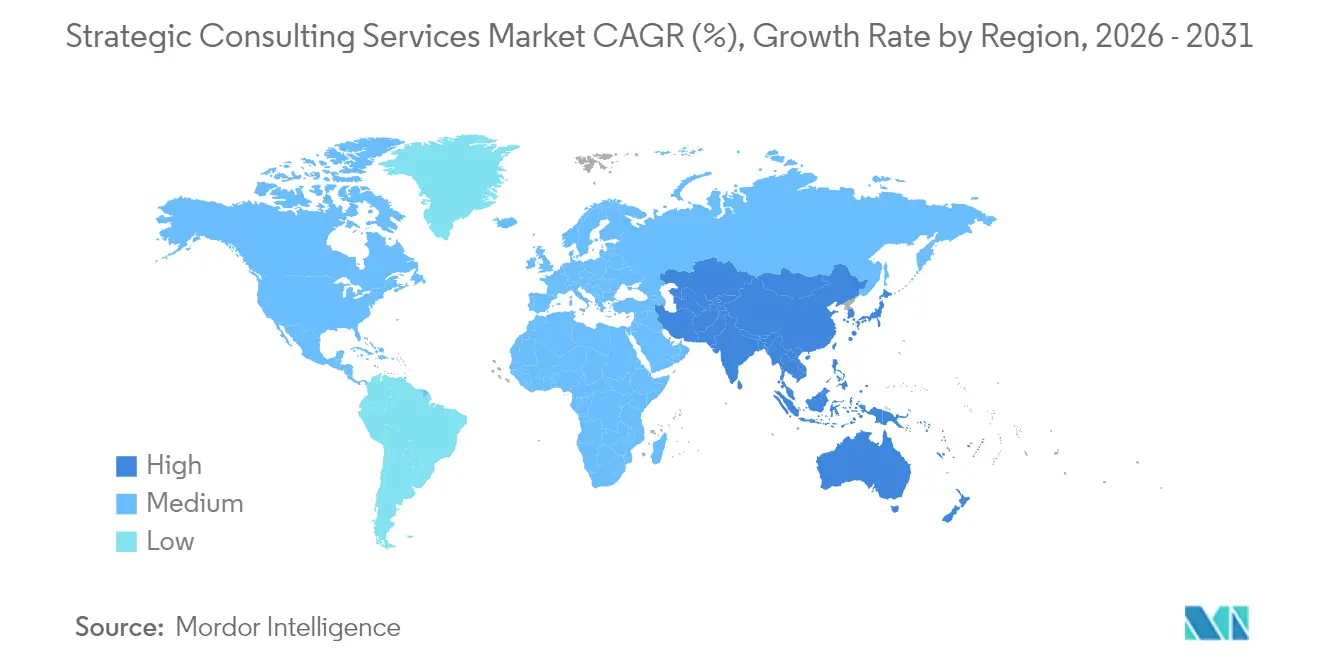
- By geography, North America captured 36.55% share of the strategic consulting services market in 2025, while Asia Pacific is forecast to post the strongest 4.82% CAGR between 2026 and 2031.
Note: Market size and forecast figures in this report are generated using Mordor Intelligence’s proprietary estimation framework, updated with the latest available data and insights as of 2026.
Market Trends and Insights
Drivers Impact Analysis of Strategic Consulting Services Market*
| Driver | (~) % Impact on CAGR Forecast | Geographic Relevance | Impact Timeline |
|---|---|---|---|
| Digital-transformation spend by enterprises | +1.2% | Global, with APAC and North America leading | Medium term (2-4 years) |
| Rising global M&A pipeline and integration complexity | +0.8% | North America and Europe, spill-over to APAC | Short term (≤ 2 years) |
| Regulatory and compliance proliferation across regions | +0.6% | Global, with EU and North America core | Long term (≥ 4 years) |
| SME demand for external strategic expertise | +0.5% | Global, with emerging markets acceleration | Medium term (2-4 years) |
| Generative-AI governance and strategy mandates | +0.4% | North America and EU, expanding to APAC | Short term (≤ 2 years) |
| Geopolitical fragmentation driving near-shoring strategies | +0.3% | Global, with supply chain-dependent regions | Long term (≥ 4 years) |
| Source: Mordor Intelligence | |||
Digital-Transformation Spend by Enterprises
Enterprise investment in digital overhauls sustains advisory pipelines as organizations grapple with cloud migration, AI adoption, and broad operating-model redesign. IT services outlays climbed to USD 1.52 trillion in 2024, a 9.7% rise that translated into higher demand for consultants capable of bridging strategic road-mapping with implementation. Consulting firms are now monetizing premium AI-strategy engagements, coupling governance frameworks with workforce-reskilling programs. Digital leaders, those already capturing value from analytics, are 72% likelier to lift 2025 transformation budgets, ensuring recurring advisory revenue. Yet generative-AI tooling increasingly automates baseline research, compelling firms to shift junior talent toward synthesis, change-management, and client enablement. The dynamic pressures firms to elevate value-creation narratives while controlling cost structures through proprietary AI platforms.
Rising Global M&A Pipeline and Integration Complexity
Deal advisory momentum strengthened as worldwide transaction value neared USD 3.5 trillion in 2024, expanding 15% year over year and intensifying demand for strategy consultants skilled in diligence and integration. Cross-border deals face heightening regulatory scrutiny, data-sovereignty rules, and cultural integration hurdles, pushing firms to deploy AI-enabled diligence tools that compress document-review cycles by 30%. Geopolitical uncertainty adds strategic-scenario requests on antitrust clearances and stakeholder communications. Technology and healthcare deals, governed by specialized regulations, further boost advisory workloads among firms holding deep sector expertise. As private-equity dry powder persists, consultants expect a steady pipeline of carve-out and platform-roll-up assignments through 2026.
Regulatory and Compliance Proliferation Across Regions
Ever-evolving rulesets, spanning the EU’s AI Act, DORA resilience mandates, and Basel III capital standards, force organizations to seek external expertise. Consulting demand intensifies in financial services, where overlapping obligations necessitate risk-mitigation roadmaps and operational-resilience testing. Healthcare clients require navigation of FDA digital-therapeutics guidelines and value-based-care reimbursement frameworks. ESG reporting has become a compliance priority for energy and manufacturing players planning decarbonization and renewables investment. Firms with regulatory-focused practices monetize premium day rates and multi-year managed-compliance contracts. The fragmented regulatory landscape also raises barriers to entry, advantaging incumbents with established relationships across supervisory authorities.
SME Demand for External Strategic Expertise
Small and midsize companies now tap fractional consulting models to close capability gaps caused by accelerated technology disruption. SME-oriented engagements are forecast to grow at 5.45% CAGR, driven by AI adoption hurdles, digital-commerce pivots, and succession-planning needs that exceed in-house capacity. Independent consultants and specialized boutiques win share by offering bespoke solutions at competitively lower cost than large firms. Outcome-based pricing resonates with budget-constrained owners, aligning fees with realized performance improvements. Despite shorter project cycles and smaller ticket sizes, scalable delivery frameworks and SaaS-enabled toolkits allow providers to defend profitability.
Restraints Impact Analysis of Strategic Consulting Services Market*
| Restraint | (~) % Impact on CAGR Forecast | Geographic Relevance | Impact Timeline |
|---|---|---|---|
| Expansion of in-house strategy teams | -0.7% | Global, with large enterprises in North America and Europe leading | Medium term (2-4 years) |
| Talent drain to the independent consultant economy | -0.4% | North America and Europe core, spill-over to APAC | Short term (≤ 2 years) |
| Procurement-led fee pressure and outcome pricing | -0.3% | Global, with mature markets experiencing highest pressure | Medium term (2-4 years) |
| DIY-strategy analytics enabled by Gen-AI tools | -0.2% | North America and Europe early adoption, expanding globally | Long term (≥ 4 years) |
| Source: Mordor Intelligence | |||
Expansion of In-House Strategy Teams
Large corporations increasingly recruit ex-consultants to head internal strategy units, reducing reliance on external advisors. AI-augmented analytics platforms now equip internal teams to replicate baseline market-research tasks, challenging firms to justify premium fees. Consultants respond by emphasizing implementation rigor, change-leadership expertise, and objective viewpoint. Hybrid engagement models that blend in-house capabilities with external specialization are emerging, though margins tighten as clients negotiate scope faster and insist on knowledge transfer.
Talent Drain to the Independent Consultant Economy
The freelance shift siphons seasoned principals and partners into the USD 1.5 trillion skilled-independent economy, where 54% claim advanced AI proficiency.[3] Departing leaders leverage established relationships to compete directly, often undercutting legacy-firm pricing. Traditional firms counter with higher remuneration, equity schemes, and flexible work policies, but retention remains a structural risk. Client perception of equal expertise at lower cost further intensifies pricing pressure on bundled firm offerings.
*Our forecasts treat driver/restraint impacts as directional, not additive. The impact forecasts reflect baseline growth, mix effects, and variable interactions.
Strategic Consulting Services Market Segment Analysis
By Service Type:
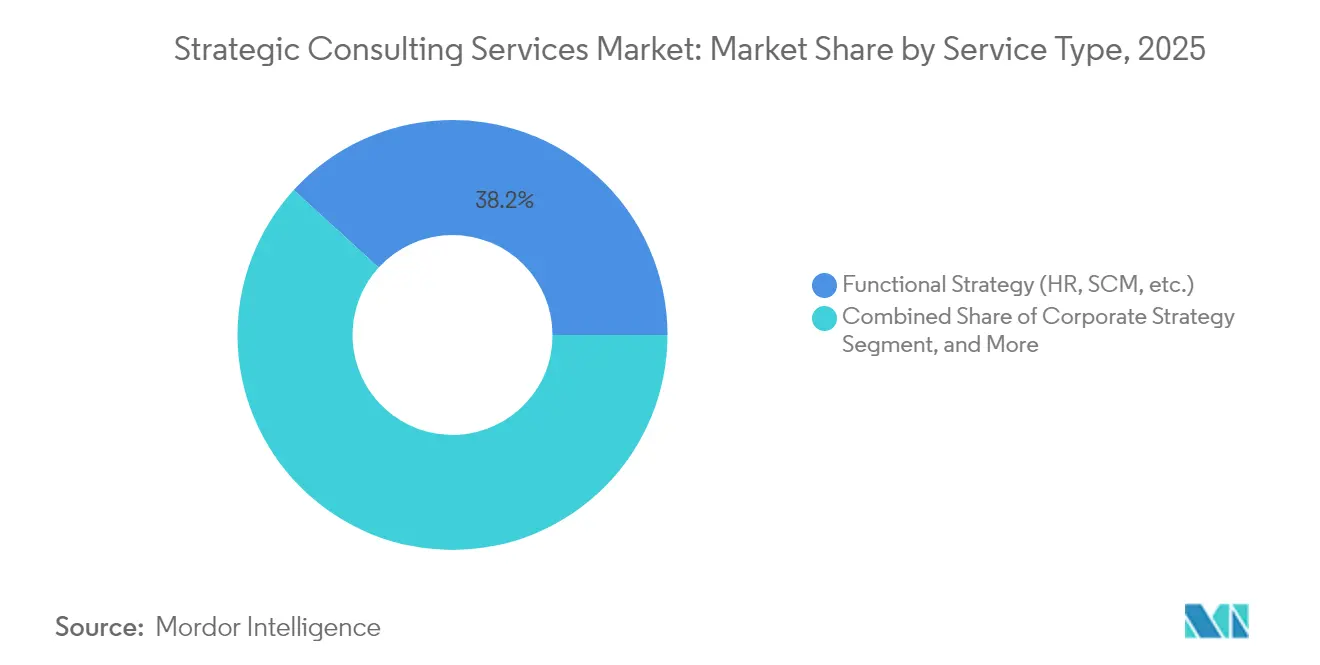
Digital Strategy Drives GrowthFunctional strategy services dominated 2025 revenue with 38.22% strategic consulting services market share, encompassing HR restructuring, supply-chain optimization, and lean-operations programs. Demand persists as core efficiency agendas remain board priorities. Digital strategy, however, is the fastest-expanding niche at a 4.67% CAGR, fueled by AI-integration roadmaps, data-monetization blueprints, and cloud-migration synchronization with business objectives. M&A and corporate-finance advisory also ride the elevated deal cycle, while economic-policy strategy grows as clients seek geopolitical risk hedging.
Digital-first work requires consultants to deliver technology and business acumen concurrently, changing talent mixes toward data scientists and product managers. Boutique specialists exploit the complexity by targeting single-domain pain points, challenging full-service incumbents. To protect share, global firms package multi-disciplinary “one-stop” offerings and invest in proprietary AI tools that compress research cycles and elevate synthesis quality.

By Organization Size:
SME Growth AcceleratesLarge enterprises retained a commanding 62.32% revenue contribution in 2025, leveraging consultants for global transformation, regulatory programs, and portfolio-diversification moves. Yet small enterprises are generating the strongest 5.28% CAGR as democratized access to cloud-based advisory platforms compresses traditional cost barriers. The strategic consulting services market size for SME engagements is projected to eclipse USD 20 billion by 2031, reflecting a broadening client base as digital literacy improves.
Providers now emphasize modular playbooks and templated project artifacts to keep scope lean and pricing transparent. Independent consultants thrive in this space, often partnering with SaaS vendors to blend technology and advisory into subscription bundles. The shift forces large firms to establish dedicated mid-market units with right-sized delivery models to preserve future growth.
By Engagement Model:
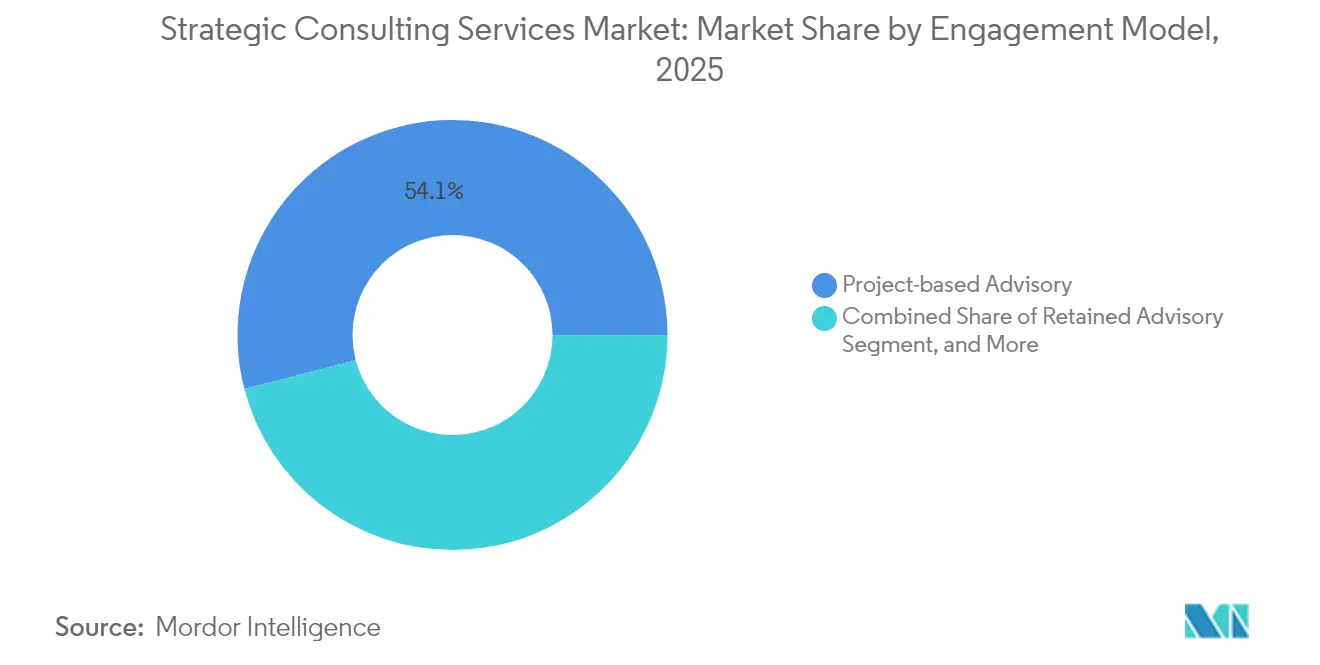
Outcome-Based Models Gain MomentumProject-based work still produced 54.05% of 2025 billings, sustaining its role as the standard contracting format for discrete strategy questions. The strategic consulting services market size for outcome-based agreements is, however, set to climb swiftly on a 5.15% CAGR, mirroring client insistence on measured value realization. Such contracts peg fees to EBITDA upticks, cost-savings milestones, or revenue-growth thresholds, transferring risk to advisors but offering upside when goals are exceeded.
Digital-platform delivery supplements both models by automating data collection, benchmarking, and progress tracking, enabling real-time visibility into engagement outcomes. Managed-services models also gain appeal as clients offload end-to-end functions, such as regulatory reporting, under multi-year contracts. Providers that mature measurement frameworks and accept variable compensation stand to capture loyalty premiums.
By End-User Industry:
Financial Services Leads DemandFinancial institutions accounted for 29.63% of 2025 revenue as regulatory reforms, DORA, Basel III, and emerging AI mandates, mandated seasoned compliance counsel. The strategic consulting services industry is further buoyed by fintech disruptions and open-banking rollouts that require holistic digital-platform strategies. Healthcare and life sciences represent the fastest-advancing vertical on the back of accelerated R&D digitization, AI-supported clinical-trial orchestration, and value-based-care models.
Technology, media, and telecom assignments focus on platform-design and cybersecurity resilience, whereas energy clients seek ESG-aligned transition planning. Government demand grows around digital-services modernization and policy-impact assessment. Consultants with sector-specific data sets and regulatory credentials are best placed to secure repeat mandates.
Geography Analysis
North America Strategic Consulting Services Market
North America retains leadership owing to deep client pockets, complex regulatory architectures, and record M&A activity that collectively sustain advisory pipelines. Financial-services firms pursue operational-resilience programs under DORA guidelines, while technology giants demand AI-ethics playbooks. Defense-sector contract scrutiny poses a downside threat, with federal reviews potentially curbing consulting spend.
APAC Strategic Consulting Services Market
Asia Pacific is the fastest-growing market, buoyed by government digitalization schemes, mid-market enterprise expansion, and infrastructure megaprojects. China drives demand through tech-sovereignty initiatives and diversification strategies, whereas India’s digital-payments and public-sector modernization create steady advisory flows. Japan and Australia sustain mature spend profiles emphasizing operational excellence and advanced-manufacturing transformation.
Europe Strategic Consulting Services Market
Europe offers resilient opportunity anchored in regulatory-compliance advisory, sustainability road-mapping, and cross-border integration support. Germany’s industrial base underpins Industry 4.0 consulting, the U.K. leverages financial-services depth, and France, Netherlands, and the Nordics add steady demand for digital-operations modernization. BCG’s 2024 launch of a dedicated Center for Geopolitics signals continued emphasis on macro-risk counsel
Regulatory Landscape
Strategic consulting services demand is shaped by a rapidly changing compliance environment covering AI governance, cyber resilience, financial regulation, and sector-specific oversight. In Europe, the EU AI Act and NIS2 Directive are moving through active enforcement across 2025-2026, increasing requirements around risk management, security controls, and documentation for high-risk AI and critical-entity operations, while also raising client needs for third-party assurance, operating-model redesign, and compliance-by-design programs. In financial services, DORA resilience mandates and Basel III capital standards continue to drive multi-workstream advisory work across governance, controls testing, vendor risk, and operational resilience.
Telecom and digital infrastructure policy has also become more security-focused, which adds complexity to cross-border operating models. In the United States, an April 10, 2026 Federal Register notice reflects FCC action requiring certain license holders to attest to foreign adversary ownership or control, reinforcing national-security screening and compliance for regulated connectivity assets. Separately, the European Commission’s 2026 Digital Networks Act proposal seeks to consolidate multiple frameworks, including the EECC and related instruments, into a more unified rule set. That shift increases the value of consulting support for regulatory readiness, program management, and stakeholder engagement across multi-country deployments.
Competitive Landscape
Incumbent strategy houses, McKinsey, BCG, and Bain, maintain brand primacy but confront mounting share erosion from Big Four multifaceted offerings, sector-focused boutiques, and a surging independent-talent pool. Proprietary AI platforms, such as McKinsey’s “Lilli,” integrate a century of intellectual property to cut delivery cycles, improving margin leverage on fixed-fee contracts.[4] BCG’s “Deckster” automation engine and Bain’s Vector digital suite follow similar trajectories.
Boutiques differentiate through hyper-specialization, cyber-resilience, AI risk, climate-strategy, and capturing clients that favor depth over scale. Independent consultants generated USD 1.5 trillion in 2024, illustrating a meaningful wallet shift toward flexible expertise. Outcome-based contracting and digital-first delivery compress cost structures, placing further pressure on traditional billable-hour economics.
Firms expanding into the managed-services space secure annuity revenue while reinforcing technology partnerships across cloud, analytics, and cybersecurity vendors. Accenture’s acquisition of Maryville Consulting Group in July 2025 exemplifies portfolio deepening aimed at end-to-end transformation stewardship. As AI commoditizes baseline analysis, sustained differentiation will hinge on proprietary data assets, domain-specific accelerators, and measurable value delivery.
Strategic Consulting Services Industry Leaders
-
Ernst & Young Global Limited
-
Accenture plc
-
Deloitte Consulting LLP
-
Boston Consulting Group, Inc.
-
Bain & Company, Inc.
- *Disclaimer: Major Players sorted in no particular order

Strategic Consulting Services Market Companies Covered in this Report
- McKinsey and Company, Inc.
- Boston Consulting Group, Inc.
- Bain & Company, Inc.
- Deloitte Consulting LLP
- Accenture plc
- Kearney, Inc.
- Ernst and Young Global Limited (EY-Parthenon)
- PricewaterhouseCoopers Advisory Services LLC (Strategyand)
- KPMG International Limited
- Booz Allen Hamilton Holding Corporation
- IBM Consulting (International Business Machines Corporation)
- Capgemini SE
- Roland Berger Holding GmbH
- Oliver Wyman Inc.
- L.E.K. Consulting LLC
- Arthur D. Little S.A.
- Alvarez and Marsal Holdings, LLC
- Infosys Consulting Ltd.
- Cognizant Technology Solutions Corporation
- CGI Inc.
- Tata Consultancy Services Limited (TCS Consulting)
Market Opportunities and Future Outlook
AI governance and AI-enabled operating transformation are creating measurable white space for strategic consultancies that can connect strategy, risk, and implementation. Clients are expanding requirements from AI ideation to enterprise-wide control frameworks, secure deployment, and change management as EU AI Act and NIS2 enforcement progresses through 2025-2026. This supports demand for services spanning model-risk management, cybersecurity, data governance, and workforce redesign, particularly among regulated end users such as financial services (29.63% share in 2025) and in sectors with complex digital ecosystems.
There is also visible growth in platform-enabled delivery and co-innovation models aimed at moving clients from experimentation to production. That progression creates room for providers with repeatable assets, cloud alliances, and stronger outcome measurement. For example, EY and Microsoft announced a global initiative in May 2026 to help clients scale AI enterprise-wide, and Deloitte and Google Cloud announced an AI Studio in London in late July 2026 to support agentic AI deployment. On the buyer side, tighter procurement and the shift toward outcome-based arrangements improve the fit for providers that can operationalize value tracking, while mid-market specialization and modular offerings remain an opening for firms building dedicated mid-market units and standardized playbooks.
Recent Industry Developments in Strategic Consulting Services Market
- June 2026: Deloitte and Google Cloud to open AI Studio in London to support agentic AI deployment. The collaboration expands AI production capabilities and creates a physical co-innovation hub, broadening the service footprint in AI-enabled transformations.
- April 2026: Accenture commenced review of the proposed acquisition of Ziff Davis' connectivity business including Ookla. Regulatory review could shape timing and scope of network intelligence integration into advisory services, signaling emphasis on real-time network data in consulting offerings.
- March 2026: Accenture reached definitive agreement to acquire Ziff Davis connectivity division including Ookla, Speedtest, Downdetector, Ekahau, and RootMetrics for 1.2 billion USD. The deal adds real-time network intelligence assets to enterprise consulting and reinforces AI-driven, data-backed advisory offerings in TMT and connectivity domains.
Strategic Consulting Services Market Report Scope and Research Methodology
Market Definition and Coverage
This market covers revenues earned from strategic consulting engagements that help organizations set direction and make major choices, such as growth, portfolio, operating model, and transformation priorities. The sizing reflects paid advisory work delivered by consulting providers to private and public sector clients across regions.
Scope exclusions: It excludes routine staff augmentation, outsourced managed services, pure IT implementation without strategy advisory, and internal strategy team costs that are not billed externally.
Segments Covered in This Report
- By Service Type
- Corporate Strategy
- Business-Model Transformation
- MandA and Corporate Finance Strategy
- Digital Strategy and Innovation
- Functional Strategy (HR, SCM, etc.)
- Economic and Policy Advisory
- By Organization Size
- Large Enterprises
- Medium Enterprises
- Small Enterprises
- By Engagement Model
- Project-based Advisory
- Retained Advisory
- Managed / Implementation Services
- Outcome-based / Success-fee Consulting
- Digital / Platform-enabled Consulting
- By End-user Industry
- Financial Services
- Life Sciences and Healthcare
- Technology, Media and Telecom
- Energy and Resources
- Government and Public Sector
- Consumer and Retail
- Industrial and Manufacturing
- Other End-user Industries
- By Geography
- North America
- United States
- Canada
- South America
- Brazil
- Argentina
- Europe
- United Kingdom
- France
- Germany
- Netherlands
- Italy
- Rest of Europe
- Asia Pacific
- China
- India
- Japan
- Australia
- Rest of Asia Pacific
- Middle East and Africa
- Middle East
- Saudi Arabia
- United Arab Emirates
- Rest of Middle East and Africa
- Africa
- South Africa
- Nigeria
- Rest of Africa
- Middle East
- North America
Data Sources, Market Sizing, and Validation
Desk Research
Desk research was used to anchor the model on repeatable public signals, and to keep the definition of strategic consulting revenue consistent across the study. We relied on sources such as the World Bank and IMF for macro context, OECD and national statistics offices for services indicators, the WTO for commercial services concepts used in trade framing, and labor and employment agencies such as the US BLS for professional services employment and wage trends.
On the supply and demand side, we reviewed annual reports, investor presentations, and press releases of large consultancies and diversified professional services firms, plus publications from recognized business associations. We also used paid subscriptions for company financials and intelligence, news and financials, and patent databases to track technology themes that influence advisory demand. These desk sources are illustrative only, and additional public and paid references were used across data collection, validation, and clarification during the study.
Primary Interviews and Surveys
Primary work focused on verifying what clients are actually buying, and how engagements are priced and delivered across regions, since boundaries between adjacent consulting and implementation can be handled differently by providers. We interviewed and surveyed senior executives, practice leaders, and delivery managers across the Americas, EMEA, and APAC, and used their feedback to confirm mix shifts, for example more retainer-based and transformation-linked work, and to adjust assumptions where public reporting was too aggregated.
Distribution of primary research fieldwork respondents
| Company type | Respondent position | Region |
|---|---|---|
| Top tier: 38% | CXOs: 18% | APAC: 47% |
| Mid tier: 43% | Functional/Unit leaders: 25% | EMEA: 29% |
| Smaller Players: 19% | Managers: 57% | Americas: 24% |
Market-Sizing & Forecasting
Sizing started from a top-down reconstruction of the addressable advisory spend, where enterprise services activity and professional services indicators were translated into a strategy-consulting demand pool using penetration and mix assumptions validated in interviews. To keep the model grounded, we then cross-checked totals using selective bottom-up approximations, such as sampled engagement pricing by type and region, capacity and utilization checks from practitioner inputs, and revenue roll-ups for a tracked set of providers with clear service disclosures.
Key inputs that shaped the model included enterprise transformation and restructuring intensity, M&A cycle activity, industry regulation load (which influences strategy and operating model work), region-level wage and billing rate progression, delivery model mix (on-site versus remote), and the share of retainer-based advisory versus project-based work. When the bottom-up view had gaps, we filled missing pieces with conservative ranges tied to observed billing bands and realistic utilization, then normalized back to the demand-led total.
For forecasting, scenario analysis was used with a simple multivariate structure. Revenue growth was linked to macro indicators, corporate investment sentiment, and advisory mix shifts, then adjusted using the consensus from primary experts about pipeline strength by region and industry. Assumptions were kept transparent so a new analyst can recreate the steps and stress test them with updated inputs.
Data Validation & Update Cycle
Outputs were validated through multiple checks, starting with consistency reviews across regions and service boundaries, followed by variance checks against independent signals such as professional services employment trends, disclosed consulting revenue movements, and major deal and restructuring cycles. When a number looked too high or too low relative to these signals, the assumptions were revisited, and when needed, respondents were re-contacted to understand what changed in pricing, utilization, or scope.
Before sign-off, the model and key assumptions go through step-by-step analyst review so calculation errors and definition drift are caught early. Reports are refreshed annually, and interim updates are made when material events meaningfully change demand, pricing, or delivery patterns. Right before delivery, a final pass is completed so clients receive the latest view based on newly available public releases and field feedback.
Mordor Intelligence's Global Strategic Consulting Services Market Estimate Compared With Other Published Estimates
Published market sizes for strategic consulting services can look far apart even when they describe a similar theme, because each publisher draws the service boundary differently and uses different base years. In services, small choices around what counts as advisory revenue, how retainers are treated, and which regions are updated last can move the final number.
Evidence such as provider revenue disclosures, hiring and utilization signals in professional services, and interview-validated billing rate bands are the checks that keep Mordor Intelligence aligned with a realistic, strategy-only demand pool rather than a broader consulting bundle. Other estimates can shift because they fold in adjacent consulting lines, use more aggressive growth scenarios during strong deal cycles, or apply currency conversion timing that does not match the reporting period used for client budgets.
Benchmark comparison
| Source | Market Size | Gaps in Research Methodology |
|---|---|---|
| Mordor Intelligence | USD 74.37 B (2025) | |
| Industry Report A | USD 74.60 B (2025) | This estimate uses a broader definition that explicitly includes adjacent management, operations, and financial advisory consulting categories, which can inflate the total beyond strategy-focused engagements. |
| Press Release B | USD 62.14 B (2024) | This figure is stated for an earlier base year and appears to include additional delivery elements like training and workshops, and its growth profile reflects a higher assumed expansion rate that can change current-year interpolation. |
Seen together, the spread is mainly explained by scope boundaries and timing, not by a disagreement that demand exists. By keeping the counted revenue tied to clearly defined strategy advisory work, and by validating pricing and utilization assumptions through field checks, the estimate stays traceable to inputs that can be updated in a repeatable way.
Key Questions Answered in the Report
What is the current value of the strategic consulting services market?
The market stands at USD 77.53 billion in 2026 and is projected to hit USD 95.49 billion by 2031, growing at a 4.25% CAGR.
Which region is expanding the fastest in strategic consulting?
Asia Pacific is forecast to grow at a 4.82% CAGR through 2031 on the back of large-scale digital initiatives and rising mid-market adoption of advisory services.
Which service line is gaining the most traction?
Digital strategy consulting is the fastest-growing segment, advancing at a 4.67% CAGR as companies prioritize AI governance and technology-integration roadmaps.
How are engagement models evolving?
Outcome-based consulting is advancing on a 5.15% CAGR because clients favor fee structures tied to measurable business results.
What major factor restrains market growth?
The expansion of in-house strategy teams is eroding external spend, exerting a -0.7% drag on forecast CAGR.