
Stationery And Supplies Market Size and Share
Market Overview
| Study Period | 2020 - 2031 |
|---|---|
| Market Size (2026) | USD 160.22 Billion |
| Market Size (2031) | USD 205.64 Billion |
| Growth Rate (2026 - 2031) | 5.11% CAGR |
| Fastest Growing Market | Asia-Pacific |
| Largest Market | Asia Pacific |
| Market Concentration | Medium |
Major Players *Disclaimer: Major Players sorted in no particular order Image © Mordor Intelligence. Reuse requires attribution under CC BY 4.0. | |
Stationery And Supplies Market Analysis by Mordor Intelligence
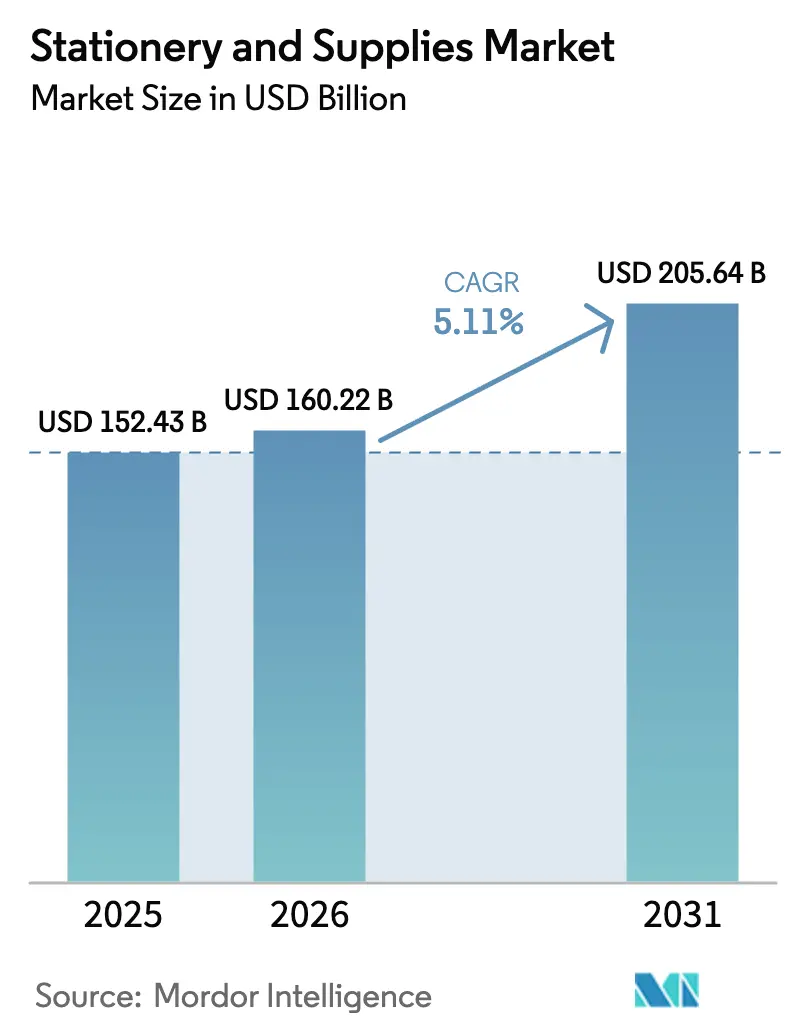
The stationery and supplies market size is expected to grow from USD 152.43 billion in 2025 to USD 160.22 billion in 2026 and is forecast to reach USD 205.64 billion by 2031 at 5.11% CAGR over 2026-2031. Several forces converge to sustain this expansion even as device proliferation tempers low-value paper demand. Worldwide primary and tertiary enrolment increases keep institutional orders for exercise books, art supplies, and examination sheets buoyant. Corporate procurement teams now anchor purchasing criteria in environmental, social, and governance policies, which lifts revenue from recycled and certified-sustainable lines that sell at a premium. Omnichannel commerce reshapes shopper journeys. Discovery often starts on social or marketplace platforms before consumers complete tactile validation in specialty stores, enabling price discipline on high-touch items such as fountain pens. Finally, product innovation, reusable cloud-linked notebooks, refillable metal-barrel pens, and biodegradable adhesives unlock fresh price ladders that offset raw-material volatility and margin pressure.
Key Report Takeaways
- By product type, paper-based products captured 42.78% of stationery and supplies market share in 2025. Office essentials posted the highest growth, expanding at a 6.29% CAGR to 2031.
- By distribution channel, offline specialty stores accounted for 55.72% of the stationery and supplies market size in 2025. Online marketplaces are advancing at a 6.86% CAGR through 2031.
- By end-user, educational institutions led with 45.68% revenue in 2025. Individual consumers are forecast to grow at a 5.62% CAGR between 2026-2031.
- By geography, Asia-Pacific held 35.30% of the global stationery and supplies market share in 2025, while the region also registers the fastest 6.02% CAGR out to 2031.
Note: Market size and forecast figures in this report are generated using Mordor Intelligence’s proprietary estimation framework, updated with the latest available data and insights as of 2026.
Global Stationery And Supplies Market Trends and Insights
Drivers Impact Analysis*
| Driver | (~) % Impact on CAGR Forecast | Geographic Relevance | Impact Timeline |
|---|---|---|---|
| Rising e-commerce penetration for stationery and office supplies | +1.2% | North America, Asia-Pacific (global spillover) | Medium term (2-4 years) |
| Expanding enrolment rates in K-12 and tertiary education | +0.9% | Asia-Pacific, Africa | Long term (≥ 4 years) |
| Premium and customized writing instruments | +0.7% | Urban North America, Europe, Asia-Pacific | Medium term (2-4 years) |
| Smart reusable notebooks integrated with cloud services | +0.5% | North America, Europe, Japan, urban China | Short term (≤ 2 years) |
| Corporate ESG mandates for recycled stationery | +0.8% | North America, Europe, Australia | Medium term (2-4 years) |
| Revival of journaling / art-therapy trends among Gen-Z | +0.6% | North America, Europe, urban Asia-Pacific | Short term (≤ 2 years) |
| Source: Mordor Intelligence | |||
Rising E-commerce Penetration for Stationery and Office Supplies
Online marketplaces post a 7.02% CAGR through 2030, far outpacing brick-and-mortar growth in the stationery and supplies market. Digital storefronts compress go-to-market timelines for niche brands, allowing them to test micro-collections of pens, inks, and planner inserts with minimal capital risk. Japanese exporters lifted revenue to JPY 120 billion (USD 0.8 billion) in 2023, a 15% rise from 2018, primarily by fulfilling small-lot cross-border e-commerce orders[1]FedEx, “Why the World Loves Japanese Stationery,” fedex.com. Brands that combine highly visual product pages, user-generated reviews, and transparent shipping calculators see reduced return rates and higher average order values. KOKUYO’s decision to complement its second Shanghai “Campus STYLE” flagship with a robust Chinese web-app underscores omnichannel complementarity and sets a benchmark for experiential cohesion. Midsize retailers unable to finance proprietary tech increasingly partner with platforms. Dynamic Supplies added 900 ACCO items to its digital catalogue to safeguard relevance.
Expanding Enrolment Rates in K-12 and Tertiary Education Worldwide
Global enrolment trends underpin roughly half of baseline volume in the stationery and supplies market. International student mobility climbed from 2 million in 1998 to 6.4 million in 2020 and is projected to grow 4-4.5% annually to 2030[2]British Council, “The Outlook for International Student Mobility,” britishcouncil.org. Developing regions witness parallel momentum: Ghana, Kenya, and Vietnam each allocated at least 20% of annual budgets to education in 2024, funneling capital into textbooks, lab workbooks, and classroom consumables. At the other end of the value spectrum, affluent parents in urban India now prioritize premium artist-grade sketchbooks, reflecting a shift from basic functional spending to aspirational purchases. Though 249 million children remain out of school, multilateral organizations have earned USD 4.5 billion for catch-up learning by 2028, which promises incremental demand as access deficits narrow.
Premium and Customized Writing Instruments Gaining Traction
In saturated smartphone environments, writing instruments reposition as identity statements. Collectors line up for serialized fountain pens featuring regional motifs, and price points exceed USD 800 for one-off artisan models. Corporate gifting revives post-pandemic, with investment banks, consulting firms, and law offices ordering engraved lacquer-finish pens for milestone deals. Custom pen kits that allow users to swap nib grades or barrel colors aid replenishment revenue—a tactic BIC has mirrored through refill subscription trials, supported by R&D spend equal to 10% of net sales. Independent pen tuners offering nib grinding on TikTok drive micro-influencer awareness, feeding long-tail brand equity across the stationery and supplies market.
Smart Reusable Notebooks Integrated with Cloud Services
Reusable notebook vendors leverage polymer-coated pages and microwave-safe inks that erase after heat exposure, guaranteeing hundreds of reuse cycles. Device-agnostic scanning apps use AI-based handwriting recognition to push notes to Google Drive, OneDrive and proprietary learning-management systems. In 2024, two U.S. community-college districts bundled cloud-linked notebooks into digital equity programs, lowering laptop dependence in low-income cohorts while maintaining submission compatibility. In Japan, cram-school providers partnered with notebook manufacturers to preload QR-coded practice sheets that sync with grading dashboards, reinforcing the stationery and supplies market as a pivot for ed-tech services. Key hurdles—battery-free tagging, spiral durability and licensing fees—remain, but gross profit still outperforms commodity notepads by 12-15 percentage points.
Restraints Impact Analysis*
| Restraint | (~) % Impact on CAGR Forecast | Geographic Relevance | Impact Timeline |
|---|---|---|---|
| Accelerating digitalization by reducing paper consumption | -1.8% | North America, Europe, Japan | Long term (≥ 4 years) |
| Volatility in pulp and petro-chemical input prices | -0.9% | Global—biggest hit to commodity SKUs | Medium term (2-4 years) |
| Counterfeiting and grey-import channels | -0.4% | Southeast Asia, parts of Latin America | Medium term (2-4 years) |
| Pigment/ink supply shocks from geo-political conflicts | -0.3% | Global, specialty lines | Short term (≤ 2 years) |
| Source: Mordor Intelligence | |||
Volatility in Pulp and Petro-Chemical Input Prices
Wild swings in key inputs destabilize production budgets and squeeze gross margins for notebooks, pens, and packaging. Corrugated cardboard benchmark prices jumped USD 70 per ton in early 2025 as pulp shortages, energy surcharges, and freight bottlenecks cascaded through the supply chain[3]Creative Edge Packaging, “Navigating the USD 70 Per Ton Increase in Corrugated Cardboard,” cepkg.com. Chinese paper mills quickly followed by raising list prices about USD 31.50 per ton to offset higher wood-fiber and electricity costs, passing fresh pressure onto converters worldwide. At the same time, explosions and shutdowns at Southeast Asian chemical plants created a nitrocellulose shortage that forced ink makers to levy 5-9% surcharges on specialty and bulk formulations. Color-pigment suppliers layered additional tariff-related fees for toluene- and xylene-based intermediates, adding another unpredictable variable to coating and barrel costs. While large multinationals hedge pulp and resin exposure through multi-year contracts, small and midsize stationery brands often must adjust catalog prices within weeks, risking volume loss to lower-cost private labels.
Accelerating Digitalization, Reducing Paper Consumption
Digital workflows continue to replace routine printing and copying across offices, classrooms, and public agencies, sharply curbing demand for low-grade graphic paper. Europe’s paper industry registered a 28% year-over-year fall in graphic-paper output during 2023 as employers accelerated e-signature rollouts and publishers shifted to digital formats[4]Pulpapernews, “Paper Industry Faced Unprecedented Decline in 2023,” pulpapernews.com. Japan experienced a 10% contraction in domestic stationery sales from 2019-2023 as consumers gravitated toward tablets for study and note-taking, even though export sales of premium pens and notebooks climbed on overseas demand. Local governments add to the shift: several California municipalities cut council-meeting print volumes by 60% after adopting paperless agenda software, setting a template other U.S. cities now study for replication. Education ministries still preserve handwritten exercises for early-grade literacy, yet the overall classroom mix tilts toward online assessments and e-textbooks, gradually eroding bulk exercise-book orders. As these trends coalesce, traditional paper suppliers face a structural, rather than cyclical, decline in their largest volume segment.
*Our forecasts treat driver/restraint impacts as directional, not additive. The impact forecasts reflect baseline growth, mix effects, and variable interactions.
Segment Analysis
By Product Type: Paper Products Dominate Despite Digital Pressures
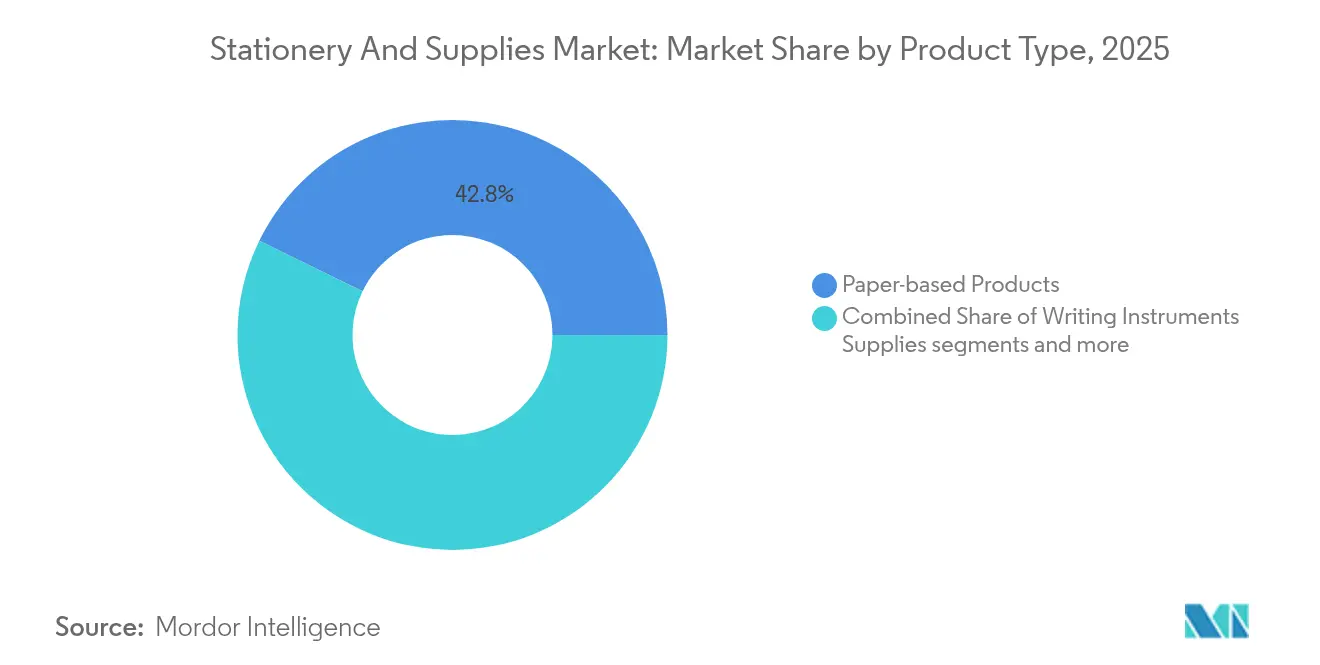
Paper goods anchor 42.78% of the stationery and supplies market size in 2025, proving resilient due to classroom mandates for notebooks, exam answer sheets, and art pads. Recycled-content copy paper gains traction after the U.S. federal directive eliminated virgin paper from procurement catalogues. Simultaneously, office essentials—staplers, desk organizers, labeling devices—log a 6.29% CAGR because flexible workspaces emphasize modular desk setups. Writing instruments enjoy value-added lift: metallic body finishes, hybrid gel-ball inks, and quick-dry technology answer user pain points identified in social-media feedback loops.
Smart stationery, though holding less than 5% revenue share in 2025, represents the fastest innovation channel. Start-ups bundle reusable books with cloud storage for a one-year subscription, after which renewal runs USD 2-3 monthly, creating a service layer absent in legacy paper. Art and craft items ride the Gen-Z creativity wave, but premiumization distinguishes winners: cotton-rag watercolor pads and alcohol-marker paper command 3-4 times commodity sheet pricing. Asian powerhouses like M&G booked +16.78% YoY growth in 2023. Product managers increasingly weigh carton cube efficiency and e-commerce damage rates at the design stage, aligning spec decisions with growing online volume in the stationery and supplies market.


By Distribution Channel: Digital Transformation Accelerates
Offline specialty stores controlled 55.72% of the global stationery and supplies market share in 2025, reflecting the enduring appeal of tactile product trials, on-site engraving services, and community workshops that online platforms cannot fully mimic. Shoppers often visit these boutiques to test fountain-pen nibs, compare paper textures, and access immediate personalization, activities that anchor premium price realization and generate repeat traffic. However, the channel’s growth pace trails the overall stationery and supplies market size because floor space limits SKU breadth, and staffing costs tighten margins. In response, leading chains invest in appointment scheduling, loyalty apps, and in-store events such as calligraphy classes to deepen engagement without relying solely on walk-in footfall. Some formats integrate coffee corners and maker spaces to lengthen dwell time, positioning the store as a lifestyle venue instead of a pure transaction point. Luxury brands further leverage flagship locations for limited-edition drops that align with social-media countdowns, thereby converting exclusivity into front-page visibility.
Online marketplaces and brand web shops, advancing at a 6.86% CAGR through 2031, add the most incremental revenue to the stationery and supplies market. Algorithmic recommendations bundle complementary items—dot-grid journals, brush pens, and mild liner sets—raising average order value and lowering discovery friction for niche products. Cross-border logistics agreements between Japan Post and USPS, introduced in 2024, reduced transit times for small parcels to the United States from 19 to 11 days, convincing more Japanese brands to sell direct. Distributors also pivot: Dynamic Supplies integrated 900 ACCO SKUs into its e-catalog, giving resellers real-time stock visibility and automated replenishment triggers that shrink out-of-stocks to below 2%. Hybrid models flourish as retailers like WHSmith employ click-and-collect, allowing consumers to combine online assortment depth with same-day pickup convenience. Supermarkets and hypermarkets still capture impulse notebook and pen purchases, yet their relative share declines as engaged buyers shift to digital subscriptions. Institutional e-procurement portals round out the channel mix, bundling recycled copier paper, toner, and filing supplies under multiyear contracts that favor vendors with stable fulfillment metrics and ESG credentials.
By End-User: Educational Dominance Meets Consumer Innovation
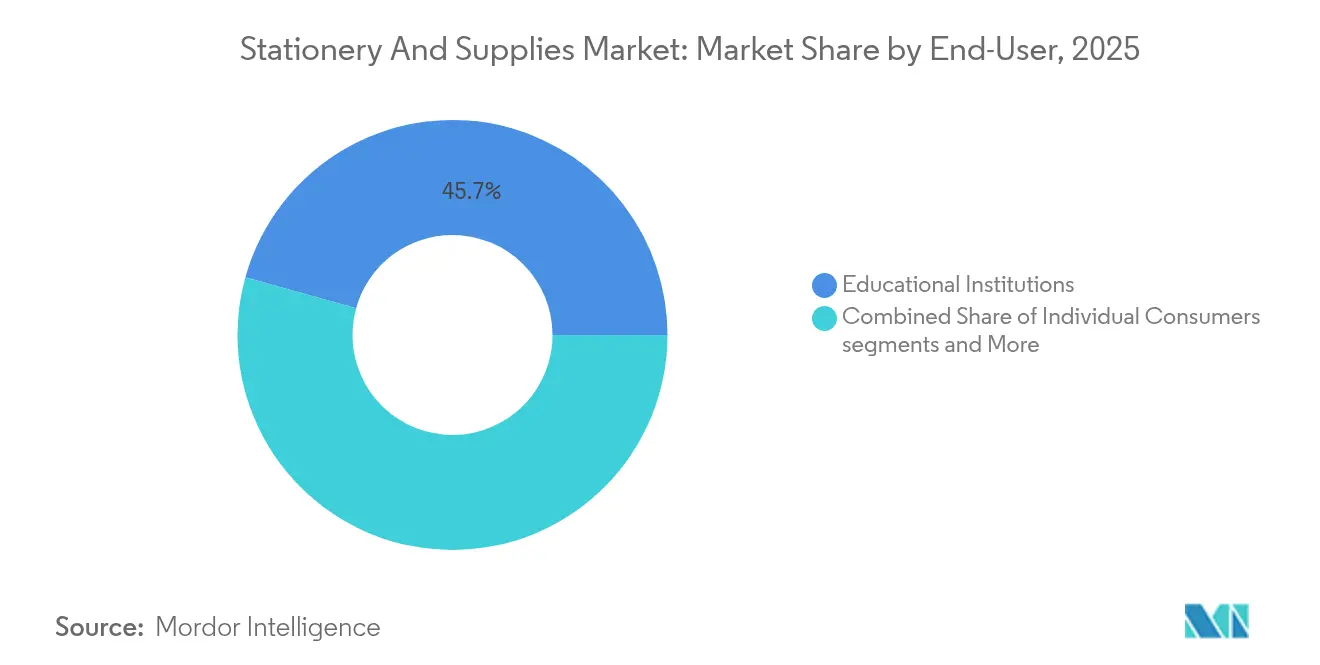
Educational institutions generated 45.68% of global revenue in 2025, a position rooted in compulsory schooling laws, rising tertiary enrollment, and steady textbook cycles. Ministries procure bulk exercise books, exam answer sheets, and art kits through competitive tenders that specify recycled content thresholds and durability standards. In emerging Asia, per-pupil public spending climbed 9% during 2024, and new curriculum mandates in India now require science-lab notebooks from grade 6 onward, adding fresh volume. Universities extend demand with specialized formats like carbonless lab logbooks and thesis-binding sets, each carrying higher gross margins than standard ruled pads. Campus bookstores diversify by pairing branded planners with wellness journals, capturing discretionary spend from student wellness budgets. Supplier consolidation benefits this segment because institutions favor vendors that can guarantee multi-year continuity, consistent paper opacity, and on-site delivery within narrow orientation-week windows.
Individual consumers, expanding at a 5.62% CAGR, have become the fastest-growing cohort within the stationery and supplies market. Gen-Z shoppers treat journals, stickers, and fine-liner pens as self-care tools, a trend amplified by social-media influencers who post desk setup videos and habit-tracker tutorials. Subscription services deliver themed boxes each month, smoothing seasonality for retailers and encouraging cross-selling of specialty paper and storage pouches. Corporate and home-office users occupy the middle ground, combining flexible work realities with ESG compliance targets that favour FSC-certified folders and carbon-neutral courier options. Small-business owners increasingly order branded notebooks in short digital-print runs, reinforcing identity at client meetings and trade fairs without tying up cash in large inventories. Government agencies complete the end-user matrix through framework agreements that lock in predictable quantities but impose strict documentation on recycled content and supply-chain transparency. Together, these diverse demand profiles balance cyclical swings and provide a multi-layered safety net for long-term growth.
Geography Analysis
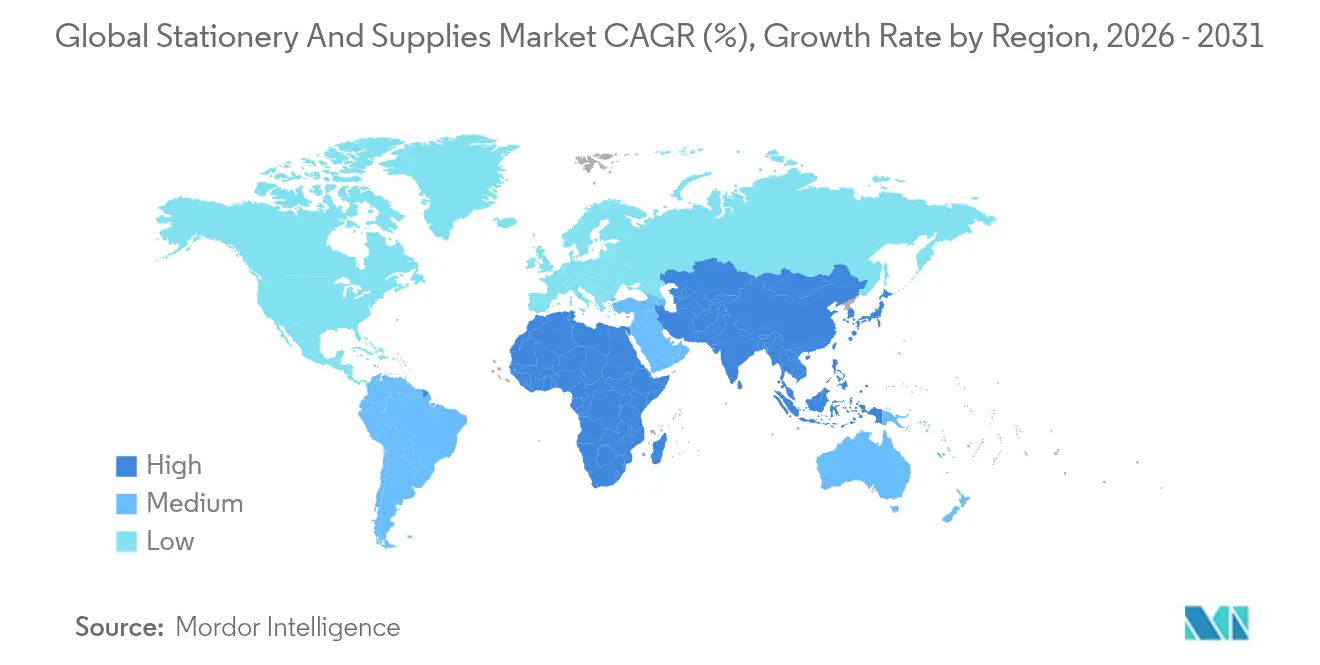
Asia-Pacific owns 35.30% of global sales and climbs at a 6.02% CAGR through 2031. China’s M&G leverages automated lines to deliver 23% gross margin even as it scales domestic storefronts in tier-2 cities. Japanese exporters thrive on premium equity: fountain pens with urushi lacquer and notebooks with lightweight “Tomoe River” paper attract collectors worldwide, supporting a 120-billion-yen export figure in 2023. India’s National Education Policy expanded textbook outlays, and textbook publishers co-bundle art kits to boost per-student spending. Southeast Asian hubs like Vietnam lure contract manufacturing via competitive labor rates, feeding private-label pipelines for Western retailers and broadening the stationery and supplies market.
North America’s demand profile tilts toward smart devices and eco-labelled products. While U.S. office-supply sales dipped to USD 11.5 billion in 2024, Circana expects stabilization by 2027 as hybrid offices normalize ordering patterns. Canada’s federal green-procurement guidelines mirror U.S. thresholds, pushing domestic mills to certify FSC status. Europe displays similar maturity but imposes stricter waste-reduction directives. Germany’s Blue Angel ecolabel, for example, dominates tender requirements.
Middle East & Africa post double-digit growth off a small base, driven by urbanization, private-school chains, and public-sector digitization drives that still require hybrid stationery supplies. Latin America’s consumption rises with middle-class expansion but is tempered by currency swings, however, local pulp availability aids cost competitiveness in notebook exports to the United States. Across emerging regions, distributors that bundle teacher-training content with product orders secure stickier relationships and a higher share in the stationery and supplies market.

Value Chain Analysis
The stationery and supplies value chain starts with upstream feedstocks and components, including pulp and recovered paper for notebooks and copy paper, petrochemical-derived resins for pen bodies and adhesives, and specialty inputs such as pigments and inks and metal parts for premium writing instruments. Converters and brand owners manage multi-category manufacturing and finishing, covering coating, printing, binding, molding, and packaging, before distributing products through wholesalers, distributors, and retailers across offline specialty stores, mass retail, institutional procurement, and online marketplaces. Input volatility shows up directly in operating economics, including the early-2025 corrugated cardboard benchmark jump of USD 70 per ton, which fed into packaging and bulk-shipment cost structures for commodity SKUs.
Midstream players increasingly differentiate through compliance and traceability programs that span the supply chain. Larger suppliers use supplier codes of conduct, audit protocols, and responsible-sourcing checks such as the Responsible Minerals Initiative (RMI) Active and Conformant Facilities List where relevant to sourced minerals, alongside supplier-finance programs that help stabilize payment cycles for smaller vendors. At the downstream end, omnichannel fulfillment and returns handling matter more as shoppers discover products online but still seek tactile validation in specialty retail, which pushes brands to design for e-commerce damage resistance and ship-ready packaging while maintaining premium in-store experiences.
Competitive Landscape
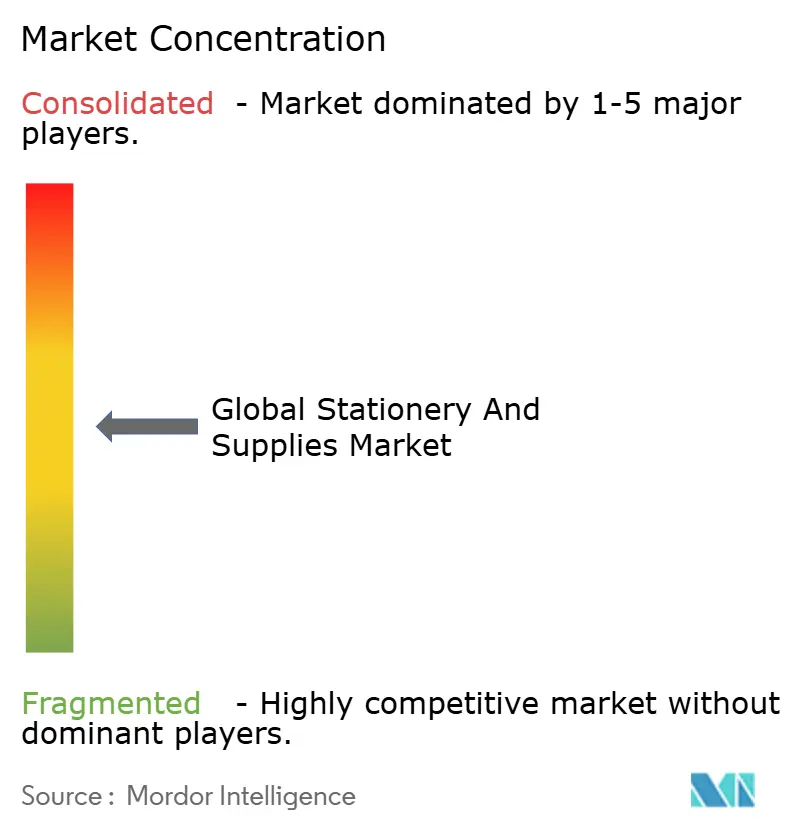
The stationery and supplies market features moderate concentration: the top five firms hold roughly 40 -50% global revenue, ensuring price visibility without precluding niche insurgents. BIC’s 8% share stems from broad distribution, while Pilot, Faber-Castell, and Pentel occupy premium and professional corners. Packaging giants press in through M&A: International Paper’s USD 7.2 billion purchase of DS Smith pivoted capacity toward fiber-based boxes that double as bulk notebook covers. Smurfit Kappa’s merger with WestRock created a USD 34.0 billion entity able to integrate board, print, and finishing, offering turnkey school-supply kits to distributors. Xerox’s USD 1.5 billion Lexmark acquisition strengthened aftermarket toner leverage and cross-selling of paper to MPS clients.
Asian manufacturers inject volume agility, M&G’s patent trove facilitates design refreshes in under 90 days, matching social-media trend velocity. Japanese brands defend high gross margins via limited editions and museum collaborations. Digital-native entrants exploit influencer partnerships and zero-inventory print-on-demand, sidestepping traditional wholesale mark-ups. ESG leadership emerges as a moat: ACCO Brands’ progress on energy cuts and recycled materials wins framework agreements with federal buyers. Overall, sustainable sourcing, digital enablement, and speed-to-trend outrank scale alone in determining future winners within the stationery and supplies market.
Stationery And Supplies Industry Leaders
3M Company
ACCO Brands Corporation
Société BIC S.A.
Kokuyo Co., Ltd.
Faber-Castell AG
- *Disclaimer: Major Players sorted in no particular order

Market Opportunities and Future Outlook
Premium, sustainable, and compliance-ready assortments create clear whitespace as corporate and public buyers tighten ESG screens and consumers trade up in selected categories. Suppliers are operationalizing circularity themes (reduce, reuse, refill, recycle) across writing instruments, correction products, and packaging, while third-party ecolabels and product certifications support specification-led tenders and premium shelf positioning. In Europe, programs such as AFNOR certification via NF Environnement for stationery items provide a reference point for standardized sustainability claims, which can influence procurement award decisions.
Growth headroom also comes from expanding use cases for stationery, learning tools, and digitally enabled workflows rather than only from commodity paper volume. Cloud-linked reusable notebooks and app-enabled scanning features, already bundled into education-access initiatives in the United States and integrated into cram-school ecosystems in Japan, broaden addressable spend per student by layering services and subscriptions onto physical goods. For manufacturers and retailers, omnichannel execution and cross-border e-commerce continue to be the most practical levers: logistics improvements and marketplace merchandising support small-lot international demand for premium Japanese and other specialty products, while in-store personalization (engraving, nib testing, workshops) helps protect price realization in high-touch segments.
Recent Industry Developments
- July 2026: 3M Company launched Scotch Kids Tape collection to support young creators. The launch expands branded tape offerings into the education and crafts subsegment, strengthening consumer appeal in high-growth craft/education markets within stationery. This expands 3M's product reach in consumer-facing categories tied to school and art activities.
- June 2026: ACCO Brands Corporation Kensington Pro Fit Ergo TB675 Vertical Wired and Wireless Trackballs launched. The launch adds an ergonomic input device to premium office and education bundles. It also broadens ACCO's periphery portfolio alongside premium workstation kits in the market.
- April 2026: ACCO Brands Corporation First-quarter 2026 results; EPOS acquisition integration progress and 100 million cost savings program by year-end. The disclosure highlights profitability implications for the stationery and accessories segment. It points to improving scale and efficiency in ACCO's premium office supplies portfolio.


Research Methodology Framework and Report Scope
Market Definition and Coverage
For this study, the stationery and supplies market covers everyday writing instruments, paper-based stationery, and basic desk and school supplies that are sold through retail and institutional channels, measured in revenue at the point of sale across major regions.
Scope exclusions: We exclude printing equipment, large office furniture, and IT hardware, and we also exclude pure digital products such as note-taking apps and subscriptions.
Segmentation Overview
- By Product Type
- Paper-based Products
- Writing Instruments
- Art and Craft Supplies
- Office Essentials (Non-paper)
- By Distribution Channel
- Offline - Specialty Stationery Stores
- Offline - Super/Hypermarkets & Bookstores
- Online - E-commerce & Marketplaces
- By End-User
- Educational Institutions
- Corporate and Home-office Users
- Individual Consumers
- Government and Public Sector
- By Geography
- North America
- United States
- Canada
- Mexico
- South America
- Brazil
- Peru
- Chile
- Argentina
- Rest of South America
- Europe
- United Kingdom
- Germany
- France
- Spain
- Italy
- BENELUX (Belgium, Netherlands, Luxembourg)
- NORDICS (Denmark, Finland, Iceland, Norway, Sweden)
- Rest of Europe
- Asia-Pacific
- India
- China
- Japan
- South Korea
- Australia
- South-East Asia (Singapore, Malaysia, Thailand, Indonesia, Vietnam, Philippines)
- Rest of Asia-Pacific
- Middle East and Africa
- United Arab Emirates
- Saudi Arabia
- South Africa
- Nigeria
- Rest of Middle East and Africa
- North America
Data Sources, Market Sizing, and Validation
Desk Research
Desk research was used to set the market boundaries and build a clean starting data set on demand drivers and trade flows. We referenced public statistics and explainers such as UNESCO education enrollment data, World Bank macro indicators, UN Comtrade trade statistics for paper and stationery-related codes, US Census and Eurostat retail and manufacturing series, and OECD price and consumer indicators (where available by country and category).
On the supply and channel side, we reviewed company annual reports and investor presentations, retailer category pages and promotions, and trade press coverage on back-to-school and office restocking cycles. To fill a few gaps that are hard to keep current using only public sources, we also used paid subscriptions for company financials and intelligence, news and financials tracking, and an import-export shipment-level view in selected corridors. The sources listed here are illustrative, and many other public and paid references were also used for data collection, cross-checking, and clarification.
Primary Interviews and Surveys
Primary work focused on validating what is really being purchased, how often replenishment happens, and how pricing changes across regions and channels. We interviewed and surveyed manufacturers, distributors, large retailers, and institutional buyers (schools, offices, and public procurement teams) across APAC, EMEA, and the Americas, then used their inputs to confirm key assumptions and close remaining data gaps.
Distribution of primary research fieldwork respondents
| Company type | Respondent position | Region |
|---|---|---|
| Top tier: 39% | CXOs: 13% | APAC: 42% |
| Mid tier: 44% | Functional/Unit leaders: 32% | EMEA: 32% |
| Smaller Players: 17% | Managers: 55% | Americas: 26% |
Market-Sizing & Forecasting
Sizing was built using a combined top-down and bottom-up approach, where country demand pools were reconstructed from education enrollment, office worker base, and retail category spending, and then converted into stationery consumption using category mix and replacement cycles. To keep totals grounded, results were corroborated using selective bottom-up approximations such as sampled average selling price (ASP) by product basket multiplied by estimated unit volumes, along with channel checks from distributors and retailers.
A few market fingerprints were treated as core inputs because they move the market in visible ways, such as back-to-school seasonality, paper price movements and pass-through into notebooks and copier paper, shifts between offline and online channels, and premiumization of pens and art supplies. For forecasting, we used scenario analysis supported by expert views on macro conditions, school intake trends, and procurement behavior, and then applied expected ASP progression and mix changes by region. Where bottom-up visibility was weaker, we used conservative proxies (like import trends, retail sales indices, and normalized spend per student or office worker) before adjusting with interview feedback.
Data Validation & Update Cycle
Outputs were checked at multiple steps so the final totals align with real-world signals. We compared country results against independent indicators like education spending direction, retail sales patterns, and trade movements for relevant stationery-linked goods, then reviewed outliers before sign-off.
Assumptions were revisited when interview feedback or new public data suggested a break in trend, such as a sudden paper price swing or an unusual shift in online promotions. Reports are refreshed annually, with interim updates when material events occur, and a final pre-delivery pass is completed so clients receive the latest consistent view.
Mordor Intelligence's Global Stationery and Supplies Market Size Compared With Other Published Estimates
Published market values can vary even when they describe the same industry, because the product boundary and pricing basis are not always treated consistently. Differences can also come from how much of the office supplies landscape is included versus general consumer stationery, how online marketplace sales are handled, and whether the base year assumptions are kept current.
The benchmark table shows a noticeable spread, and in Mordor Intelligence's model the totals are tied to core stationery and supplies revenue, then kept consistent across regions using a single currency timing and a refreshed price and mix set for the base year. In other public estimates, the gap often traces back to either folding in adjacent categories (like broader office products) or using a slower refresh of channel mix and ASP changes, which can understate premiumization effects in pens and branded notebooks.
Benchmark comparison
| Source | Market Size | Gaps in Research Methodology |
|---|---|---|
| Mordor Intelligence | USD 160.22 B (2026) | |
| Trade Journal A | USD 152.70 B (2022) | Uses an older base year and tends to emphasize office-oriented spend, which can miss newer consumer-led premium pockets and post-pandemic channel mix shifts. |
| Global Consultancy B | USD 174.40 B (2024) | Covers a broader office supplies lens and mixes B2B and consumer demand assumptions, which can inflate totals versus a tighter stationery and supplies-only scope. |
Taken together, the comparisons point to a practical takeaway, which is that scope control and timely price and channel updates explain most of the differences. By keeping the demand pool traceable to clear drivers and then pressure-testing it with supplier and channel feedback, the final number stays balanced and repeatable for planning.


Key Questions Answered in the Report
How large is the global stationery and supplies market in 2026?
The stationery and supplies market size sits at USD 160.22 billion and is forecast to reach USD 205.64 billion by 2031 at a 5.11% CAGR.
Which product category is growing fastest?
Office essentialsnon-paper desk accessorieslead growth at a 6.29% CAGR due to flexible workspace demand.
Why is Asia-Pacific critical for future sales?
The region already holds 35.30% share and benefits from expanding education budgets, rising disposable incomes and strong cultural affinity for premium stationery.
How are sustainability mandates shaping supplier strategies?
Regulations requiring 95% recycled content in government purchasing push vendors to certify materials and support premium pricing for eco-labelled lines.
What role does e-commerce play in market growth?
Online channels grow at 6.86% CAGR, enabling SKU variety, customization and cross-border sales that outpace store-only growth.
Are smart reusable notebooks a sizable opportunity?
While still under 5% of revenue, reusable cloud-enabled notebooks post double-digit growth and introduce subscription revenue streams, raising margins beyond commodity pads.
Page last updated on:


