Sports Apparel Market Size and Share
Market Overview
| Study Period | 2021 - 2031 |
|---|---|
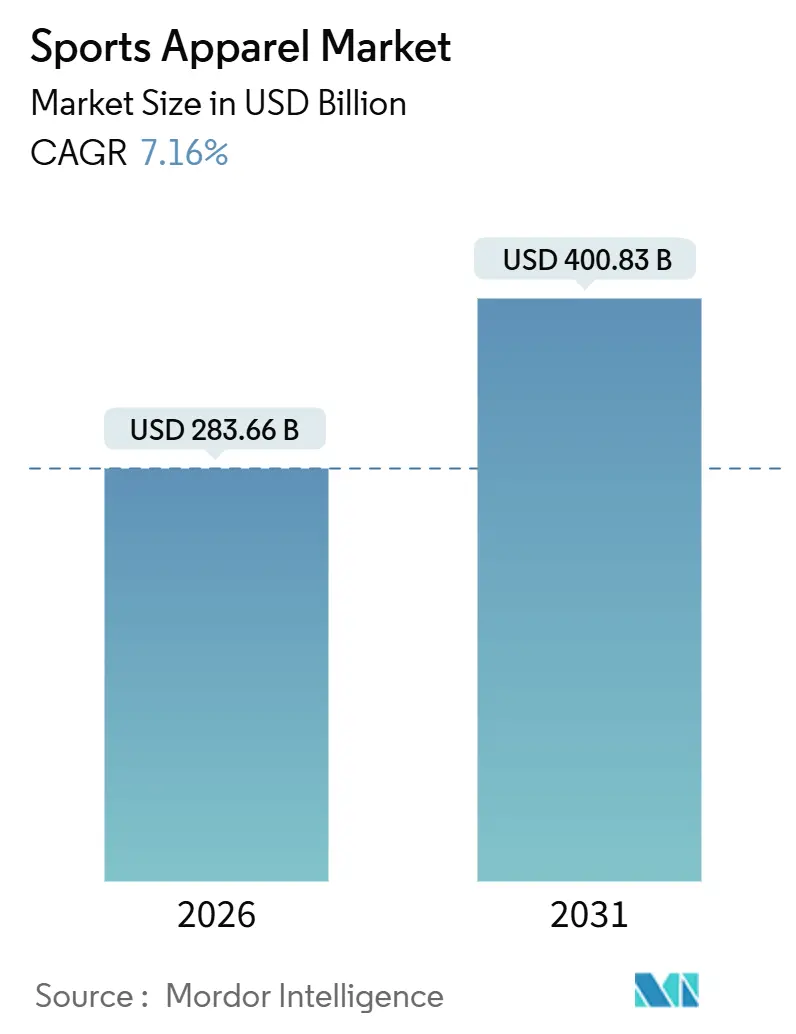
| Market Size (2026) | USD 283.66 Billion |
| Market Size (2031) | USD 400.83 Billion |
| Growth Rate (2026 - 2031) | 7.16% CAGR |
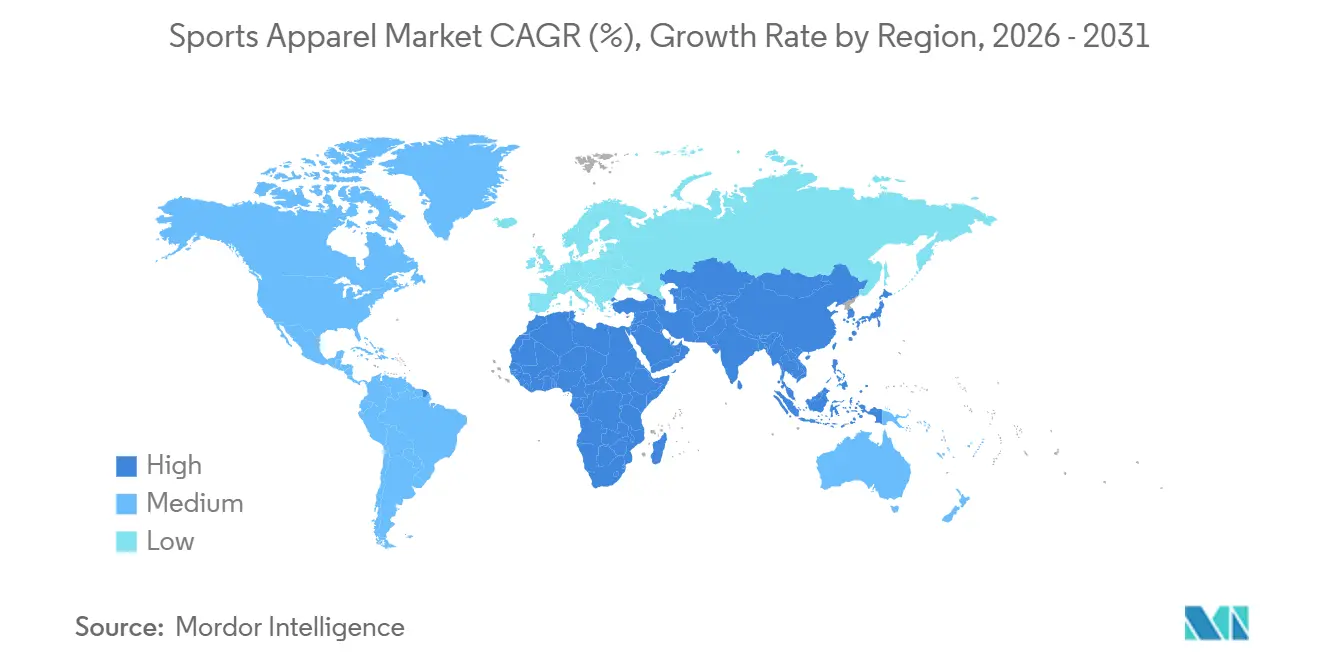
| Fastest Growing Market | Middle East and Africa |
| Largest Market | North America |
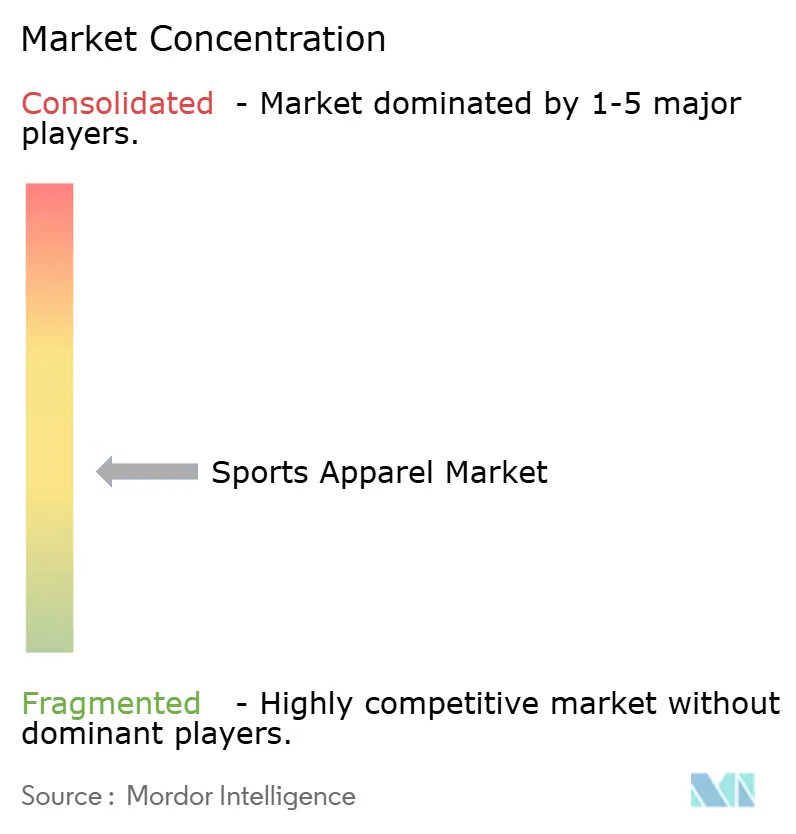
| Market Concentration | Medium |
Major Players *Disclaimer: Major Players sorted in no particular order Image © Mordor Intelligence. Reuse requires attribution under CC BY 4.0. | |
Sports Apparel Market Analysis by Mordor Intelligence
The global sports apparel market size is valued at USD 283.66 billion in 2026 and is projected to reach USD 400.83 billion by 2031, advancing at a 7.16% CAGR. Athleisure adoption, female sports participation, and fabric innovation are steering the sports apparel market toward sustained double-digit revenue gains in key emerging economies. Legacy performance lines, most notably running apparel, keep commanding premium prices as brands add patented moisture-management and thermoregulation technologies. Online channels continue to outgrow brick-and-mortar formats, yet high return rates and fit complexity place a natural ceiling on e-commerce penetration. At the same time, governments from Saudi Arabia to India embed apparel demand in national sports policies that fund facilities and mandate physical education coursework. Competitive intensity remains moderate because agile regional specialists and direct-to-consumer newcomers chip away at the historical dominance of global giants.
Key Report Takeaways
- By product type, Topwear led with 36.55% of the sports apparel market share in 2025, while Outerwear is poised to expand at a 7.42% CAGR through 2031.
- By sport type, running apparel accounted for 37.45% revenue share in 2025 and is forecast to grow at a 7.83% CAGR to 2031.
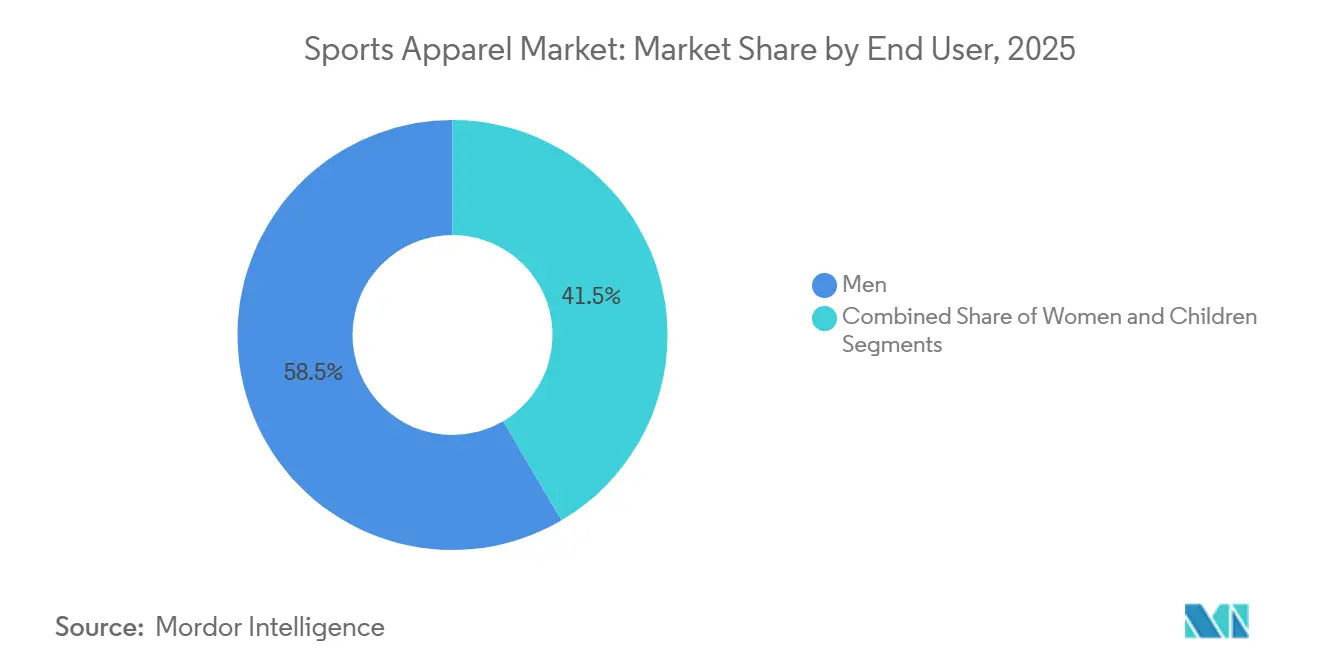
- By end user, Men retained 58.47% share in 2025, whereas the Children’s segment is projected to post an 8.26% CAGR through 2031.
- By distribution channel, Offline retail commanded 65.33% of 2025 sales, yet Online retail is set to rise at an 8.65% CAGR through 2031.
- By geography, North America captured 48.65% of the 2025 revenue, but the Middle East and Africa region is expected to record the fastest growth, with a 9.15% CAGR from 2025 to 2031.
Note: Market size and forecast figures in this report are generated using Mordor Intelligence’s proprietary estimation framework, updated with the latest available data and insights as of January 2026.
Global Sports Apparel Market Trends and Insights
Drivers Impact Analysis
| Drivers | (~) % Impact on CAGR Forecast | Geographic Relevance | Impact Timeline |
|---|---|---|---|
| Significant Growth in Women Sports Participation Rate | +1.2% | Global, with strongest gains in Middle East, South Asia, and Sub-Saharan Africa | Medium term (2-4 years) |
| Aggressive Marketing by Reputed Brands | +0.9% | North America, Europe, urban Asia-Pacific | Short term (≤ 2 years) |
| Influence of Social Media Platforms and Celebrity Endorsements | +1.1% | Global, particularly North America, Europe, and urban APAC markets | Short term (≤ 2 years) |
| Favourable Government Initiatives to Boost Sports Culture | +1.3% | Middle East (Saudi Arabia, UAE), India, China, select African nations | Long term (≥ 4 years) |
| Technological Advancements in Fabric Materials For Enhanced Performance | +1.0% | Global, led by North America, Europe, and Japan for R&D; manufacturing in Asia | Medium term (2-4 years) |
| Growing Adoption of Athleisure Fashion for Casual and Social Occasions | +1.4% | Global, strongest in North America, Western Europe, and affluent APAC cities | Short term (≤ 2 years) |
| Source: Mordor Intelligence | |||
Significant Growth in Women Sports Participation Rate
At the Paris 2024 Olympics, women accounted for 49% of the athletes, representing a significant milestone that UNESCO attributed to decades of advocacy. However, UNESCO's 2024 global survey highlighted a troubling issue: 49% of adolescent girls quit organized sports by the age of 15, primarily due to unsafe facilities and cultural stigmas in certain regions[1]Source: UNESCO, “Gender Equality in Sport,” unesco.org. This scenario creates a strategic opportunity for brands to gain early loyalty by investing in modest activewear, community sports programs, and female athlete endorsements in underserved markets before larger competitors enter. To support grassroots sports, India's Khelo India initiative allocated INR 30.62 billion (USD 367 million) in its 2024-2025 budget, with a specific focus on increasing female participation in rural areas. Similarly, Saudi Arabia's Sports for All program reported a threefold rise in female gym memberships between 2022 and 2025, which coincided with growing demand for performance hijabs and full-coverage running apparel.
Aggressive Marketing by Reputed Brands
Leading sports apparel firms are redirecting their marketing expenditures from traditional broadcast television to digital influencer partnerships and experiential retail. In its Q3 2024 earnings, Adidas disclosed that while its marketing spend remained consistent at approximately 12% of revenue, the emphasis has shifted significantly toward social media collaborations and pop-up events in high-traffic urban areas. This strategic shift highlights an industry-wide understanding that younger consumers, particularly Gen Z, are more inclined to discover brands through platforms like Instagram Reels, TikTok challenges, and YouTube athlete documentaries rather than traditional advertising. On Holding's growth trajectory illustrates the success of this approach. The Swiss brand, with minimal reliance on television, focused on marathon sponsorships and athlete-generated content, achieving an impressive 100% constant-currency apparel growth in Q3 2025. However, the market is becoming saturated. A 2024 BCG study on activewear found that 68% of U.S. consumers feel "overwhelmed" by the volume of sportswear promotions, indicating potential diminishing returns on additional advertising spend.
Influence of Social Media Platforms and Celebrity Endorsements
Social media's ascent has revolutionized how sports apparel brands connect with consumers and sway their buying choices. Athletes, such as Caitlin Clark, have transitioned from simple endorsers to central figures, notably boosting participation rates among young girls. Dubbed the "Caitlin Clark Effect," this trend has not only shattered viewership records for women's basketball but also spurred a notable rise in young girls participating in sports. For example, Clark's WNBA team, the Indiana Fever, recorded an increase in average attendance from 4,067 to 17,000 fans in 2024, while jersey sales demonstrated a growth of 1,913% compared to the previous year. These developments highlight how athletes are not just sports figures but also pivotal influencers in consumer behavior, creating vast opportunities for sports apparel brands.
At the same time, the fitness sector is pivoting towards community-centric experiences, with live fitness classes taking center stage. This shift underscores a growing consumer appetite for social interaction and shared motivation in their fitness endeavors. In response, brands are weaving in social commerce features, streamlining the journey from inspiration to purchase. Platforms such as Instagram and TikTok play a crucial role, empowering influencers to spotlight products during live sessions, thus hastening consumer decisions. This blend of social engagement with commerce is reshaping conventional marketing tactics, highlighting the critical role of genuine interaction and immediate connectivity in boosting sales.
Favourable Government Initiatives to Boost Sports Culture
National sports policies worldwide are increasingly emphasizing physical education hours, funding public facilities, and subsidizing youth league participation. These measures are driving structural demand for affordable athletic apparel. In India, the National Sports Policy 2025 aims to establish 1,000 Khelo India Centers by 2030, each featuring changing rooms and gear storage[2]Source: Ministry of Youth Affairs and Sports, India, “Khelo India Programme,” yas.nic.in. This initiative indirectly encourages families to purchase sports clothing for their children. Similarly, China’s "Healthy China 2030" blueprint has allocated CNY 500 billion (USD 69 billion) for sports infrastructure development between 2024 and 2030. Additionally, provincial governments are offering tax incentives to domestic sportswear manufacturers operating in designated economic zones. In Saudi Arabia, the Vision 2030 framework links sports participation metrics with broader economic diversification objectives. The Public Investment Fund has pledged USD 2 billion to sports-related ventures, including apparel retail joint ventures with international brands. These initiatives strategically shorten the payback period for market-entry investments, particularly in regions where consumer purchasing power is still developing alongside infrastructure growth.
Restraints Impact Analysis
| Restraints | (~) % Impact on CAGR Forecast | Geographic Relevance | Impact Timeline |
|---|---|---|---|
| Proliferation of Counterfeit Products | -0.8% | Global, most acute in Asia-Pacific, Latin America, and parts of Middle East/Africa | Short term (≤ 2 years) |
| Lack of Standardized Regulations Restricts Growth | -0.5% | Global, particularly fragmented in Asia-Pacific and Africa where national standards diverge | Long term (≥ 4 years) |
| Supply Chain Disruptions and Logistics Challenges | -0.9% | Global, with acute pressure on Asia-Europe and Asia-North America routes | Medium term (2-4 years) |
| High Manufacturing Costs and Raw Material Expenses | -0.7% | Global, most severe in North America and Western Europe due to labor costs; raw material volatility affects all regions | Medium term (2-4 years) |
| Source: Mordor Intelligence | |||
Proliferation of Counterfeit Products
Counterfeit sportswear damages brand equity and diverts revenue, outpacing enforcement efforts. In 2024, U.S. Customs and Border Protection confiscated fake athletic apparel and footwear worth USD 38 million, reflecting a 22% increase compared to 2023. A 2025 report by the European Union Intellectual Property Office estimated that counterfeit goods cost the EU sportswear industry EUR 3.2 billion annually in lost sales and tax revenue[3]Source: European Union Intellectual Property Office, “Counterfeit Goods Report 2025,” euipo.europa.eu. Operation Pangea XVII, a global enforcement effort in 2024, led to the closure of over 5,000 online storefronts selling counterfeit products from Nike, Adidas, and Puma. This growth is fueled by sophisticated supply chains in Southeast Asia, capable of replicating branded packaging and embedding RFID tags to deceive retailers. Brands are combating this issue with blockchain-based authentication systems and consumer education campaigns, but the ongoing battle remains challenging.
Lack of Standardized Regulations Restricts Growth
Textile safety and labeling standards vary widely across jurisdictions, complicating multinational product launches and raising compliance costs. The European Union's REACH regulation restricts over 200 chemical substances in apparel, while California's Proposition 65 mandates warning labels for products containing trace amounts of certain compounds, creating a patchwork that forces brands to maintain region-specific SKUs. ISO 3758 governs care labeling symbols, yet adoption remains voluntary in many markets, leading to consumer confusion and increased return rates. The U.S. Consumer Product Safety Commission's flammability standards for children's sleepwear (16 CFR 1615 and 1616) do not apply to athletic wear, creating a regulatory gap that some advocacy groups argue should be closed by the U.S. CPSC. Harmonization efforts through bodies like the International Textile and Apparel Association have made limited progress, as national governments prioritize domestic industry protection over streamlined trade.
Segment Analysis
By Product Type: Outerwear Gains as Performance Layering Evolves
Topwear delivered 36.55% of 2025 revenue, yet Outerwear is forecast to grow at a 7.42% CAGR, reflecting consumer demand for technical shells that navigate weather and urban style alike. The sports apparel market size for Outerwear is forecast to expand more rapidly than that for basic tees because hybrid hikers and commuters value packability and weather defense. Bottoms such as leggings and track pants sustain mid-single-digit growth, while Socks and Accessories benefit from high purchase frequency and impulse buys. Retailers report inventory risk when they over-index on commoditized hoodies and tees, as seen in Nike’s 2% apparel revenue dip in Q2 FY2026.
Outdoor recreation growth strengthens the shift toward Outerwear. U.S. hiking and trail-running participation climbed 12% between 2023 and 2025. Hybrid jackets now merge insulation, wind blocking, and moisture management in one garment, reducing the need for multiple layers. Lululemon’s Define Jacket illustrates design convergence, helping lift the company's revenue 9% in Q3 2024. The upcoming EU Ecodesign for Sustainable Products Regulation will require recyclability disclosures, potentially raising costs but increasing durability standards

Note: Segment shares of all individual segments available upon report purchase
By Sport Type: Running Apparel Dominates Through Premium Positioning
Running apparel held 37.45% share in 2025 and is on pace for a 7.83% CAGR, the highest among sport segments. The sports apparel market share leadership stems from marathon participation booms—China hosted more than 400 city-level events in 2024—and willingness to pay for performance fabrics. Soccer lines spike during tournament years, while Basketball apparel remains anchored in North America and China. Golf apparel sells fewer units but commands premium prices due to dress codes at private courses.
On Running embodies this trend, emphasizing sustainability in its high-performance gear with eco-friendly materials like sugarcane-derived EVA foam and castor bean fabrics. Their Cyclon program further underscores this commitment, enabling customers to recycle worn-out shoes. Runners' emotional ties to their gear, viewing it as an extension of their identity, further drive the segment's growth. In response, major brands are crafting purpose-driven running gear: Nike's Move to Zero initiative boasts 78% of its products made from recycled materials.
By End User: Children’s Segment Accelerates on Youth Sports Investment
In 2025, men's purchases contributed 58.47% of the total revenue; however, children's apparel is anticipated to lead growth within the sports apparel sector, with a projected CAGR of 8.26%. Parents are increasingly allocating their rising disposable incomes toward moisture-wicking uniforms designed for school leagues, driven by a growing emphasis on youth sports participation. While women's apparel continues to benefit from expanding female participation in sports and the availability of inclusive sizing options, its growth rate remains slower compared to that of children's apparel.
Government programs are playing a pivotal role in driving demand for youth sports apparel. In India, the Khelo India initiative provides direct funding for schools to purchase sports gear, ensuring accessibility for students. Similarly, in the United States, school districts are implementing stricter uniform requirements, mandating the use of technical fabrics that prioritize safety and durability. Although children's products currently account for a relatively small share of the sports apparel market, they present significant growth opportunities. This potential is particularly evident in developing economies, where governments are increasingly mandating physical education as part of school curricula, thereby creating a structural demand for children's sports apparel.
Note: Segment shares of all individual segments available upon report purchase
By Distribution Channel: Online Stores Lead Growth
Offline stores continue to dominate the sports apparel market, accounting for 65.33% of total sales. However, online channels are projected to grow at a compound annual growth rate (CAGR) of 8.65% through 2031. The increasing role of digital discovery is significantly influencing the market's growth trajectory. Despite this, high return rates for clothing, averaging between 25–30%, remain a challenge, negatively impacting profitability. Nike reported a 13% year-over-year decline in online revenue during Q2 FY2026, attributed to the company's decision to reduce wholesale listings, which had previously been a key driver of web traffic.
Offline retail is undergoing a transformation, evolving into experiential hubs to attract and retain customers. Adidas recorded a 14% increase in wholesale sales during Q3 2024, driven by its renewed partnerships with department stores. Lululemon, on the other hand, continues to leverage an omnichannel strategy, with direct-to-consumer sales contributing 69% of its Q3 2024 revenue. While the market share of online channels in the sports apparel sector is expected to grow, industry consultants anticipate that online penetration will stabilize at around 30%. This plateau is primarily due to consumers' preference for in-store shopping, which allows them to validate fit and quality before making a purchase.
Geography Analysis
North America accounted for 48.65% of 2025 revenue. The United States drives the bulk of demand, yet tariffs on Chinese imports shaved roughly 100 basis points off Nike’s margin in FY2026, encouraging near-shoring to Mexico and Central America. Canada skews toward cold-weather apparel such as insulated layers, and Mexico gains manufacturing investment under the USMCA trade framework. Regional CAGR of about 6.5% trails the global average because of market maturity and intense competition. Europe remains a sustainability-centric but fragmented arena. Adidas posted 12% year-over-year revenue growth in EMEA for Q3 2024, while Puma reported 4.8% expansion. The 2026 rollout of the EU Ecodesign for Sustainable Products Regulation forces brands to disclose durability and recyclability metrics, favoring incumbents with established eco-programs. Post-Brexit conformity divergence adds compliance layers for items sold in Great Britain versus Northern Ireland and EU-27.
Asia-Pacific offers both scale and volatility. Nike logged mid-single-digit revenue declines in Greater China in Q2 FY2026, yet On Holding achieved 109% constant-currency growth in APAC in Q3 2025. India’s sports apparel market gains momentum from Khelo India funding and a growing middle class, while Southeast Asian nations transition from export hubs to consumption markets. Japan’s mature customer base values domestic brands ASICS and Mizuno for heritage and technical rigor. South America remains price-sensitive but soccer-centric. Brazil anchors regional revenue, supported by local labels Penalty and Olympikus alongside multinationals.
Currency swings challenge pricing, although the 2026 FIFA World Cup, co-hosted by North America, is expected to boost jersey sales in Argentina, Colombia, and Chile. Average CAGR of about 6.8% through 2031 reflects gradual income gains. The Middle East and Africa is the fastest-growing region at a 9.15% CAGR. Saudi Arabia’s sports market is projected to rise from USD 8 billion in 2024 to USD 22.4 billion by 2030 under Vision 2030 mandates. UAE government programs and Qatar’s post-World-Cup infrastructure keep demand elevated. Sub-Saharan Africa’s nascent sports apparel market shows promise as mobile payments and e-commerce reduce distribution friction, despite lingering affordability constraints.
Competitive Landscape
The sports apparel market is moderately fragmented, with numerous global and regional players contributing to its competitive landscape. Prominent companies such as Nike, Adidas, Puma, Under Armour, and Lululemon hold significant shares of the market; however, no single player dominates entirely. This fragmentation provides smaller, local players with opportunities to establish themselves by targeting specific niches and catering to unique consumer demands.
The fragmented structure of the market is further highlighted by the wide range of product offerings and the diversity of target audiences. Global brands allocate substantial resources to marketing campaigns, product innovation, and sustainability initiatives to maintain their competitive advantage. Meanwhile, regional brands focus on addressing localized preferences and capitalizing on emerging trends. This dynamic fosters a highly competitive environment, enabling both established and emerging players to coexist and achieve success.
Additionally, companies are increasingly prioritizing investments in research and development (R&D) and the expansion of their distribution networks to enhance their market positions. Strong consumer loyalty toward established brands and the growing popularity of collaborative product lines have driven manufacturers to focus on these areas, ensuring sustained growth and competitiveness in the market.
Sports Apparel Industry Leaders
Nike, Inc.
Puma SE
Lululemon Athletica Inc.
Adidas Group
New Balance Athletics, Inc.
- *Disclaimer: Major Players sorted in no particular order
Recent Industry Developments
- May 2025: Santini Cycling and Pirelli Design have unveiled the 2025 “Sport Club” collection, a capsule of technical cycling apparel inspired by Pirelli’s historic Sport Club and 1960s advertising graphics, blending tradition with modern performance. The collection features two unisex cycling jerseys—Ruota, with a wheel motif and ultra-light fit, and Tape, with colorful stripes and Polartec Power Stretch fabric—alongside shorts, vests, windbreakers, and accessories.
- February 2025: Nike has partnered with Kim Kardashian’s Skims to launch NikeSKIMS, a new women’s sportswear brand focused on delivering innovative, functional, and flattering activewear, footwear, and accessories for all women athletes. According to the brand, the debut NikeSKIMS collection will launch online and at select US retail locations in spring 2025, with plans for global expansion in 2026.
- January 2025: Nike introduced the 24.7 Apparel Collection, integrating performance materials with standard designs. The collection incorporates technical fabrics, ergonomic fits, and functional components for athletic and daily use. The collection addresses market demand for multi-purpose athletic apparel that delivers functionality and comfort throughout operational hours.
- May 2024: Adidas has launched its SS24 Paris collection in Germany for the clay court season, featuring a core 8-piece range of apparel and footwear designed for optimal performance in warm conditions. According to the brand, the collection incorporates HEAT.RDY technology for breathability and FreeLift Construction for enhanced mobility, with bold color blocking and tennis court-inspired paneling.
Research Methodology Framework and Report Scope
Market Definitions and Key Coverage
Our study defines the sports apparel market as all clothing purposely engineered to support athletic performance, tops, bottoms, outerwear, socks, base layers, and accessories, measured at manufacturer selling price in USD terms.
Scope exclusion: Footwear and licensed merchandise such as fan jerseys are outside the model.
Segmentation Overview
- By Product Type
- Top Wear
- Bottom Wear
- Outer Wear
- Socks and Accessories
- By Sport Type
- Golf
- Soccer
- Basketball
- Baseball
- Running
- Other Sport Types
- By End User
- Men
- Women
- Children
- By Distribution Channel
- Online Retail Stores
- Offline Retail Stores
- By Geography
- North America
- United States
- Canada
- Mexico
- Rest of North America
- Europe
- Germany
- United Kingdom
- France
- Spain
- Netherlands
- Italy
- Sweden
- Poland
- Belgium
- Rest of Europe
- Asia-Pacific
- China
- India
- Japan
- Australia
- South Korea
- Indonesia
- Thailand
- SIngapore
- Rest of Asia-Pacific
- South America
- Brazil
- Argentina
- Colombia
- Chile
- Peru
- Rest of South America
- Middle East and Africa
- United Arab Emirates
- South Africa
- Nigeria
- Saudi Arabia
- Egypt
- Morocco
- Turkey
- Rest of Middle East and Africa
- North America
Detailed Research Methodology and Data Validation
Primary Research
Mordor analysts conduct structured interviews with sourcing heads at contract factories, fabric innovators, sporting-goods retailers, and apparel-tech startups across North America, Europe, and Asia-Pacific.
These dialogs validate average selling prices, channel mix shifts, and material-cost trajectories that secondary data only hint at.
Desk Research
We begin by mapping the landscape through publicly available, high-quality sources such as UN Comtrade trade codes for HS 61/62, Eurostat retail indices, the U.S. Bureau of Economic Analysis personal-consumption tables, and World Bank household-income series.
Trade association briefs from the World Federation of the Sporting Goods Industry and the National Sporting Goods Association supply brand shipment splits and participation rates.
Company 10-Ks, investor decks, and press releases round out annual pricing and mix shifts.
Subscription databases, including D&B Hoovers for brand revenues and Dow Jones Factiva for deal flow, fill specific disclosure gaps.
This list is illustrative; many additional references are tapped as needed.
Market-Sizing & Forecasting
A top-down construct scales global apparel output, then isolates the athletic-wear cohort using sport participation ratios, performance-fabric penetration rates, and retailer sales splits; selective bottom-up roll-ups of key supplier revenues cross-check totals before finalization.
Core variables include active-population growth, polyester and elastane cost curves, e-commerce share, and sponsorship spending, each trended with multivariate regression.
Five-year forecasts apply ARIMA smoothing, with scenario tweaks vetted in expert calls.
Gaps in supplier rolls are bridged by regional ASP proxies anchored to customs invoice medians.
Data Validation & Update Cycle
Our model passes three analyst reviews; variance thresholds flag anomalies above +/-5%; flagged items trigger fresh calls or source re-checks.
Reports refresh annually, while material events, currency swings, tariff changes, and major acquisitions prompt interim updates so clients receive the latest view.
Why Mordor's Sports Apparel Baseline Commands Reliability
Published numbers vary because firms diverge on scope, pricing levels, and refresh cadence.
Some fold footwear into totals or report retail receipts, while others lock in exchange rates for years.
Benchmark comparison
| Market Size | Anonymized source | Primary gap driver |
|---|---|---|
| USD 266.74 B (2025) | Mordor Intelligence | - |
| USD 365.81 B (2024) | Global Consultancy A | Combines apparel and footwear; uses retail receipts |
| USD 220.35 B (2025) | Industry Association B | Excludes accessories; applies conservative pricing and earlier demand survey panel |
The comparison shows that once like-for-like scope and valuation levels are aligned, our USD 266.74 billion 2025 baseline sits squarely between overstated retail-value tallies and narrower, product-only counts, offering decision-makers a balanced, transparent anchor rooted in traceable variables and repeatable steps.
Key Questions Answered in the Report
How large is the sports apparel market in 2026?
The sports apparel market size stands at USD 283.66 billion in 2026.
What is the forecast CAGR for sports apparel sales to 2031?
Revenue is projected to grow at a 7.16% CAGR through 2031.
Which region is expanding fastest in sports apparel demand?
The Middle East and Africa region is forecast to post the highest 9.15% CAGR through 2031.
Which product category is expected to grow most quickly?
Outerwear leads growth with a projected 7.42% CAGR through 2031.


