
Spinning Machinery Market Size and Share
Market Overview
| Study Period | 2020 - 2031 |
|---|---|
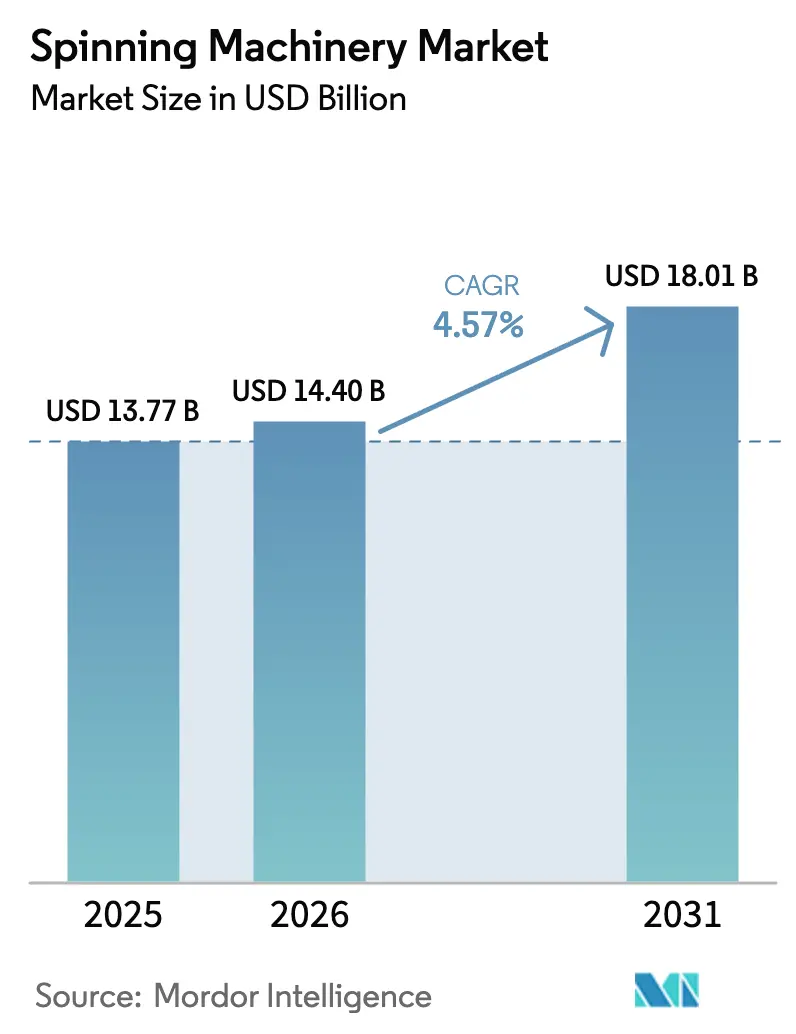
| Market Size (2026) | USD 14.4 Billion |
| Market Size (2031) | USD 18.01 Billion |
| Growth Rate (2026 - 2031) | 4.57 % |
| Fastest Growing Market | Middle East and Africa |
| Largest Market | Asia-Pacific |
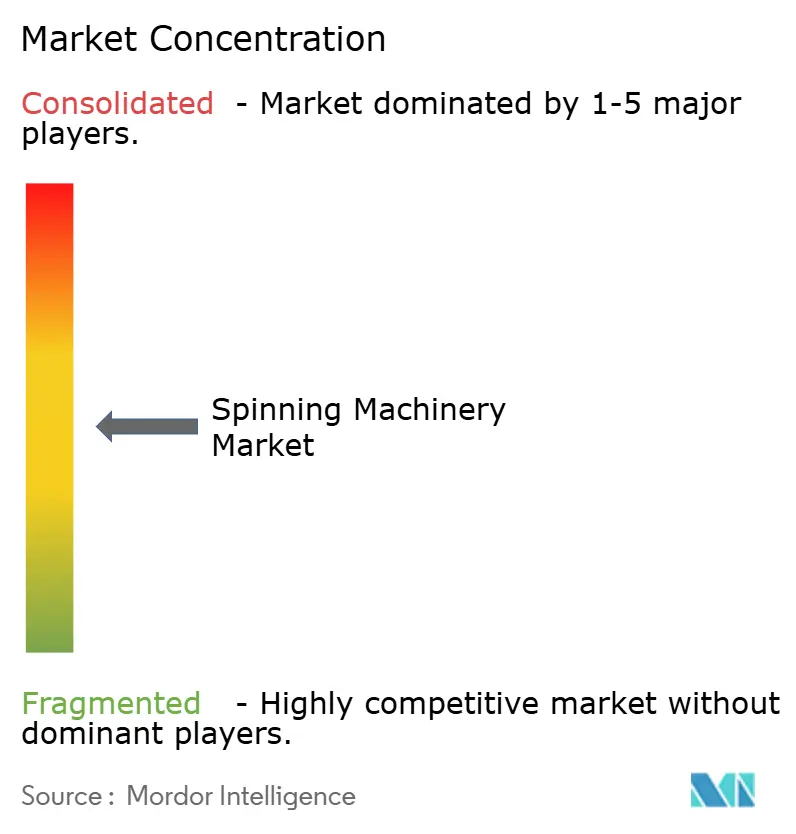
| Market Concentration | Medium |
Major Players *Disclaimer: Major Players sorted in no particular order Image © Mordor Intelligence. Reuse requires attribution under CC BY 4.0. | |
Spinning Machinery Market Analysis by Mordor Intelligence
The spinning machinery market size in 2026 is estimated at USD 14.4 billion, growing from 2025 value of USD 13.77 billion with 2031 projections showing USD 18.01 billion, growing at 4.57% CAGR over 2026-2031. This trajectory reflects a decisive industry pivot toward digital factory models, energy-frugal motors, and recycled-fiber compatibility. Most investment flows target AI-enabled ring and compact lines that boost uptime, while medium-scale mills adopt remote diagnostics to safeguard margins in a volatile cotton environment. Demand also receives support from governments that subsidize machinery upgrades and from brands mandating lower Scope-3 emissions across yarn suppliers. Competitive intensity is rising because software integrators now pitch smart-factory retrofits that extend the life of installed frames and reduce the total cost of ownership.
Key Report Takeaways
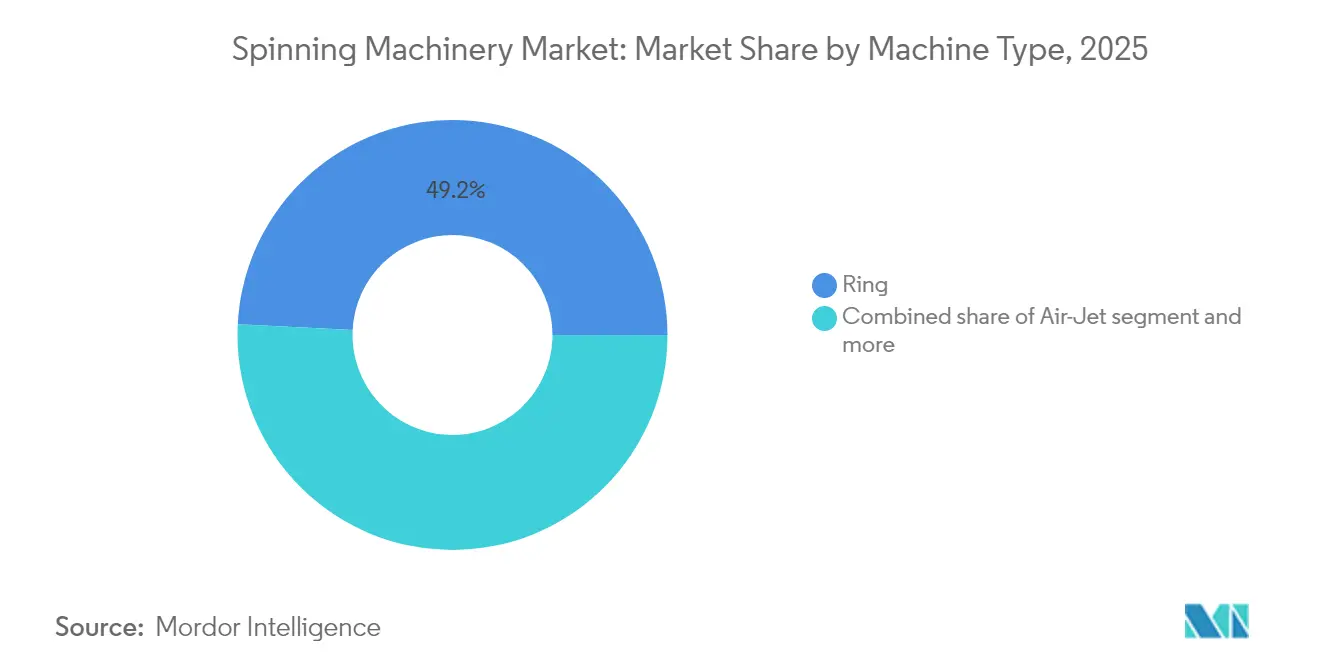
- By machine type, ring spinning led with 49.20% of the spinning machinery market share in 2025, whereas vortex/compact equipment is projected to advance at a 5.78% CAGR through 2031.
- By material, synthetic fibers accounted for a 61.90% slice of the spinning machinery market size in 2025, while recycled and regenerated fibers are rising at a 6.14% CAGR to 2031.
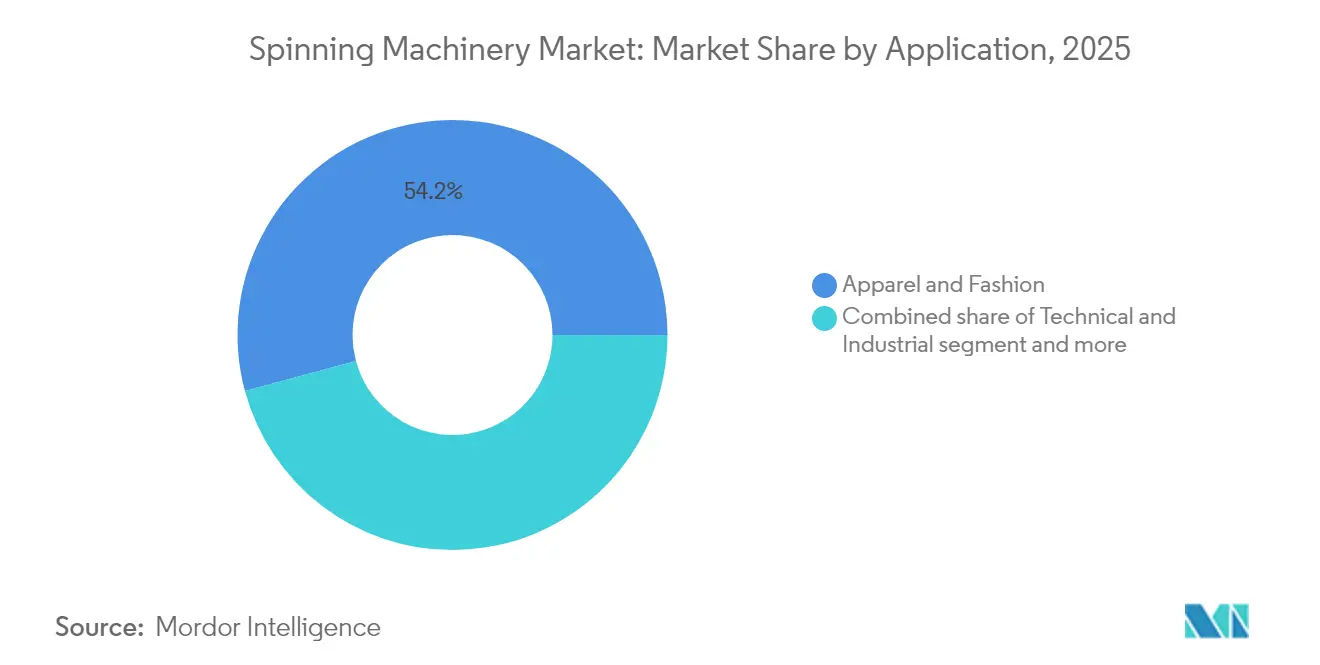
- By application, apparel and fashion held 54.20% of the spinning machinery market share in 2025; technical and industrial textiles are positioned to expand at a 5.88% CAGR through 2031.
- By automation level, semi-automated lines represented 49.10% of the spinning machinery market size in 2025, yet fully digital factories are on track for a 6.67% CAGR over 2026-2031.
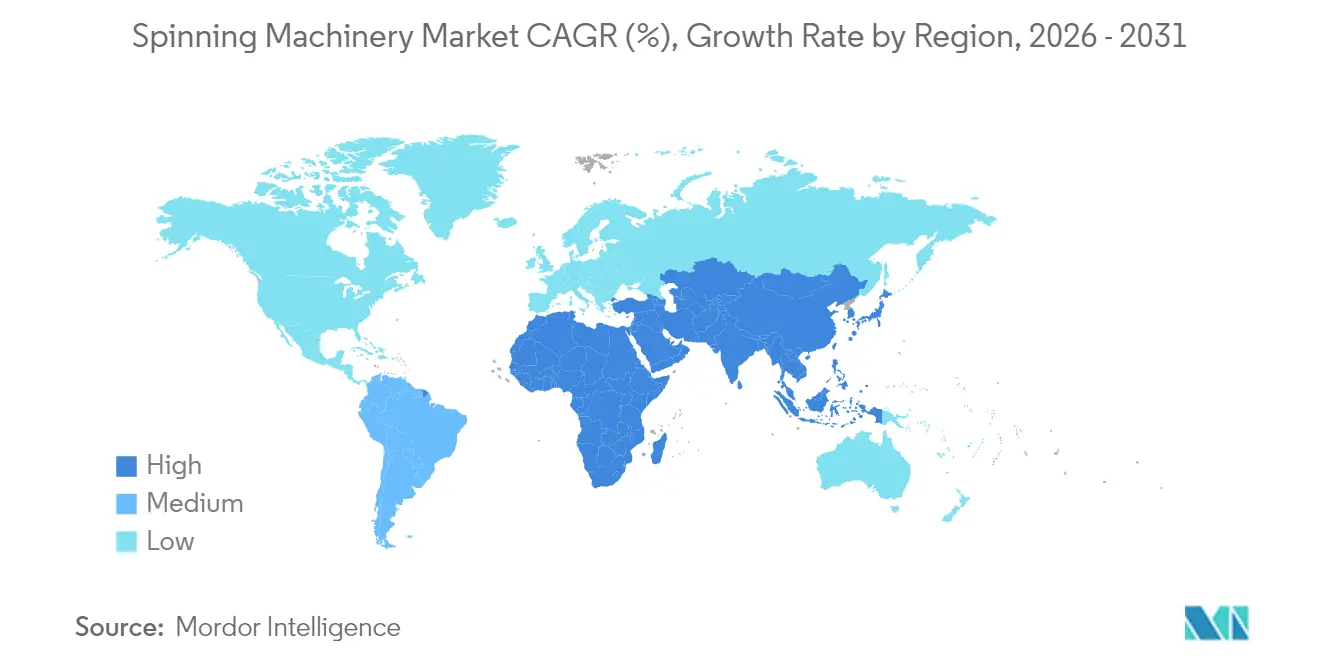
- By geography, Asia-Pacific remained the primary revenue hub with 54.10% of the spinning machinery market share in 2025, whereas the Middle East and Africa are forecast to show the fastest 5.83% CAGR to 2031.
Note: Market size and forecast figures in this report are generated using Mordor Intelligence’s proprietary estimation framework, updated with the latest available data and insights as of 2026.
Market Trends and Insights
Drivers Impact Analysis of Spinning Machinery Market*
| Drivers | (~) % Impact on CAGR Forecast | Geographic Relevance | Impact Timeline |
|---|---|---|---|
| Surging adoption of Industry 4.0 enabled spinning lines | +1.2% | Global, with APAC and Europe leading | Medium term (2-4 years) |
| Technical/functional textile demand boom | +1.1% | Global, with North America and Europe premium segments | Medium term (2-4 years) |
| Capacity shift to cost-competitive Asian hubs | +0.9% | APAC core, spill-over to MEA | Long term (≥ 4 years) |
| Government modernization incentives | +0.8% | India, China, Turkey, Egypt | Short term (≤ 2 years) |
| ESG-linked financing for low-energy machines | +0.4% | Europe, North America, select APAC markets | Long term (≥ 4 years) |
| Circular-fiber recycling compatible retrofits | +0.3% | Europe, North America | Medium term (2-4 years) |
| Source: Mordor Intelligence | |||
Surging Adoption of Industry 4.0 Enabled Spinning Lines
Mills now deploys IoT sensors and cloud analytics to cut idle time and stabilize quality. Rieter’s ESSENTIAL suite streams real-time spindle data that trims operator headcount by 30% and lifts raw-material yield by 1-2%. Digital twins, showcased through a Siemens-Spinnova collaboration, allow virtual commissioning that accelerates ramp-up and avoids costly rework. Because many APAC mills run 100,000+ spindles, even fractional efficiency gains translate into seven-figure annual savings. Software subscription revenues are also rising, giving machinery OEMs recurring income once hardware sales mature. Implementation costs remain high, but lenders favor projects with traceable resource savings, making the business case more attractive[1]Dario Ballotta, “ESSENTIAL: Real-Time Spinning Mill Digital Suite 2025 Update,” Rieter AG, rieter.com.
Technical/Functional Textile Demand Boom
Automotive, medical, and geotextile segments require yarns that can endure extreme conditions, pushing mills toward compact and air-jet equipment that delivers superior evenness. India approved 168 technical-textile projects worth INR 509 crore (USD 61.3 million) under its National Technical Textiles Mission, underscoring public support for specialty fibers. European Tier-1 suppliers are also shifting from woven to knit airbag fabrics, adding new demand for high-tenacity polyamide spinning lines. Because technical textiles fetch margin premiums of 20-30% over commodity yarns, mills are more willing to invest in automation that assures repeatable quality.
Capacity Shift to Cost-Competitive Asian Hubs
Rising labor costs in coastal China push manufacturers toward Vietnam, Indonesia, and Bangladesh. Swedish firm Syre will invest USD 1 billion for a polyester-fiber recycling complex in Vietnam that targets 250,000 tons of annual capacity by 2028. Egypt’s Suez Canal Economic Zone sealed a USD 120 million deal with Eroğlu Knitting to set up a fully integrated plant, illustrating how MEA nations court vertically integrated projects. Machinery suppliers winning these greenfield contracts typically pair modular machines with on-site training, enabling quick capacity scale-up without sacrificing product diversity. As relocations increasingly center on recycled-fiber ecosystems, equipment capable of handling variable staple lengths enjoys a clear edge.
Government Modernization Incentives
India’s 2025-26 Union Budget earmarked INR 5,272 crore (USD 635.2 million) for textile innovation, including duty relief on shuttle-less looms and a PLI extension for small spinners. Tamil Nadu rolled out a 10-year, INR 500 crore (USD 60.2 million) interest-subvention plan that covers 6% credit costs on new ring frames and open-end machines. China and Turkey offer similar subsidy matrices tied to energy savings and digital traceability. Such policies cut payback periods to below five years, enlarging the eligible buyer pool and shortening upgrade cycles[2]Minakshi Gupta, “Union Budget 2025-26: Allocation for Textile & Apparel,” Ministry of Finance, dea.gov.in.
Restraints Impact Analysis of Spinning Machinery Market*
| Restraints | (~) % Impact on CAGR Forecast | Geographic Relevance | Impact Timeline |
|---|---|---|---|
| High capital intensity & uncertain ROI | -1.1% | Global, particularly affecting SMEs | Short term (≤ 2 years) |
| Shortage of digital-skill operators | -0.7% | Global, acute in emerging markets | Medium term (2-4 years) |
| Climate-driven cotton supply volatility | -0.5% | Global cotton-dependent regions | Long term (≥ 4 years) |
| Carbon-border taxation risk | -0.3% | EU imports, affecting global supply chains | Medium term (2-4 years) |
| Source: Mordor Intelligence | |||
High Capital Intensity & Uncertain ROI
Fully automated lines with 100,000 spindles can cost over USD 40 million, stretching SME balance sheets. Fluctuating polyester and cotton prices compress gross margins and extend payback, deterring modernization. Lenders now request ESG disclosures and digital roadmaps before releasing capital, adding administrative burden. Mills in over-capacity regions often defer upgrades, choosing incremental repairs instead. This dynamic keeps the average global ring frame age above 12 years, well beyond optimal efficiency levels.
Shortage of Digital-Skill Operators
Industry 4.0 adoption raises demand for technicians versed in PLC programming, cloud networking, and predictive analytics. Deloitte estimates a potential 1.9 million unfilled U.S. manufacturing roles by 2033, indicating a worldwide skill mismatch. Bangladesh’s fragmented SME base struggles to finance large-scale skilling programs, slowing digital rollout. OEMs respond with intuitive HMIs and remote coaching, yet operator deficits still prolong ramp-up schedules and bump defect rates[3]Megan Conley, “Digital-Skill Deficits in Emerging-Market Textile Mills,” Journal of Manufacturing Systems, sciencedirect.com.
*Our forecasts treat driver/restraint impacts as directional, not additive. The impact forecasts reflect baseline growth, mix effects, and variable interactions.
Spinning Machinery Market Segment Analysis
By Machine Type:
Ring Dominance Faces Vortex ChallengeRing frames generated 49.20% of 2025 revenue. Their broad fiber compatibility allows mills to toggle between cotton, polyester, and blends without retooling, safeguarding utilization rates. Rieter’s compact line improves yarn evenness and cuts waste, generating an incremental cash flow of CNY 7.3 million (USD 1.03 million) annually at a 100,000-spindle mill. This tangible saving reinforces their position in the spinning machinery market. The vortex/compact niche, although smaller, will outpace at a 5.78% CAGR as technical textile consumption grows. Saurer’s Autocoro 11 rotor machine claims 10% lower energy use than its predecessor, appealing to mills chasing Scope-3 emission cuts. Air-jet systems serve specialty polypropylene and viscose, expanding option sets for mills repositioning up the value chain.
Second-tier vendors bundle blow-room, carding, and draw-frame units with the core spinning element, promoting one-stop procurement. Larger contracts increasingly hinge on total-line efficiency guarantees rather than individual machine specs. With many buyers contemplating end-to-end upgrades, vendors that offer simulation tools and virtual commissioning secure competitive leverage. This environment should keep the spinning machinery market on a steady modernization course, even if yarn prices fluctuate.


By Material:
Synthetic Leadership Meets Recycled GrowthSynthetic fibers represented 61.90% of total throughput in 2025, mirroring polyester’s cost advantage and durability attributes. Consistency in staple length and fineness allows higher spindle speeds, lowering unit costs in the spinning machinery market. Recycled and regenerated inputs, while only a minor share, will clock a 6.14% CAGR because brands pledge to hit 25-50% recycled content by 2030. ANDRITZ’s shredding line processes up to 3,000 kg per hour of post-consumer waste, supplying flake suitable for open-end yarns. Mills that refine recycled fiber blends can command 15-20% price premiums, offsetting modest yield losses.
Processing reclaimed fibers strains traditional carding settings due to short staple lengths, so equipment with adaptive auto-levellers is gaining traction. Rieter’s recycling classification tool forecasts yarn quality based on input metrics, helping buyers de-risk investments. Natural fibers will hold niche positions in luxury shirting and bed linen, yet climatic risks and water scarcity limit aggressive capacity additions. Persistent policy incentives, such as EU-wide EPR schemes, should perpetuate recycled fiber momentum through the forecast horizon.
By Application:
Apparel Stability Versus Technical GrowthApparel and fashion applications consumed 54.20% of spindles in 2025, a function of sheer global population and fast-fashion replenishment cycles. Retooling cycles gravitate around design seasons, making flexibility important in the spinning machinery market. Technical and industrial uses, however, are set for a 5.88% CAGR, buoyed by EV battery insulation, wound dressings, and flood-defense geotextiles. India’s INR 509 crore (USD 61.3 million) mission funds R&D for aramid and carbon yarns, spurring domestic machinery orders. High tenacity yarns can fetch up to 3 times the price of standard ring-spun cotton, improving ROI on advanced frames.
Home and household textiles retain a mid-single-digit growth profile tied to rising disposable incomes. Energy-saving air-jet machines find favor in curtain and upholstery fabric mills where bulk orders reward productivity. Technical textile mills typically adopt end-to-end traceability, pushing OEMs to integrate RFID and blockchain gateways that certify provenance. This shift forces vendors to embed open APIs, widening the service footprint and thereby revenue across the spinning machinery industry.
By Automation Level:
Digital Factory AccelerationSemi-automated lines covered 49.10% of installations in 2025. They blend manual doffing with auto-piecing, giving cost-sensitive mills a gateway to smart production. Yet fully digital solutions will expand at a 6.67% CAGR as cloud connectivity becomes mandatory in brand audit protocols. A Vietnamese mill running 120,000 smart spindles reported an 88% reduction in changeover time and 5% higher overall equipment effectiveness. These gains support the premium pricing of intelligent frames, sustaining a vibrant spinning machinery market size.
Cybersecurity, however, emerges as a procurement criterion. OEMs now ship industrial firewalls and segmented networks by default, partly to meet EU Machinery Regulation updates. Post-sale, analytics subscriptions add annual revenue equal to 3-5% of original hardware value, shifting the business model toward software-as-a-service. Mills approve such spending because predictive alerts avert costly rotor crashes and bearing failures. Gradual adoption will persist, but the economics favor a steady climb toward end-to-end digital twins.
Geography Analysis
APAC Spinning Machinery Market
Asia-Pacific commanded 54.10% of the spinning machinery market in 2025. China operated roughly 94 million spindle equivalents and India 63 million, together anchoring global supply. China now channels capex into compact-frame retrofits to offset higher wages, whereas India leans on state incentives that waive import duties on shuttle-less looms. The USD 635.2 million federal outlay and USD 60.2 million Tamil Nadu subsidy underline the political will to create globally competitive clusters. Suppliers able to localize key components enjoy tariff relief, winning big orders from integrated mills in Gujarat, Shandong, and Zhejiang.
EMEA and the Americas Spinning Machinery Market
The Middle East and Africa will post the fastest 5.83% CAGR through 2031 because fresh capital pours into Egypt, Ethiopia, and the Gulf. Eroğlu’s USD 120 million Egyptian plant links spinning to garmenting, which cuts logistics cost and speeds trend-to-shelf cycles. Turkey tapped USD 50 million from IFC for a polyester chip line and recycling spin unit, illustrating multilateral backing for circular capacity. Buyers here seek turnkey packages with vendor-financed options that defer principal until first shipment, a model suiting European OEMs chasing volume growth outside saturated home markets. North America and Europe remain technology upgrade zones rather than greenfield arenas. EU mills brace for the Carbon Border Adjustment Mechanism, incentivizing the shift to renewable-powered spindle motors and low-chem dye routes. U.S. cotton-spinning activity is niche, aimed at near-shoring premium athletic wear. Both regions value traceability, pushing OEMs to certify blockchain readiness. South America’s demand is modest but stable; Brazilian producers hedge currency swings by leasing rather than buying frames outright. These varied profiles ensure the spinning machinery market retains geographic balance between expansion and replacement revenues.

Regulatory Landscape
Spinning machinery suppliers selling into Europe operate under the EU Machinery Regulation (Regulation (EU) 2023/1230), with the consolidated text effective as of 29 May 2026. The regulation tightens emphasis on essential health and safety requirements and requires appropriate conformity assessment and technical documentation before machinery is placed on the EU market. For spinning, preparatory, and winding equipment, this raises the compliance workload for OEMs and importers.
At the standards level, ISO 11111 (including ISO 11111-1:2016 and ISO 11111-2:2005 with later amendments) anchors internationally recognized safety requirements for textile spinning preparatory and spinning machines. This supports harmonized safety design and risk assessment practices across regions. In India, the Ministry of Heavy Industries issued the Machinery and Electronic Safety (Omnibus Technical Regulation) Second Amendment Order, 2025, pointing toward a more unified BIS-linked certification approach for machinery and electrical equipment safety. For global OEMs managing market access, it adds another localization layer for documentation and compliance.
Value Chain Analysis
The spinning machinery value chain starts with upstream inputs such as precision castings and machined parts, motors and drives, bearings, electronics (PLCs, sensors), and software modules that enable connectivity and analytics. OEMs design and assemble frames and associated sections (blow-room, carding, draw frames, combers, roving, ring/rotor/air-jet/vortex, and winders). They then deliver through direct sales, agents, and project integrators that handle line engineering, commissioning, and operator training, followed by a long aftermarket cycle in spares, consumables, upgrades, and service contracts.
Recent industry moves reflect a shift from standalone machines toward integrated system platforms with broader fiber coverage. Rieter completed the acquisition of Barmag in February 2026, creating a Man-Made Fiber Division and strengthening its position across synthetic and man-made fiber processing ecosystems. On the integration side, Saurer points to Cone-to-Carton automation that links spinning to downstream logistics. Cluster-style procurement and coordinated projects also shape demand aggregation, such as Trutzschler China signing a collective agreement in June 2026 to supply spinning technology to 14 companies under the Global Green Fiber High-End Manufacturing Project, reinforcing how large multi-site programs channel orders and standardize equipment architectures.
Competitive Landscape
Global supply remains moderately fragmented. Rieter, Saurer, and Murata together captured about 30% of staple-fiber machinery revenues in 2024, leveraging integrated portfolios from blow-room through winding. The rest of the field comprises specialized rotor innovators, air-jet pioneers, and regional assemblers that rely on licensed designs. Scale economies in casting, precision tooling, and global service networks create high entry barriers, supporting a steady but not dominant concentration.
Strategy revolves around ecosystem building. Rieter bundles its ESSENTIAL suite with service contracts that guarantee uptime, turning one-off sales into annuity streams. Murata holds 86 VORTEX-related patents, protecting its air-jet niche and enabling premium pricing. Saurer partners with component suppliers to co-develop low-friction bearings, enhancing energy metrics without redesigning entire frames. Digital startups chip away by offering sensor kits that retrofit legacy spindles, winning deals where mills lack capital for full replacement. Yet even these disruptors often partner with OEMs for distribution, reinforcing incumbents’ reach.
Regional production hubs influence rivalry. Chinese firms scale aggressively on cost but are beginning to add cloud modules to satisfy domestic ESG mandates. European vendors pitch carbon-neutral manufacturing credentials, appealing to brands under CSRD reporting rules. Indian assemblers still focus on ring frames under USD 75 per spindle, targeting tier-2 cotton mills. As service sophistication grows, software differentiation will likely surpass hardware specs, nudging competition toward analytics algorithms and machine-learning accuracy.
Spinning Machinery Industry Leaders
Rieter
Saurer Intelligent Technology AG
Toyota Industries (Kirloskar Toyota)
Lakshmi Machine Works
Trützschler Group SE
- *Disclaimer: Major Players sorted in no particular order
Spinning Machinery Market Companies Covered in this Report
- Rieter
- Saurer Intelligent Technology AG
- Toyota Industries (Kirloskar Toyota)
- Lakshmi Machine Works
- Trützschler Group SE
- Murata Machinery
- Savio Macchine Tessili
- Marzoli Spinning Solutions
- Itema S.p.A.
- A.T.E. Pvt Ltd
- Crosrol
- Jingwei Textile Machinery
- RIFA
- Tsudakoma
- Haijia Machinery
- Qingdao Dongjia
- Premier Mills
- Vardhman Textiles (Machinery division)
- Nahar Spinning
- Bajaj Steel Industries (Ginning)

Market Opportunities and Future Outlook
Automation-led retrofits and end-to-end flow optimization remain a key whitespace where mills target measurable labor, energy, and quality gains without always replacing entire lines. Supplier activity at ITM 2026 highlighted this direction, with vendors showcasing platforms that combine machinery, connectivity, and in-line intelligence to reduce process variation and manual handling. This broadens the addressable scope beyond ring or rotor frames to include digital tools, controls, and logistics integration.
Processing of recycled, regenerated, and multi-blend feedstocks is another opportunity area, since variable staple lengths and contamination sensitivity increase the need for improved carding, draw-frame control, and compacting solutions. Trutzschler published performance data (June 2026) for its Integrated Draw Frame IDF 3 with the TC 30i card, and Rieter launched COMPACT4 as a universal compacting solution for ring spinning machines, both aimed at stabilizing yarn quality across wider input and count ranges. Separately, energy-efficiency upgrades keep gaining traction as a procurement anchor through new machine generations that are marketed on lower energy use, aligning with replacement decisions in regions facing tighter carbon accounting and electricity cost volatility.
Recent Industry Developments in Spinning Machinery Market
- April 2026: Saurer launched the TechnoCorder TC2plus, a major upgrade of its automation platform, enabling multi-mill deployment and integration with Industry 4.0 analytics. The launch expands Saurer's footprint in high-specification yarn production and strengthens its competitive positioning for technical textiles.
- February 2026: Rieter completed the acquisition of Barmag from OC Oerlikon and integrated it as its Man-Made Fiber Division. The deal expanded Rieter’s portfolio toward man-made fiber capabilities, supporting larger, more integrated project bids across synthetic and recycled fiber value chains.
- December 2024: IFC extended USD 50 million financing to Turkey’s Kucukcalik Group for polyester chip, spinning, and recycling expansion. This financing supported circular and man-made fiber capacity additions, which in turn feeds downstream demand for compatible spinning and preparatory equipment in Turkey and surrounding export-oriented textile hubs.


Spinning Machinery Market Report Scope and Research Methodology
Market Definition and Coverage
For this study, the spinning machinery market covers equipment sold for converting fibers into yarn in industrial spinning lines, including major spinning systems and related machine groups used in yarn preparation and winding, reported in value terms.
Scope exclusions: We exclude used equipment resale, in-house refurbished machines, and routine consumables and spare parts that are not sold as part of a machine shipment.
Segments Covered in This Report
- By Machine Type
- Ring
- Rotor / Open-End
- Air-Jet
- Vortex / Compact
- Others (Blow-room, Carding, Draw-frame, Comber, Winder)
- By Material
- Natural Fibers (Cotton, Jute, Flax/Linen, Hemp, Coir, Wool, Silk, Alpaca, Cashmere, Mohair, etc.)
- Synthetic Fibers (Polyester, Nylon, Acrylic, Olefin/Polypropylene, Elastane/Spandex, Aramid, etc.)
- Recycled / Regenerated Fibers (Viscose Rayon, Modal, Lyocell/Tencel, Cupro, Acetate, Recycled Polyester (rPET), Recycled Nylon, PLA Fiber, etc.)
- By Application
- Apparel & Fashion
- Home & Household Textiles
- Technical & Industrial Textiles
- By Automation Level
- Conventional
- Semi-Automated
- Fully Digital / Smart Factory
- By Geography
- North America
- United States
- Canada
- Mexico
- South America
- Brazil
- Argentina
- Rest of South America
- Europe
- United Kingdom
- Germany
- France
- Italy
- Spain
- BENELUX (Belgium, Netherlands, and Luxembourg)
- NORDICS (Denmark, Finland, Iceland, Norway, and Sweden)
- Rest of Europe
- Asia-Pacific
- China
- India
- Japan
- Australia
- South Korea
- ASEAN (Indonesia, Thailand, Philippines, Malaysia, Vietnam)
- Rest of Asia-Pacific
- Middle East and Africa
- Saudi Arabia
- United Arab Emirates
- Qatar
- Kuwait
- Turkey
- Egypt
- South Africa
- Nigeria
- Rest of Middle East and Africa
- North America
Data Sources, Market Sizing, and Validation
Desk Research
Desk research starts with verifying where spinning capacity is growing and what machines are being installed. We reviewed public sources such as UN Comtrade trade statistics, World Bank and IMF macro series, and ILO labor indicators to estimate investment ability and manufacturing shifts by region. We also referenced industry bodies and publications, including the International Textile Manufacturers Federation shipment statistics, to sanity-check shipment direction by machine class and destination market.
To ground the supplier side, we used annual reports, investor presentations, and reputable press coverage from machinery makers and textile groups, then cross-checked key numbers with paid subscriptions for company financials and intelligence, patents, and shipment-level import and export data where it was available. These inputs help keep assumptions realistic on average selling prices, replacement cycles, and regional demand mix, before interviews are used to correct blind spots. The sources named above are illustrative rather than exhaustive, and additional references were used across data collection, validation, and clarification.
Primary Interviews and Surveys
Primary work helped confirm how mills and machinery channels actually buy, which upgrades are being prioritized, and what price movements look like across different spinning systems. We spoke with a mix of machinery manufacturers, distributors and integrators, mill operators, and textile industry specialists across APAC, EMEA, and the Americas, so regional installation patterns and utilization realities could be reflected in the final model.
Distribution of primary research fieldwork respondents
| Company type | Respondent position | Region |
|---|---|---|
| Top tier: 33% | CXOs: 16% | APAC: 43% |
| Mid tier: 46% | Functional/Unit leaders: 26% | EMEA: 33% |
| Smaller Players: 21% | Managers: 58% | Americas: 24% |
Market-Sizing & Forecasting
Sizing is built using a top-down and bottom-up approach, where textile manufacturing investment signals are converted into a machinery demand pool, and then corroborated with selective supplier and trade checks. On the top-down side, production and trade data are used to reconstruct where spinning capacity is being added or modernized, and that is translated into machine demand using typical line configurations and replacement timing.
To keep the model practical, we track market fingerprints that usually explain most value movement, including new spindle and rotor installation volumes, mill modernization cycles, average selling prices by key machine classes, energy-efficiency upgrade adoption, and shifts in fiber use (natural versus synthetics and recycled inputs). Forecasting uses scenario analysis supported by a simple multivariate regression, where demand is tied to textile output expectations, export competitiveness signals, and financing conditions discussed in interviews. Where bottom-up visibility is weaker in smaller regions, we fill gaps using import and export shipment patterns and validated ranges for ASP and unit intensity, then adjust only when primary feedback shows a clear mismatch.
Data Validation & Update Cycle
Validation is done by checking the modeled totals against independent signals, such as machinery shipment trend direction, textile export momentum, and announced mill expansions, before the final numbers are signed off. If an outlier appears, we revisit the assumptions that drive it, and respondents are re-contacted when the variance cannot be explained through public data.
Each report goes through multi-step analyst review, including unit and currency consistency checks, year-on-year movement checks, and cross-region reasonableness checks, so the story matches the math. The model is refreshed annually, and interim updates are made when material changes affect demand, pricing, or investment timing. Before delivery, we perform a final pass to ensure the latest developments are reflected in the outputs.
Mordor Intelligence's Global Spinning Machinery Market Size Versus Other Published Estimates
Published market values for spinning machinery can vary because the market boundary is not always treated the same, and because pricing and shipment timing assumptions are updated at different speeds. In practice, the biggest differences usually come from what machine groups are counted, which years are treated as the current baseline, and how currency and inflation effects are handled.
By tracking spindle and rotor shipment signals and refreshing year-specific average selling prices with currency conversion timing, Mordor Intelligence keeps the 2026 value focused on new spinning machinery sales rather than blending in wider textile machinery categories or service-heavy add-ons.
Benchmark comparison
| Source | Market Size | Gaps in Research Methodology |
|---|---|---|
| Mordor Intelligence | USD 14.4 B (2026) | |
| Global Consultancy A | USD 5.2 B (2024) | Uses an earlier base year and appears to apply a narrower pricing and scope lens, which can undercount value if connected preparation and winding equipment and newer ASP levels are not fully reflected. |
| Industry Report B | USD 5.5 B (2025) | Likely applies a tighter machine-only definition and a different pricing update cadence, which can compress the value versus a model anchored to installation and replacement activity. |
The spread in the table is mostly explained by base-year choice, scope edges around what is treated as spinning-line machinery, and how quickly ASP and currency timing are updated. Our process stays traceable because the assumptions tie back to installation intensity, replacement behavior, and region-level demand checks that can be repeated.


Key Questions Answered in the Report
How large is the global spinning machinery market in 2026?
The spinning machinery market size is USD 14.4 billion in 2026.
What CAGR is projected for spinning machinery through 2031?
The market is forecast to expand at a 4.57% CAGR from 2026 to 2031.
Which machine type is growing fastest?
Vortex/compact spinning is expected to post a 5.78% CAGR, outpacing other categories.
Why are recycled fibers important for machinery demand?
Brand sustainability targets push mills to process recycled inputs, driving 6.14% CAGR for related equipment.
Page last updated on:


 Your data is secure and never sold or shared.


