Soybean Seed Market Size
Market Overview
| Study Period | 2017 - 2030 |
| Base Year For Estimation | 2024 |
| Forecast Data Period | 2025 - 2030 |
| Market Size (2025) | USD 11.07 Billion |
| Market Size (2030) | USD 15.05 Billion |
| Growth Rate (2025 - 2030) | 6.35% CAGR |
| Market Concentration | Medium |
Major Players*Disclaimer: Major Players sorted in no particular order Image © Mordor Intelligence. Reuse requires attribution under CC BY 4.0. |
|

Soybean Seed Market Analysis
The Soybean Seed Market size is estimated at 11.07 billion USD in 2025, and is expected to reach 15.05 billion USD by 2030, growing at a CAGR of 6.35% during the forecast period (2025-2030).
The soybean seed industry continues to undergo significant technological transformation, driven by advances in soybean breeding techniques and genetic modification. In 2022, transgenic breeding emerged as the dominant breeding technique, accounting for 69.1% of all soybean breeding methods globally. This shift reflects the industry's increasing focus on developing seeds with enhanced traits for pest resistance, drought tolerance, and higher yields. The adoption of these advanced breeding technologies has enabled seed companies to develop varieties that can better withstand environmental stresses while maintaining optimal productivity levels.
The industry is witnessing a notable shift in consumer preferences towards non-GMO varieties, particularly in developed markets. This trend is evidenced by the significant 20.4% market share held by non-transgenic hybrid seeds in 2022, demonstrating the growing demand for conventional breeding methods. Seed companies are responding to this trend by expanding their conventional soybean seed product portfolios and investing in traditional breeding programs to develop high-performing conventional varieties that can compete with their transgenic counterparts in terms of yield and disease resistance.
Agricultural sustainability and environmental concerns are increasingly shaping the soybean market landscape. Seed developers are focusing on creating varieties that require fewer inputs while maintaining high productivity levels. The industry has seen remarkable success in developing drought-resistant and pest-tolerant varieties, with modern hybrid soybean seed demonstrating superior adaptability to different regions and weather conditions. This advancement has been particularly crucial in addressing the challenges posed by changing climate patterns and the need for more resilient agricultural systems.
The market is experiencing a significant transformation in production techniques and technology adoption. Brazil, a leading market, exemplifies this trend with 98.4% of its soybean seed market utilizing transgenic hybrids in 2022, highlighting the widespread acceptance of advanced seed technologies in major producing regions. This technological adoption has been accompanied by improvements in seed treatment methods, precision planting technologies, and integrated pest management systems, creating a more sophisticated and efficient production environment. These advancements have contributed to improved seed quality, better germination rates, and enhanced overall crop performance.
Global Soybean Seed Market Trends
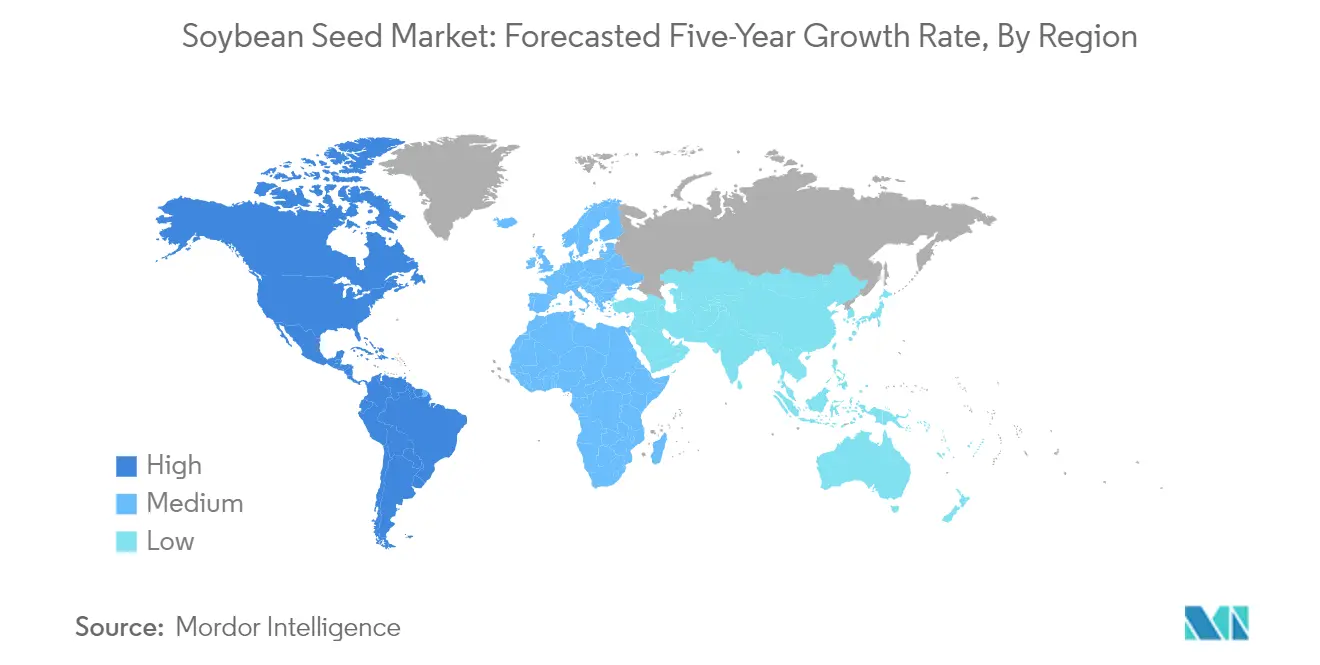
South America is the leading soybean-producing region, and Brazil and India are the major countries with the highest growth potential in the world
- Soybean is one of the major oilseed crops cultivated in the world. In 2022, soybean cultivation was spread over 132.1 million hectares, which accounted for 45.6% of the global oilseed acreage. The usage of soybean oil as a biofuel has increased the demand for soybeans as an alternative to petrochemical raw materials. South America is the leading producer, which accounted for 47.9% of the global area under soybean cultivation in 2022 and observed a consistent increase of 10.8% from 2017 to 2022. Brazil is the leading soybean producer, accounting for 30.6% of the global soybean acreage in 2022. Argentina is also one of the major countries where the acreage fluctuated during the historic period owing to climatic conditions such as drought. Moreover, soybean is an input-intensive crop demanding higher amounts of water, agrochemicals, and soil.
- North America was the second-largest region, with a majority of the acreage under soybean being concentrated in the United States, which accounted for 26.7% of the global soybean acreage in 2022. The demand from China's oilseed industries is driving the region's soybean market. In Asia-Pacific, 22 million hectares of soybeans were cultivated in 2022, which accounted for 16.7% of the global acreage. India was the major country in the region, accounting for 56.2% of the region's soybean acreage in 2022. The annual increase in MSP prices, announcing stock limits to control prices, and demand from oil seed mills and crushers are estimated to drive the soybean acreage in the country faster compared to other countries.
- Therefore, industrial applications of soybeans and government initiatives for favorable market prices are estimated to drive the soybean acreage in major producing countries.

The higher demand for soybeans from various industries drives the demand for seeds with insect-resistant, herbicide-tolerant, and disease-resistant traits to boost the yield
- Soybeans are majorly cultivated in countries such as the United States, Brazil, and China due to favorable weather conditions. Traits such as disease resistance, drought tolerance, and high yielding and high oleic content have been gaining popularity due to changes in the climate and soil conditions with high demand for soybean from oil processing companies and preventing southern-stem canker, root-knot nematode (RKN), and Phytophthora sojae. For instance, Land O' Lakes has seed varieties under the brand Enlist and Roundup Ready to meet the growing demand for improved seed varieties. Furthermore, other major companies such as Corteva Agriscience, KWS SAAT SE & Co. KGaA, Land O’Lakes, Burrus Seeds, and Syngenta AG offer these seed traits.
- Disease-resistant traits are widely used by growers, and resistance to Diaporthe, Phytophthora, Sclerotinia, and other diseases are very popular and widely cultivated. As these diseases cause significant yield losses during field conditions, resistant varieties avoid the diseases and increase their productivity. For instance, PR91M10 by Corteva Agriscience and TMN Sinema by RAGT Group provide resistance to Diaporthe, Phytophthora, and Sclerotinia.
- Other traits, such as tolerance to drought, lodging, wider adaptability, early-medium maturity, tolerance to methyl herbicides, and tolerance to moisture stress, with high-yielding characteristics, are used globally. The introduction of new hybrid seed varieties by companies with higher resistance to viruses and high demand by processing industries are the factors expected to help in the growth of the soybean seed market during the forecast period.

OTHER KEY INDUSTRY TRENDS COVERED IN THE REPORT
- Transgenic breeding techniques dominated the market studied as they are approved in major soybean-growing countries in North America and South America
Segment Analysis: Breeding Technology
Hybrids Segment in Global Soybean Seed Market
The hybrids segment dominates the global soybean seed market, commanding approximately 87% market share in 2024. This substantial market presence is driven by the widespread adoption of both transgenic and non-transgenic hybrid soybean seed varieties. Transgenic hybrids, particularly those with herbicide-tolerant and insect-resistant traits, account for the majority of hybrid seed sales, especially in major soybean-producing regions like North and South America. The segment's dominance is attributed to several advantages offered by hybrid seeds, including higher yield potential, enhanced disease resistance, improved drought tolerance, and better adaptability to diverse climatic conditions. Additionally, the increasing demand for protein-rich animal feed and rising consumption of soybean-based products in food industries has further strengthened the position of hybrid seeds in the market. The segment is also experiencing robust growth, projected to expand at around 7% CAGR through 2029, driven by continuous innovation in breeding technologies and increasing adoption of GM varieties.
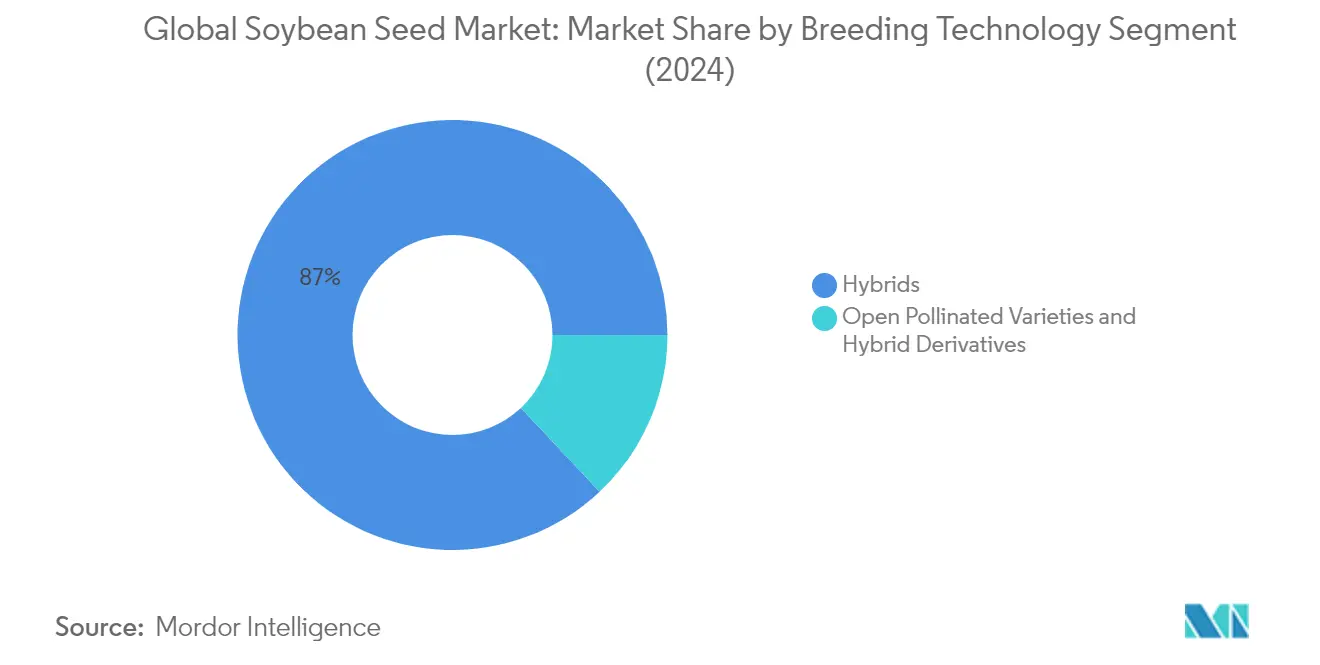
Open Pollinated Varieties & Hybrid Derivatives in Global Soybean Seed Market
The open-pollinated varieties (OPVs) and hybrid derivatives segment represents a smaller but significant portion of the global soybean seed market. This segment primarily caters to small-scale farmers and organic farming operations, where the focus is on cost-effectiveness and traditional farming practices. OPVs are particularly popular in regions where GM crops are not permitted or where farmers prefer non-GM alternatives. The segment's appeal lies in the lower input costs, as OPV seeds are typically 20% less expensive than hybrid varieties, making them an economically viable option for resource-constrained farmers. Additionally, these varieties often demonstrate stronger adaptation to local environmental conditions and require fewer external inputs, making them suitable for sustainable farming practices. The increasing interest in legume seed cultivation for sustainable agriculture further supports the growth of this segment within the broader agricultural seed industry.
Soybean Seed Market Geography Segment Analysis
Soybean Seed Market in Africa
The African soybean seed market demonstrates significant diversity across its key producing nations, with varying levels of adoption and cultivation practices. The region's market is primarily driven by countries like South Africa, Nigeria, and Ghana, where government initiatives and increasing demand for protein-rich crops have spurred growth. The market shows particular strength in regions with favorable climate conditions and established agricultural infrastructure, with different countries focusing on specific varieties suited to their local conditions.
Soybean Seed Market in South Africa
South Africa stands as the dominant force in Africa's soybean seed market, commanding approximately 56% of the regional market share. The country's success in soybean cultivation is attributed to its advanced agricultural practices, well-developed infrastructure, and strong support from agricultural institutions. South African farmers have shown particular success with hybrid seed varieties, demonstrating high adoption rates of modern agricultural technologies. The country's soybean production is concentrated in key agricultural regions where climate conditions and soil quality are optimal for soybean cultivation.
Soybean Seed Market in Ghana
Ghana emerges as the fastest-growing market in Africa's soybean seed sector, with a projected growth rate of approximately 9% during 2024-2029. The country's rapid growth is driven by increasing adoption of modern agronomic practices and the provision of high-yielding varieties to smallholder farmers. Ghana's success is particularly notable in its focus on sustainable farming practices and the integration of soybeans into various cropping systems. The government's support through training programs and access to improved seed varieties has been instrumental in driving this growth.
Soybean Seed Market in Asia-Pacific
The Asia-Pacific region represents a diverse and dynamic market for soybean seeds, characterized by varying levels of technological adoption and cultivation practices across different countries. The region encompasses major agricultural economies like China and India, alongside emerging markets such as the Philippines and Vietnam. The market is shaped by increasing demand for soybean-based products, a growing population, and rising adoption of modern farming techniques.
Soybean Seed Market in India
India maintains its position as the largest soybean seed market in the Asia-Pacific region, with approximately 25% of the regional market share in 2024. The country's dominance is supported by its extensive agricultural infrastructure and significant cultivation area. Indian farmers have shown an increasing preference for hybrid varieties, particularly in major soybean-growing states like Maharashtra and Madhya Pradesh. The country's success in soybean cultivation is further enhanced by government support and well-established distribution networks.
Soybean Seed Market in Philippines
The Philippines demonstrates remarkable growth potential in the soybean seed market, with an expected growth rate of approximately 7% during 2024-2029. The country's agricultural sector is undergoing significant transformation with an increasing focus on soybean cultivation. The growth is primarily driven by government initiatives aimed at improving farmers' income through the integration of soybeans into different cropping systems. The Philippines' success is particularly notable in its efforts to improve the supply chain of local soybeans and enhance the productivity of food-grade soybeans.
Soybean Seed Market in Europe
The European soybean seed market exhibits a complex landscape with varying levels of adoption across different regions. The market is characterized by a strong presence in Eastern European countries like Russia and Ukraine, alongside growing interest in Western European nations. The region's market dynamics are influenced by increasing demand for non-GMO soybeans and sustainable farming practices.
Soybean Seed Market in Russia
Russia maintains its position as the leading soybean seed market in Europe, with significant cultivation areas and established agricultural practices. The country's success in soybean cultivation is attributed to its vast agricultural lands and favorable growing conditions in key regions. Russian farmers have shown particular success with hybrid varieties, supported by strong agricultural infrastructure and government policies promoting domestic production.
Soybean Seed Market in Germany
Germany emerges as the fastest-growing market in Europe's soybean seed sector, demonstrating remarkable potential in sustainable soybean production. The country's growth is driven by increasing demand from the food processing sector and efforts to reduce dependency on imports. German agricultural practices focus on high-quality, non-GMO soybean varieties, supported by advanced farming techniques and strong research infrastructure.
Soybean Seed Market in Middle East
The Middle Eastern soybean seed market is primarily concentrated in Iran, which dominates the regional landscape. The market is characterized by growing demand for soybean-based products and increasing efforts to enhance domestic production. The region faces unique challenges related to climate conditions and water availability, leading to focused development of drought-resistant varieties. Iran leads both in market size and growth rate, with significant investments in agricultural infrastructure and seed technology development.
Soybean Seed Market in North America
The North American soybean seed market represents a highly developed and technologically advanced sector, with the United States leading the region's production and innovation. The market benefits from extensive research and development activities, advanced farming practices, and strong agricultural infrastructure. The United States dominates as the largest market, while Mexico shows the fastest growth potential. Canada maintains a significant presence with its focus on high-quality, non-GMO varieties for specific market segments.
Soybean Seed Market in South America
South America stands as a crucial player in the global soybean seed market, with Brazil and Argentina leading the regional production. The market benefits from favorable climate conditions, extensive agricultural lands, and advanced farming practices. Brazil emerges as both the largest and fastest-growing market in the region, supported by significant investments in research and development, particularly in GM varieties. Argentina maintains a strong position with its focus on export-oriented production and advanced seed technologies.
Soybean Seed Industry Overview
Top Companies in Soybean Seed Market
The global soybean seed market is led by established agricultural giants, including Bayer AG, Corteva Agriscience, Syngenta Group, KWS SAAT SE & Co. KGaA, and Advanta Seeds. These top soybean seed companies are heavily focused on product innovation through extensive R&D investments to develop new hybrid and transgenic varieties with enhanced traits like disease resistance, drought tolerance, and higher yields. Strategic partnerships and collaborations, particularly in the research and development of disease-resistant genes and new breeding technologies, have become increasingly common among major players. Companies are also expanding their geographical presence through regional subsidiaries and distribution networks while simultaneously strengthening their digital farming capabilities to provide comprehensive solutions to farmers. The industry demonstrates strong operational agility through continuous adaptation to changing climate conditions and evolving farmer needs across different regions.
Consolidated Market with Strong Regional Players
The soybean seed market exhibits a highly consolidated structure dominated by multinational agricultural conglomerates with extensive R&D capabilities and global distribution networks. These major players leverage their technological expertise and financial resources to maintain market leadership through continuous innovation in hybrid and transgenic seed development. The market also features regional specialists who have carved out strong positions in specific geographical areas by offering locally adapted varieties and maintaining close relationships with farming communities.
The industry has witnessed strategic consolidation through mergers and acquisitions, primarily driven by the need to acquire new technologies, expand geographical reach, and strengthen product portfolios. While global players continue to dominate the market, local soybean seed companies maintain significance in specific regions due to their understanding of local growing conditions and established farmer relationships. The market structure is further characterized by high entry barriers due to significant R&D requirements, regulatory compliance needs, and the importance of established distribution networks.
Innovation and Adaptation Drive Market Success
For incumbent companies to maintain and expand their market share, continuous investment in research and development of improved seed varieties remains crucial. Success factors include developing seeds with enhanced traits for specific regional conditions, building strong distribution networks, and providing comprehensive agronomic support to farmers. Companies must also focus on digital farming solutions and sustainable agriculture practices while maintaining strong relationships with research institutions and agricultural universities to access new technologies and breeding techniques.
New entrants and smaller players can gain ground by focusing on specialized market segments or specific geographical regions where they can build strong farmer relationships and offer tailored solutions. Success in the market increasingly depends on the ability to navigate complex regulatory environments, particularly regarding transgenic varieties, while meeting growing demand for sustainable and environmentally friendly farming solutions. Companies must also address the challenges of climate change through the development of resilient seed varieties while maintaining strong intellectual property protection for their innovations. Soybean seed producers play a crucial role in this dynamic landscape by offering innovative solutions tailored to the evolving needs of the agricultural sector.
Soybean Seed Market Leaders
-
Advanta Seeds - UPL
-
Bayer AG
-
Corteva Agriscience
-
KWS SAAT SE & Co. KGaA
-
Syngenta Group
- *Disclaimer: Major Players sorted in no particular order

Soybean Seed Market News
- June 2023: Syngenta Seeds launched a new conventional soybean brand, "Silverline," into the Canadian market. This brand offers high-protein soybeans and NK-treated soybean varieties.
- March 2023: Corteva Agriscience and Bunge collaborated to develop amino acid-enhanced soybeans. Through this collaboration, Corteva is leveraging its expertise in germplasm, gene editing, and the discovery of its traits to develop soybean varieties with high protein content, optimized amino acid profiles, and lower levels of anti-nutritional factors.
- March 2023: Pioneer Seeds, a subsidiary of Corteva Agriscience, launched 36 new soybean seed hybrid varieties with the Enlist E3 soybean trait. The varieties include defensive traits to fight soybean cyst nematode, sudden death syndrome, white mold, and Phytophthora.
Free With This Report
We provide a complimentary and exhaustive set of data points on regional and country-level metrics that present the fundamental structure of the industry. Presented in the form of 90+ free charts, the section covers difficult-to-find data from various regions regarding the area under cultivation for different crops within the scope


List of Tables & Figures
- Figure 1:
- AREA UNDER CULTIVATION OF SOYBEAN, HECTARE, GLOBAL, 2017-2022
- Figure 2:
- VALUE SHARE OF MAJOR SOYBEAN TRAITS, %, GLOBAL, 2022
- Figure 3:
- VALUE SHARE OF SOYBEAN BREEDING TECHNIQUES, %, GLOBAL, 2022
- Figure 4:
- VOLUME OF SOYBEAN SEED, METRIC TON, GLOBAL, 2017 - 2030
- Figure 5:
- VALUE OF SOYBEAN SEED, USD, GLOBAL, 2017 - 2030
- Figure 6:
- VOLUME OF SOYBEAN SEED BY BREEDING TECHNOLOGY CATEGORIES, METRIC TON, GLOBAL, 2017 - 2030
- Figure 7:
- VALUE OF SOYBEAN SEED BY BREEDING TECHNOLOGY CATEGORIES, USD, GLOBAL, 2017 - 2030
- Figure 8:
- VOLUME SHARE OF SOYBEAN SEED BY BREEDING TECHNOLOGY CATEGORIES, %, GLOBAL, 2017 VS 2023 VS 2030
- Figure 9:
- VALUE SHARE OF SOYBEAN SEED BY BREEDING TECHNOLOGY CATEGORIES, %, GLOBAL, 2017 VS 2023 VS 2030
- Figure 10:
- VOLUME OF SOYBEAN SEED BY HYBRIDS CATEGORIES, METRIC TON, GLOBAL, 2017 - 2030
- Figure 11:
- VALUE OF SOYBEAN SEED BY HYBRIDS CATEGORIES, USD, GLOBAL, 2017 - 2030
- Figure 12:
- VOLUME SHARE OF SOYBEAN SEED BY HYBRIDS CATEGORIES, %, GLOBAL, 2017 VS 2023 VS 2030
- Figure 13:
- VALUE SHARE OF SOYBEAN SEED BY HYBRIDS CATEGORIES, %, GLOBAL, 2017 VS 2023 VS 2030
- Figure 14:
- VOLUME OF NON-TRANSGENIC HYBRIDS SOYBEAN SEED, METRIC TON, GLOBAL, 2017 - 2030
- Figure 15:
- VALUE OF NON-TRANSGENIC HYBRIDS SOYBEAN SEED, USD, GLOBAL, 2017 - 2030
- Figure 16:
- VALUE SHARE OF NON-TRANSGENIC HYBRIDS SOYBEAN SEED BY COUNTRY, %, GLOBAL, 2023 AND 2030
- Figure 17:
- VOLUME OF SOYBEAN SEED BY TRANSGENIC HYBRIDS CATEGORIES, METRIC TON, GLOBAL, 2017 - 2030
- Figure 18:
- VALUE OF SOYBEAN SEED BY TRANSGENIC HYBRIDS CATEGORIES, USD, GLOBAL, 2017 - 2030
- Figure 19:
- VOLUME SHARE OF SOYBEAN SEED BY TRANSGENIC HYBRIDS CATEGORIES, %, GLOBAL, 2017 VS 2023 VS 2030
- Figure 20:
- VALUE SHARE OF SOYBEAN SEED BY TRANSGENIC HYBRIDS CATEGORIES, %, GLOBAL, 2017 VS 2023 VS 2030
- Figure 21:
- VOLUME OF HERBICIDE TOLERANT HYBRIDS SOYBEAN SEED, METRIC TON, GLOBAL, 2017 - 2030
- Figure 22:
- VALUE OF HERBICIDE TOLERANT HYBRIDS SOYBEAN SEED, USD, GLOBAL, 2017 - 2030
- Figure 23:
- VALUE SHARE OF HERBICIDE TOLERANT HYBRIDS SOYBEAN SEED BY COUNTRY, %, GLOBAL, 2023 AND 2030
- Figure 24:
- VOLUME OF INSECT RESISTANT HYBRIDS SOYBEAN SEED, METRIC TON, GLOBAL, 2017 - 2030
- Figure 25:
- VALUE OF INSECT RESISTANT HYBRIDS SOYBEAN SEED, USD, GLOBAL, 2017 - 2030
- Figure 26:
- VALUE SHARE OF INSECT RESISTANT HYBRIDS SOYBEAN SEED BY COUNTRY, %, GLOBAL, 2023 AND 2030
- Figure 27:
- VOLUME OF OTHER TRAITS SOYBEAN SEED, METRIC TON, GLOBAL, 2017 - 2030
- Figure 28:
- VALUE OF OTHER TRAITS SOYBEAN SEED, USD, GLOBAL, 2017 - 2030
- Figure 29:
- VALUE SHARE OF OTHER TRAITS SOYBEAN SEED BY COUNTRY, %, GLOBAL, 2023 AND 2030
- Figure 30:
- VOLUME OF OPEN POLLINATED VARIETIES & HYBRID DERIVATIVES SOYBEAN SEED, METRIC TON, GLOBAL, 2017 - 2030
- Figure 31:
- VALUE OF OPEN POLLINATED VARIETIES & HYBRID DERIVATIVES SOYBEAN SEED, USD, GLOBAL, 2017 - 2030
- Figure 32:
- VALUE SHARE OF OPEN POLLINATED VARIETIES & HYBRID DERIVATIVES SOYBEAN SEED BY COUNTRY, %, GLOBAL, 2023 AND 2030
- Figure 33:
- VOLUME OF SOYBEAN SEED BY REGION, METRIC TON, GLOBAL, 2017 - 2030
- Figure 34:
- VALUE OF SOYBEAN SEED BY REGION, USD, GLOBAL, 2017 - 2030
- Figure 35:
- VOLUME SHARE OF SOYBEAN SEED BY REGION, %, GLOBAL, 2017 VS 2023 VS 2030
- Figure 36:
- VALUE SHARE OF SOYBEAN SEED BY REGION, %, GLOBAL, 2017 VS 2023 VS 2030
- Figure 37:
- VOLUME OF SOYBEAN SEED BY BREEDING TECHNOLOGY CATEGORIES, METRIC TON, AFRICA, 2017 - 2030
- Figure 38:
- VALUE OF SOYBEAN SEED BY BREEDING TECHNOLOGY CATEGORIES, USD, AFRICA, 2017 - 2030
- Figure 39:
- VOLUME SHARE OF SOYBEAN SEED BY BREEDING TECHNOLOGY CATEGORIES, %, AFRICA, 2017 VS 2023 VS 2030
- Figure 40:
- VALUE SHARE OF SOYBEAN SEED BY BREEDING TECHNOLOGY CATEGORIES, %, AFRICA, 2017 VS 2023 VS 2030
- Figure 41:
- VOLUME OF SOYBEAN SEED BY COUNTRY, METRIC TON, AFRICA, 2017 - 2030
- Figure 42:
- VALUE OF SOYBEAN SEED BY COUNTRY, USD, AFRICA, 2017 - 2030
- Figure 43:
- VOLUME SHARE OF SOYBEAN SEED BY COUNTRY, %, AFRICA, 2017 VS 2023 VS 2030
- Figure 44:
- VALUE SHARE OF SOYBEAN SEED BY COUNTRY, %, AFRICA, 2017 VS 2023 VS 2030
- Figure 45:
- VOLUME OF EGYPT SOYBEAN SEED, METRIC TON, AFRICA, 2017 - 2030
- Figure 46:
- VALUE OF EGYPT SOYBEAN SEED, USD, AFRICA, 2017 - 2030
- Figure 47:
- VALUE SHARE OF EGYPT SOYBEAN SEED BY BREEDING TECHNOLOGY, %, AFRICA, 2023 AND 2030
- Figure 48:
- VOLUME OF ETHIOPIA SOYBEAN SEED, METRIC TON, AFRICA, 2017 - 2030
- Figure 49:
- VALUE OF ETHIOPIA SOYBEAN SEED, USD, AFRICA, 2017 - 2030
- Figure 50:
- VALUE SHARE OF ETHIOPIA SOYBEAN SEED BY BREEDING TECHNOLOGY, %, AFRICA, 2023 AND 2030
- Figure 51:
- VOLUME OF GHANA SOYBEAN SEED, METRIC TON, AFRICA, 2017 - 2030
- Figure 52:
- VALUE OF GHANA SOYBEAN SEED, USD, AFRICA, 2017 - 2030
- Figure 53:
- VALUE SHARE OF GHANA SOYBEAN SEED BY BREEDING TECHNOLOGY, %, AFRICA, 2023 AND 2030
- Figure 54:
- VOLUME OF KENYA SOYBEAN SEED, METRIC TON, AFRICA, 2017 - 2030
- Figure 55:
- VALUE OF KENYA SOYBEAN SEED, USD, AFRICA, 2017 - 2030
- Figure 56:
- VALUE SHARE OF KENYA SOYBEAN SEED BY BREEDING TECHNOLOGY, %, AFRICA, 2023 AND 2030
- Figure 57:
- VOLUME OF NIGERIA SOYBEAN SEED, METRIC TON, AFRICA, 2017 - 2030
- Figure 58:
- VALUE OF NIGERIA SOYBEAN SEED, USD, AFRICA, 2017 - 2030
- Figure 59:
- VALUE SHARE OF NIGERIA SOYBEAN SEED BY BREEDING TECHNOLOGY, %, AFRICA, 2023 AND 2030
- Figure 60:
- VOLUME OF SOUTH AFRICA SOYBEAN SEED, METRIC TON, AFRICA, 2017 - 2030
- Figure 61:
- VALUE OF SOUTH AFRICA SOYBEAN SEED, USD, AFRICA, 2017 - 2030
- Figure 62:
- VALUE SHARE OF SOUTH AFRICA SOYBEAN SEED BY BREEDING TECHNOLOGY, %, AFRICA, 2023 AND 2030
- Figure 63:
- VOLUME OF TANZANIA SOYBEAN SEED, METRIC TON, AFRICA, 2017 - 2030
- Figure 64:
- VALUE OF TANZANIA SOYBEAN SEED, USD, AFRICA, 2017 - 2030
- Figure 65:
- VALUE SHARE OF TANZANIA SOYBEAN SEED BY BREEDING TECHNOLOGY, %, AFRICA, 2023 AND 2030
- Figure 66:
- VOLUME OF REST OF AFRICA SOYBEAN SEED, METRIC TON, AFRICA, 2017 - 2030
- Figure 67:
- VALUE OF REST OF AFRICA SOYBEAN SEED, USD, AFRICA, 2017 - 2030
- Figure 68:
- VALUE SHARE OF REST OF AFRICA SOYBEAN SEED BY BREEDING TECHNOLOGY, %, AFRICA, 2023 AND 2030
- Figure 69:
- VOLUME OF SOYBEAN SEED BY BREEDING TECHNOLOGY CATEGORIES, METRIC TON, ASIA-PACIFIC, 2017 - 2030
- Figure 70:
- VALUE OF SOYBEAN SEED BY BREEDING TECHNOLOGY CATEGORIES, USD, ASIA-PACIFIC, 2017 - 2030
- Figure 71:
- VOLUME SHARE OF SOYBEAN SEED BY BREEDING TECHNOLOGY CATEGORIES, %, ASIA-PACIFIC, 2017 VS 2023 VS 2030
- Figure 72:
- VALUE SHARE OF SOYBEAN SEED BY BREEDING TECHNOLOGY CATEGORIES, %, ASIA-PACIFIC, 2017 VS 2023 VS 2030
- Figure 73:
- VOLUME OF SOYBEAN SEED BY COUNTRY, METRIC TON, ASIA-PACIFIC, 2017 - 2030
- Figure 74:
- VALUE OF SOYBEAN SEED BY COUNTRY, USD, ASIA-PACIFIC, 2017 - 2030
- Figure 75:
- VOLUME SHARE OF SOYBEAN SEED BY COUNTRY, %, ASIA-PACIFIC, 2017 VS 2023 VS 2030
- Figure 76:
- VALUE SHARE OF SOYBEAN SEED BY COUNTRY, %, ASIA-PACIFIC, 2017 VS 2023 VS 2030
- Figure 77:
- VOLUME OF AUSTRALIA SOYBEAN SEED, METRIC TON, ASIA-PACIFIC, 2017 - 2030
- Figure 78:
- VALUE OF AUSTRALIA SOYBEAN SEED, USD, ASIA-PACIFIC, 2017 - 2030
- Figure 79:
- VALUE SHARE OF AUSTRALIA SOYBEAN SEED BY BREEDING TECHNOLOGY, %, ASIA-PACIFIC, 2023 AND 2030
- Figure 80:
- VOLUME OF BANGLADESH SOYBEAN SEED, METRIC TON, ASIA-PACIFIC, 2017 - 2030
- Figure 81:
- VALUE OF BANGLADESH SOYBEAN SEED, USD, ASIA-PACIFIC, 2017 - 2030
- Figure 82:
- VALUE SHARE OF BANGLADESH SOYBEAN SEED BY BREEDING TECHNOLOGY, %, ASIA-PACIFIC, 2023 AND 2030
- Figure 83:
- VOLUME OF CHINA SOYBEAN SEED, METRIC TON, ASIA-PACIFIC, 2017 - 2030
- Figure 84:
- VALUE OF CHINA SOYBEAN SEED, USD, ASIA-PACIFIC, 2017 - 2030
- Figure 85:
- VALUE SHARE OF CHINA SOYBEAN SEED BY BREEDING TECHNOLOGY, %, ASIA-PACIFIC, 2023 AND 2030
- Figure 86:
- VOLUME OF INDIA SOYBEAN SEED, METRIC TON, ASIA-PACIFIC, 2017 - 2030
- Figure 87:
- VALUE OF INDIA SOYBEAN SEED, USD, ASIA-PACIFIC, 2017 - 2030
- Figure 88:
- VALUE SHARE OF INDIA SOYBEAN SEED BY BREEDING TECHNOLOGY, %, ASIA-PACIFIC, 2023 AND 2030
- Figure 89:
- VOLUME OF INDONESIA SOYBEAN SEED, METRIC TON, ASIA-PACIFIC, 2017 - 2030
- Figure 90:
- VALUE OF INDONESIA SOYBEAN SEED, USD, ASIA-PACIFIC, 2017 - 2030
- Figure 91:
- VALUE SHARE OF INDONESIA SOYBEAN SEED BY BREEDING TECHNOLOGY, %, ASIA-PACIFIC, 2023 AND 2030
- Figure 92:
- VOLUME OF JAPAN SOYBEAN SEED, METRIC TON, ASIA-PACIFIC, 2017 - 2030
- Figure 93:
- VALUE OF JAPAN SOYBEAN SEED, USD, ASIA-PACIFIC, 2017 - 2030
- Figure 94:
- VALUE SHARE OF JAPAN SOYBEAN SEED BY BREEDING TECHNOLOGY, %, ASIA-PACIFIC, 2023 AND 2030
- Figure 95:
- VOLUME OF MYANMAR SOYBEAN SEED, METRIC TON, ASIA-PACIFIC, 2017 - 2030
- Figure 96:
- VALUE OF MYANMAR SOYBEAN SEED, USD, ASIA-PACIFIC, 2017 - 2030
- Figure 97:
- VALUE SHARE OF MYANMAR SOYBEAN SEED BY BREEDING TECHNOLOGY, %, ASIA-PACIFIC, 2023 AND 2030
- Figure 98:
- VOLUME OF PHILIPPINES SOYBEAN SEED, METRIC TON, ASIA-PACIFIC, 2017 - 2030
- Figure 99:
- VALUE OF PHILIPPINES SOYBEAN SEED, USD, ASIA-PACIFIC, 2017 - 2030
- Figure 100:
- VALUE SHARE OF PHILIPPINES SOYBEAN SEED BY BREEDING TECHNOLOGY, %, ASIA-PACIFIC, 2023 AND 2030
- Figure 101:
- VOLUME OF THAILAND SOYBEAN SEED, METRIC TON, ASIA-PACIFIC, 2017 - 2030
- Figure 102:
- VALUE OF THAILAND SOYBEAN SEED, USD, ASIA-PACIFIC, 2017 - 2030
- Figure 103:
- VALUE SHARE OF THAILAND SOYBEAN SEED BY BREEDING TECHNOLOGY, %, ASIA-PACIFIC, 2023 AND 2030
- Figure 104:
- VOLUME OF VIETNAM SOYBEAN SEED, METRIC TON, ASIA-PACIFIC, 2017 - 2030
- Figure 105:
- VALUE OF VIETNAM SOYBEAN SEED, USD, ASIA-PACIFIC, 2017 - 2030
- Figure 106:
- VALUE SHARE OF VIETNAM SOYBEAN SEED BY BREEDING TECHNOLOGY, %, ASIA-PACIFIC, 2023 AND 2030
- Figure 107:
- VOLUME OF REST OF ASIA-PACIFIC SOYBEAN SEED, METRIC TON, ASIA-PACIFIC, 2017 - 2030
- Figure 108:
- VALUE OF REST OF ASIA-PACIFIC SOYBEAN SEED, USD, ASIA-PACIFIC, 2017 - 2030
- Figure 109:
- VALUE SHARE OF REST OF ASIA-PACIFIC SOYBEAN SEED BY BREEDING TECHNOLOGY, %, ASIA-PACIFIC, 2023 AND 2030
- Figure 110:
- VOLUME OF SOYBEAN SEED BY BREEDING TECHNOLOGY CATEGORIES, METRIC TON, EUROPE, 2017 - 2030
- Figure 111:
- VALUE OF SOYBEAN SEED BY BREEDING TECHNOLOGY CATEGORIES, USD, EUROPE, 2017 - 2030
- Figure 112:
- VOLUME SHARE OF SOYBEAN SEED BY BREEDING TECHNOLOGY CATEGORIES, %, EUROPE, 2017 VS 2023 VS 2030
- Figure 113:
- VALUE SHARE OF SOYBEAN SEED BY BREEDING TECHNOLOGY CATEGORIES, %, EUROPE, 2017 VS 2023 VS 2030
- Figure 114:
- VOLUME OF SOYBEAN SEED BY COUNTRY, METRIC TON, EUROPE, 2017 - 2030
- Figure 115:
- VALUE OF SOYBEAN SEED BY COUNTRY, USD, EUROPE, 2017 - 2030
- Figure 116:
- VOLUME SHARE OF SOYBEAN SEED BY COUNTRY, %, EUROPE, 2017 VS 2023 VS 2030
- Figure 117:
- VALUE SHARE OF SOYBEAN SEED BY COUNTRY, %, EUROPE, 2017 VS 2023 VS 2030
- Figure 118:
- VOLUME OF FRANCE SOYBEAN SEED, METRIC TON, EUROPE, 2017 - 2030
- Figure 119:
- VALUE OF FRANCE SOYBEAN SEED, USD, EUROPE, 2017 - 2030
- Figure 120:
- VALUE SHARE OF FRANCE SOYBEAN SEED BY BREEDING TECHNOLOGY, %, EUROPE, 2023 AND 2030
- Figure 121:
- VOLUME OF GERMANY SOYBEAN SEED, METRIC TON, EUROPE, 2017 - 2030
- Figure 122:
- VALUE OF GERMANY SOYBEAN SEED, USD, EUROPE, 2017 - 2030
- Figure 123:
- VALUE SHARE OF GERMANY SOYBEAN SEED BY BREEDING TECHNOLOGY, %, EUROPE, 2023 AND 2030
- Figure 124:
- VOLUME OF ITALY SOYBEAN SEED, METRIC TON, EUROPE, 2017 - 2030
- Figure 125:
- VALUE OF ITALY SOYBEAN SEED, USD, EUROPE, 2017 - 2030
- Figure 126:
- VALUE SHARE OF ITALY SOYBEAN SEED BY BREEDING TECHNOLOGY, %, EUROPE, 2023 AND 2030
- Figure 127:
- VOLUME OF NETHERLANDS SOYBEAN SEED, METRIC TON, EUROPE, 2017 - 2030
- Figure 128:
- VALUE OF NETHERLANDS SOYBEAN SEED, USD, EUROPE, 2017 - 2030
- Figure 129:
- VALUE SHARE OF NETHERLANDS SOYBEAN SEED BY BREEDING TECHNOLOGY, %, EUROPE, 2023 AND 2030
- Figure 130:
- VOLUME OF POLAND SOYBEAN SEED, METRIC TON, EUROPE, 2017 - 2030
- Figure 131:
- VALUE OF POLAND SOYBEAN SEED, USD, EUROPE, 2017 - 2030
- Figure 132:
- VALUE SHARE OF POLAND SOYBEAN SEED BY BREEDING TECHNOLOGY, %, EUROPE, 2023 AND 2030
- Figure 133:
- VOLUME OF ROMANIA SOYBEAN SEED, METRIC TON, EUROPE, 2017 - 2030
- Figure 134:
- VALUE OF ROMANIA SOYBEAN SEED, USD, EUROPE, 2017 - 2030
- Figure 135:
- VALUE SHARE OF ROMANIA SOYBEAN SEED BY BREEDING TECHNOLOGY, %, EUROPE, 2023 AND 2030
- Figure 136:
- VOLUME OF RUSSIA SOYBEAN SEED, METRIC TON, EUROPE, 2017 - 2030
- Figure 137:
- VALUE OF RUSSIA SOYBEAN SEED, USD, EUROPE, 2017 - 2030
- Figure 138:
- VALUE SHARE OF RUSSIA SOYBEAN SEED BY BREEDING TECHNOLOGY, %, EUROPE, 2023 AND 2030
- Figure 139:
- VOLUME OF SPAIN SOYBEAN SEED, METRIC TON, EUROPE, 2017 - 2030
- Figure 140:
- VALUE OF SPAIN SOYBEAN SEED, USD, EUROPE, 2017 - 2030
- Figure 141:
- VALUE SHARE OF SPAIN SOYBEAN SEED BY BREEDING TECHNOLOGY, %, EUROPE, 2023 AND 2030
- Figure 142:
- VOLUME OF TURKEY SOYBEAN SEED, METRIC TON, EUROPE, 2017 - 2030
- Figure 143:
- VALUE OF TURKEY SOYBEAN SEED, USD, EUROPE, 2017 - 2030
- Figure 144:
- VALUE SHARE OF TURKEY SOYBEAN SEED BY BREEDING TECHNOLOGY, %, EUROPE, 2023 AND 2030
- Figure 145:
- VOLUME OF UKRAINE SOYBEAN SEED, METRIC TON, EUROPE, 2017 - 2030
- Figure 146:
- VALUE OF UKRAINE SOYBEAN SEED, USD, EUROPE, 2017 - 2030
- Figure 147:
- VALUE SHARE OF UKRAINE SOYBEAN SEED BY BREEDING TECHNOLOGY, %, EUROPE, 2023 AND 2030
- Figure 148:
- VOLUME OF UNITED KINGDOM SOYBEAN SEED, METRIC TON, EUROPE, 2017 - 2030
- Figure 149:
- VALUE OF UNITED KINGDOM SOYBEAN SEED, USD, EUROPE, 2017 - 2030
- Figure 150:
- VALUE SHARE OF UNITED KINGDOM SOYBEAN SEED BY BREEDING TECHNOLOGY, %, EUROPE, 2023 AND 2030
- Figure 151:
- VOLUME OF REST OF EUROPE SOYBEAN SEED, METRIC TON, EUROPE, 2017 - 2030
- Figure 152:
- VALUE OF REST OF EUROPE SOYBEAN SEED, USD, EUROPE, 2017 - 2030
- Figure 153:
- VALUE SHARE OF REST OF EUROPE SOYBEAN SEED BY BREEDING TECHNOLOGY, %, EUROPE, 2023 AND 2030
- Figure 154:
- VOLUME OF SOYBEAN SEED BY BREEDING TECHNOLOGY CATEGORIES, METRIC TON, MIDDLE EAST, 2017 - 2030
- Figure 155:
- VALUE OF SOYBEAN SEED BY BREEDING TECHNOLOGY CATEGORIES, USD, MIDDLE EAST, 2017 - 2030
- Figure 156:
- VOLUME SHARE OF SOYBEAN SEED BY BREEDING TECHNOLOGY CATEGORIES, %, MIDDLE EAST, 2017 VS 2023 VS 2030
- Figure 157:
- VALUE SHARE OF SOYBEAN SEED BY BREEDING TECHNOLOGY CATEGORIES, %, MIDDLE EAST, 2017 VS 2023 VS 2030
- Figure 158:
- VOLUME OF SOYBEAN SEED BY COUNTRY, METRIC TON, MIDDLE EAST, 2017 - 2030
- Figure 159:
- VALUE OF SOYBEAN SEED BY COUNTRY, USD, MIDDLE EAST, 2017 - 2030
- Figure 160:
- VOLUME SHARE OF SOYBEAN SEED BY COUNTRY, %, MIDDLE EAST, 2017 VS 2023 VS 2030
- Figure 161:
- VALUE SHARE OF SOYBEAN SEED BY COUNTRY, %, MIDDLE EAST, 2017 VS 2023 VS 2030
- Figure 162:
- VOLUME OF IRAN SOYBEAN SEED, METRIC TON, MIDDLE EAST, 2017 - 2030
- Figure 163:
- VALUE OF IRAN SOYBEAN SEED, USD, MIDDLE EAST, 2017 - 2030
- Figure 164:
- VALUE SHARE OF IRAN SOYBEAN SEED BY BREEDING TECHNOLOGY, %, MIDDLE EAST, 2023 AND 2030
- Figure 165:
- VOLUME OF REST OF MIDDLE EAST SOYBEAN SEED, METRIC TON, MIDDLE EAST, 2017 - 2030
- Figure 166:
- VALUE OF REST OF MIDDLE EAST SOYBEAN SEED, USD, MIDDLE EAST, 2017 - 2030
- Figure 167:
- VALUE SHARE OF REST OF MIDDLE EAST SOYBEAN SEED BY BREEDING TECHNOLOGY, %, MIDDLE EAST, 2023 AND 2030
- Figure 168:
- VOLUME OF SOYBEAN SEED BY BREEDING TECHNOLOGY CATEGORIES, METRIC TON, NORTH AMERICA, 2017 - 2030
- Figure 169:
- VALUE OF SOYBEAN SEED BY BREEDING TECHNOLOGY CATEGORIES, USD, NORTH AMERICA, 2017 - 2030
- Figure 170:
- VOLUME SHARE OF SOYBEAN SEED BY BREEDING TECHNOLOGY CATEGORIES, %, NORTH AMERICA, 2017 VS 2023 VS 2030
- Figure 171:
- VALUE SHARE OF SOYBEAN SEED BY BREEDING TECHNOLOGY CATEGORIES, %, NORTH AMERICA, 2017 VS 2023 VS 2030
- Figure 172:
- VOLUME OF SOYBEAN SEED BY COUNTRY, METRIC TON, NORTH AMERICA, 2017 - 2030
- Figure 173:
- VALUE OF SOYBEAN SEED BY COUNTRY, USD, NORTH AMERICA, 2017 - 2030
- Figure 174:
- VOLUME SHARE OF SOYBEAN SEED BY COUNTRY, %, NORTH AMERICA, 2017 VS 2023 VS 2030
- Figure 175:
- VALUE SHARE OF SOYBEAN SEED BY COUNTRY, %, NORTH AMERICA, 2017 VS 2023 VS 2030
- Figure 176:
- VOLUME OF CANADA SOYBEAN SEED, METRIC TON, NORTH AMERICA, 2017 - 2030
- Figure 177:
- VALUE OF CANADA SOYBEAN SEED, USD, NORTH AMERICA, 2017 - 2030
- Figure 178:
- VALUE SHARE OF CANADA SOYBEAN SEED BY BREEDING TECHNOLOGY, %, NORTH AMERICA, 2023 AND 2030
- Figure 179:
- VOLUME OF MEXICO SOYBEAN SEED, METRIC TON, NORTH AMERICA, 2017 - 2030
- Figure 180:
- VALUE OF MEXICO SOYBEAN SEED, USD, NORTH AMERICA, 2017 - 2030
- Figure 181:
- VALUE SHARE OF MEXICO SOYBEAN SEED BY BREEDING TECHNOLOGY, %, NORTH AMERICA, 2023 AND 2030
- Figure 182:
- VOLUME OF UNITED STATES SOYBEAN SEED, METRIC TON, NORTH AMERICA, 2017 - 2030
- Figure 183:
- VALUE OF UNITED STATES SOYBEAN SEED, USD, NORTH AMERICA, 2017 - 2030
- Figure 184:
- VALUE SHARE OF UNITED STATES SOYBEAN SEED BY BREEDING TECHNOLOGY, %, NORTH AMERICA, 2023 AND 2030
- Figure 185:
- VOLUME OF REST OF NORTH AMERICA SOYBEAN SEED, METRIC TON, NORTH AMERICA, 2017 - 2030
- Figure 186:
- VALUE OF REST OF NORTH AMERICA SOYBEAN SEED, USD, NORTH AMERICA, 2017 - 2030
- Figure 187:
- VALUE SHARE OF REST OF NORTH AMERICA SOYBEAN SEED BY BREEDING TECHNOLOGY, %, NORTH AMERICA, 2023 AND 2030
- Figure 188:
- VOLUME OF SOYBEAN SEED BY BREEDING TECHNOLOGY CATEGORIES, METRIC TON, SOUTH AMERICA, 2017 - 2030
- Figure 189:
- VALUE OF SOYBEAN SEED BY BREEDING TECHNOLOGY CATEGORIES, USD, SOUTH AMERICA, 2017 - 2030
- Figure 190:
- VOLUME SHARE OF SOYBEAN SEED BY BREEDING TECHNOLOGY CATEGORIES, %, SOUTH AMERICA, 2017 VS 2023 VS 2030
- Figure 191:
- VALUE SHARE OF SOYBEAN SEED BY BREEDING TECHNOLOGY CATEGORIES, %, SOUTH AMERICA, 2017 VS 2023 VS 2030
- Figure 192:
- VOLUME OF SOYBEAN SEED BY COUNTRY, METRIC TON, SOUTH AMERICA, 2017 - 2030
- Figure 193:
- VALUE OF SOYBEAN SEED BY COUNTRY, USD, SOUTH AMERICA, 2017 - 2030
- Figure 194:
- VOLUME SHARE OF SOYBEAN SEED BY COUNTRY, %, SOUTH AMERICA, 2017 VS 2023 VS 2030
- Figure 195:
- VALUE SHARE OF SOYBEAN SEED BY COUNTRY, %, SOUTH AMERICA, 2017 VS 2023 VS 2030
- Figure 196:
- VOLUME OF ARGENTINA SOYBEAN SEED, METRIC TON, SOUTH AMERICA, 2017 - 2030
- Figure 197:
- VALUE OF ARGENTINA SOYBEAN SEED, USD, SOUTH AMERICA, 2017 - 2030
- Figure 198:
- VALUE SHARE OF ARGENTINA SOYBEAN SEED BY BREEDING TECHNOLOGY, %, SOUTH AMERICA, 2023 AND 2030
- Figure 199:
- VOLUME OF BRAZIL SOYBEAN SEED, METRIC TON, SOUTH AMERICA, 2017 - 2030
- Figure 200:
- VALUE OF BRAZIL SOYBEAN SEED, USD, SOUTH AMERICA, 2017 - 2030
- Figure 201:
- VALUE SHARE OF BRAZIL SOYBEAN SEED BY BREEDING TECHNOLOGY, %, SOUTH AMERICA, 2023 AND 2030
- Figure 202:
- VOLUME OF REST OF SOUTH AMERICA SOYBEAN SEED, METRIC TON, SOUTH AMERICA, 2017 - 2030
- Figure 203:
- VALUE OF REST OF SOUTH AMERICA SOYBEAN SEED, USD, SOUTH AMERICA, 2017 - 2030
- Figure 204:
- VALUE SHARE OF REST OF SOUTH AMERICA SOYBEAN SEED BY BREEDING TECHNOLOGY, %, SOUTH AMERICA, 2023 AND 2030
- Figure 205:
- MOST ACTIVE COMPANIES BY NUMBER OF STRATEGIC MOVES, COUNT, GLOBAL, 2017-2023
- Figure 206:
- MOST ADOPTED STRATEGIES, COUNT, GLOBAL, 2017-2023
- Figure 207:
- VALUE SHARE OF MAJOR PLAYERS, %, GLOBAL
Soybean Seed Industry Segmentation
Hybrids, Open Pollinated Varieties & Hybrid Derivatives are covered as segments by Breeding Technology. Africa, Asia-Pacific, Europe, Middle East, North America, South America are covered as segments by Region.| Breeding Technology | Hybrids | Non-Transgenic Hybrids | ||
| Transgenic Hybrids | Herbicide Tolerant Hybrids | |||
| Insect Resistant Hybrids | ||||
| Other Traits | ||||
| Open Pollinated Varieties & Hybrid Derivatives | ||||
| Region | Africa | By Breeding Technology | ||
| By Country | Egypt | |||
| Ethiopia | ||||
| Ghana | ||||
| Kenya | ||||
| Nigeria | ||||
| South Africa | ||||
| Tanzania | ||||
| Rest of Africa | ||||
| Asia-Pacific | By Breeding Technology | |||
| Australia | ||||
| Bangladesh | ||||
| China | ||||
| India | ||||
| Indonesia | ||||
| Japan | ||||
| Myanmar | ||||
| Philippines | ||||
| Thailand | ||||
| Vietnam | ||||
| Rest of Asia-Pacific | ||||
| Europe | By Breeding Technology | |||
| France | ||||
| Germany | ||||
| Italy | ||||
| Netherlands | ||||
| Poland | ||||
| Romania | ||||
| Russia | ||||
| Spain | ||||
| Turkey | ||||
| Ukraine | ||||
| United Kingdom | ||||
| Rest of Europe | ||||
| Middle East | By Breeding Technology | |||
| Iran | ||||
| Rest of Middle East | ||||
| North America | By Breeding Technology | |||
| Canada | ||||
| Mexico | ||||
| United States | ||||
| Rest of North America | ||||
| South America | By Breeding Technology | |||
| Argentina | ||||
| Brazil | ||||
| Rest of South America | ||||
| Hybrids | Non-Transgenic Hybrids | ||
| Transgenic Hybrids | Herbicide Tolerant Hybrids | ||
| Insect Resistant Hybrids | |||
| Other Traits | |||
| Open Pollinated Varieties & Hybrid Derivatives | |||
| Africa | By Breeding Technology | ||
| By Country | Egypt | ||
| Ethiopia | |||
| Ghana | |||
| Kenya | |||
| Nigeria | |||
| South Africa | |||
| Tanzania | |||
| Rest of Africa | |||
| Asia-Pacific | By Breeding Technology | ||
| Australia | |||
| Bangladesh | |||
| China | |||
| India | |||
| Indonesia | |||
| Japan | |||
| Myanmar | |||
| Philippines | |||
| Thailand | |||
| Vietnam | |||
| Rest of Asia-Pacific | |||
| Europe | By Breeding Technology | ||
| France | |||
| Germany | |||
| Italy | |||
| Netherlands | |||
| Poland | |||
| Romania | |||
| Russia | |||
| Spain | |||
| Turkey | |||
| Ukraine | |||
| United Kingdom | |||
| Rest of Europe | |||
| Middle East | By Breeding Technology | ||
| Iran | |||
| Rest of Middle East | |||
| North America | By Breeding Technology | ||
| Canada | |||
| Mexico | |||
| United States | |||
| Rest of North America | |||
| South America | By Breeding Technology | ||
| Argentina | |||
| Brazil | |||
| Rest of South America | |||
Market Definition
- Commercial Seed - For the purpose of this study, only commercial seeds have been included as part of the scope. Farm-saved Seeds, which are not commercially labeled are excluded from scope, even though a minor percentage of farm-saved seeds are exchanged commercially among farmers. The scope also excludes vegetatively reproduced crops and plant parts, which may be commercially sold in the market.
- Crop Acreage - While calculating the acreage under different crops, the Gross Cropped Area has been considered. Also known as Area Harvested, according to the Food & Agricultural Organization (FAO), this includes the total area cultivated under a particular crop across seasons.
- Seed Replacement Rate - Seed Replacement Rate is the percentage of area sown out of the total area of crop planted in the season by using certified/quality seeds other than the farm-saved seed.
- Protected Cultivation - The report defines protected cultivation as the process of growing crops in a controlled environment. This includes greenhouses, glasshouses, hydroponics, aeroponics, or any other cultivation system that protects the crop against any abiotic stress. However, cultivation in an open field using plastic mulch is excluded from this definition and is included under open field.
| Keyword | Definition |
|---|---|
| Row Crops | These are usually the field crops which include the different crop categories like grains & cereals, oilseeds, fiber crops like cotton, pulses, and forage crops. |
| Solanaceae | These are the family of flowering plants which includes tomato, chili, eggplants, and other crops. |
| Cucurbits | It represents a gourd family consisting of about 965 species in around 95 genera. The major crops considered for this study include Cucumber & Gherkin, Pumpkin and squash, and other crops. |
| Brassicas | It is a genus of plants in the cabbage and mustard family. It includes crops such as carrots, cabbage, cauliflower & broccoli. |
| Roots & Bulbs | The roots and bulbs segment includes onion, garlic, potato, and other crops. |
| Unclassified Vegetables | This segment in the report includes the crops which don’t belong to any of the above-mentioned categories. These include crops such as okra, asparagus, lettuce, peas, spinach, and others. |
| Hybrid Seed | It is the first generation of the seed produced by controlling cross-pollination and by combining two or more varieties, or species. |
| Transgenic Seed | It is a seed that is genetically modified to contain certain desirable input and/or output traits. |
| Non-Transgenic Seed | The seed produced through cross-pollination without any genetic modification. |
| Open-Pollinated Varieties & Hybrid Derivatives | Open-pollinated varieties produce seeds true to type as they cross-pollinate only with other plants of the same variety. |
| Other Solanaceae | The crops considered under other Solanaceae include bell peppers and other different peppers based on the locality of the respective countries. |
| Other Brassicaceae | The crops considered under other brassicas include radishes, turnips, Brussels sprouts, and kale. |
| Other Roots & Bulbs | The crops considered under other roots & bulbs include Sweet Potatoes and cassava. |
| Other Cucurbits | The crops considered under other cucurbits include gourds (bottle gourd, bitter gourd, ridge gourd, Snake gourd, and others). |
| Other Grains & Cereals | The crops considered under other grains & cereals include Barley, Buck Wheat, Canary Seed, Triticale, Oats, Millets, and Rye. |
| Other Fibre Crops | The crops considered under other fibers include Hemp, Jute, Agave fibers, Flax, Kenaf, Ramie, Abaca, Sisal, and Kapok. |
| Other Oilseeds | The crops considered under other oilseeds include Ground nut, Hempseed, Mustard seed, Castor seeds, safflower seeds, Sesame seeds, and Linseeds. |
| Other Forage Crops | The crops considered under other forages include Napier grass, Oat grass, White clover, Ryegrass, and Timothy. Other forage crops were considered based on the locality of the respective countries. |
| Pulses | Pigeon peas, Lentils, Broad and horse beans, Vetches, Chickpeas, Cowpeas, Lupins, and Bambara beans are the crops considered under pulses. |
| Other Unclassified Vegetables | The crops considered under other unclassified vegetables include Artichokes, Cassava Leaves, Leeks, Chicory, and String beans. |
Research Methodology
Mordor Intelligence follows a four-step methodology in all our reports.
- Step-1: IDENTIFY KEY VARIABLES: In order to build a robust forecasting methodology, the variables and factors identified in Step-1 are tested against available historical market numbers. Through an iterative process, the variables required for market forecast are set and the model is built on the basis of these variables.
- Step-2: Build a Market Model: Market-size estimations for the forecast years are in nominal terms. Inflation is not a part of the pricing, and the average selling price (ASP) is kept constant throughout the forecast period.
- Step-3: Validate and Finalize: In this important step, all market numbers, variables and analyst calls are validated through an extensive network of primary research experts from the market studied. The respondents are selected across levels and functions to generate a holistic picture of the market studied.
- Step-4: Research Outputs: Syndicated Reports, Custom Consulting Assignments, Databases, and Subscription Platforms


