
Solvents Market Size and Share
Market Overview
| Study Period | 2021 - 2031 |
|---|---|
| Market Size (2026) | USD 35.16 Billion |
| Market Size (2031) | USD 44.30 Billion |
| Growth Rate (2026 - 2031) | 4.73 % |
| Fastest Growing Market | Asia Pacific |
| Largest Market | Asia Pacific |
| Market Concentration | Medium |
Major Players *Disclaimer: Major Players sorted in no particular order Image © Mordor Intelligence. Reuse requires attribution under CC BY 4.0. | |
Solvents Market Analysis by Mordor Intelligence
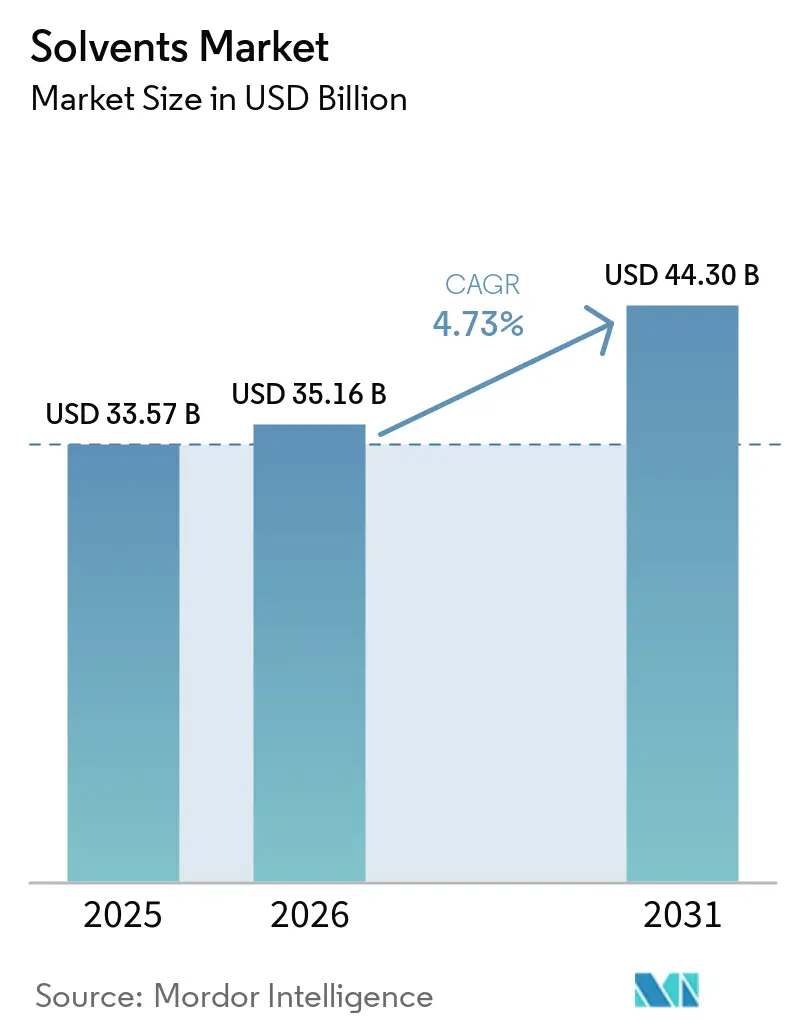
The Solvents Market size was valued at USD 33.57 billion in 2025 and is estimated to grow from USD 35.16 billion in 2026 to reach USD 44.30 billion by 2031, at a CAGR of 4.73% during the forecast period (2026-2031). Petrochemical-based grades still dominate volume, yet the combination of bio-feedstock innovation, closed-loop recovery investments, and tightening volatile organic compound (VOC) limits is reshaping growth patterns within the solvents market. Rising pharmaceutical outsourcing in Asia-Pacific, infrastructure spending that lifts architectural coatings demand, and brand-owner sustainability commitments are broadening opportunities for high-purity oxygenated grades while eroding prospects for high-aromatic blends. Suppliers with integrated feedstock positions, AI-enabled recovery systems, and credible bio-routes are capturing early margin upside, whereas mid-tier producers dependent on spot crude or imported naphtha face widening cost swings. Competitive positioning, therefore, hinges on the agility to serve both legacy commodity volumes and emerging specialty niches, especially as solvent-based polymer recycling moves from pilot scale toward commercial deployment.
Key Report Takeaways
- In 2025, petrochemical-based solvents accounted for 84.23% of the market share, reflecting their dominance in the solvents market. Meanwhile, bio-based grades are projected to exhibit the highest growth, with an anticipated CAGR of 8.13% during the forecast period (2026-2031).
- Oxygenated solvents emerged as the leading type in 2025, representing 65.78% of the market size. This segment is expected to maintain steady growth, with a forecasted CAGR of 4.97% through 2031.
- The paints and coatings application segment generated the highest revenue in 2025, contributing 49.22% to the market. However, the pharmaceuticals segment is poised for the fastest growth, with a projected CAGR of 5.04% during the forecast period.
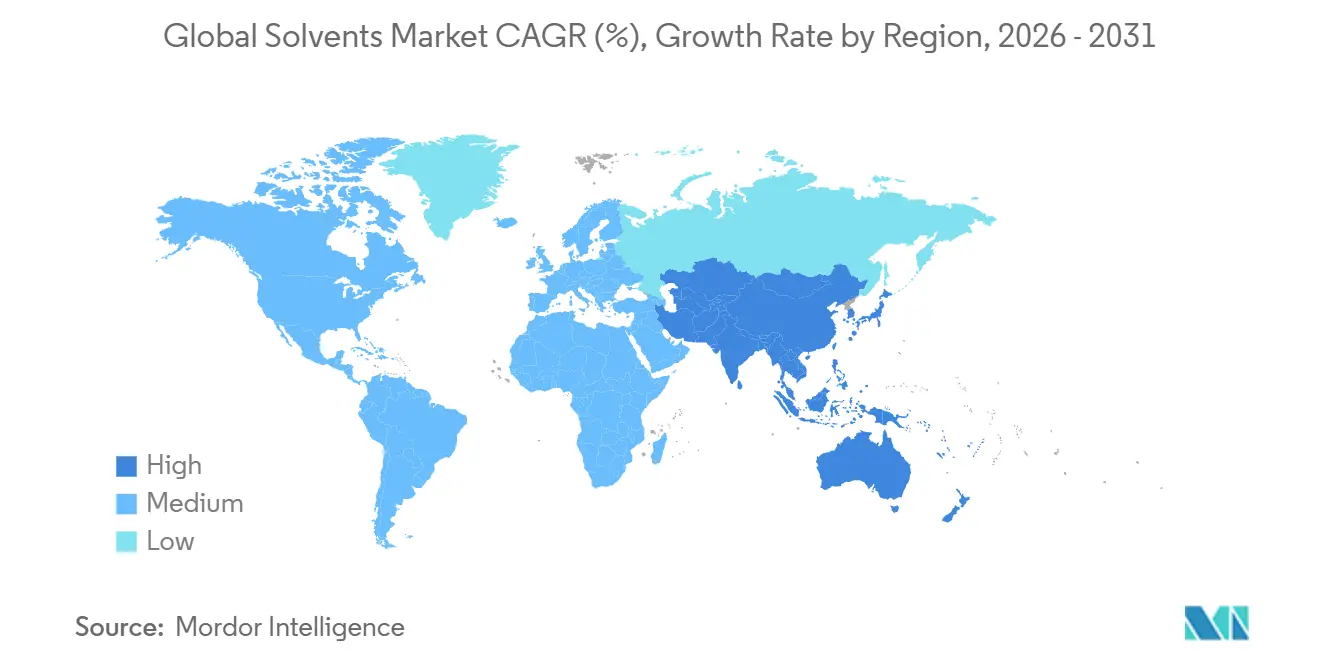
- Asia-Pacific led the geographical landscape in 2025, capturing 42.35% of the market share. The region is anticipated to sustain robust growth, with a forecasted CAGR of 5.21% through 2031.
Note: Market size and forecast figures in this report are generated using Mordor Intelligence’s proprietary estimation framework, updated with the latest available data and insights as of January 2026.
Market Trends and Insights
Drivers Impact Analysis of Solvents Market*
| Drivers | (~) % Impact on CAGR Forecast | Geographic Relevance | Impact Timeline |
|---|---|---|---|
| Surging demand from paints and coatings | +1.2% | Global, with concentration in Asia-Pacific and North America | Medium term (2-4 years) |
| Accelerating pharmaceutical manufacturing in emerging Asia-Pacific clusters | +0.9% | Asia-Pacific core (India, China, Vietnam), spill-over to Middle East and North Africa | Long term (≥ 4 years) |
| Tightening VOC caps in North America and EU encouraging solvent substitution | +0.8% | North America and EU, early adoption in California and Nordic countries | Short term (≤ 2 years) |
| Rapid scale-up of solvent-based polymer recycling technologies | +0.6% | EU and North America, pilot deployments in Japan and South Korea | Medium term (2-4 years) |
| AI-driven, closed-loop solvent-recovery systems cutting opex for end-users | +0.4% | Global, with early gains in pharmaceutical and specialty-chemical facilities | Long term (≥ 4 years) |
| Source: Mordor Intelligence | |||
Surging Demand From Paints And Coatings
Architectural and industrial coatings absorbed nearly half of global solvent output in 2025, and regulatory ceilings on VOC content are accelerating reformulation toward acetone, methyl ethyl ketone, and acetate esters. The U.S. National Emission Standards for aerosol coatings that became effective in 2024 limit VOC to 45% by weight, prompting formulators to displace hydrocarbon blends with low-VOC oxygenates. China extended its low-VOC coatings mandate in 2025 to refinishing and furniture lines, triggering a double-digit jump in demand for compliant glycol ethers. Simultaneously, Middle Eastern pipeline refurbishment budgets exceeding USD 120 billion through 2030 are sustaining epoxy and polyurethane coatings that rely on high-solvency oxygenated carriers. Commodity hydrocarbon suppliers, therefore, face margin pressure, while specialty oxygenated producers command 10%–15% price premiums in compliant formulations.
Accelerating Pharmaceutical Manufacturing In Emerging Asia-Pacific Clusters
India and China produced 38% of global active pharmaceutical ingredients in 2025, lifted by Production-Linked Incentives worth USD 2 billion and a surge of export-oriented manufacturing parks[1]. Hainan’s Free Trade Port alone attracted USD 8 billion of pharma capital expenditure in 2024-2025, adding solvent demand surpassing 120,000 metric tons per year. Vietnam’s ten-year tax holidays for greenfield API plants are set to pull in USD 1.5 billion of exports by 2030, further lifting regional uptake of high-purity ethanol, isopropanol, and tetrahydrofuran. Although these markets apply lighter environmental oversight, planned International Council for Harmonisation (ICH) residual-solvent updates will tighten purity targets for pharmaceutical solvents, favoring suppliers with robust quality systems and validated recovery loops.
Tightening VOC Caps In North America And EU Encouraging Solvent Substitution
The EU Industrial Emissions Directive lowered solvent emission thresholds for coating and printing by up to 30% in 2024, forcing manufacturers to pivot toward exempt acetone or to install costly abatement equipment. California’s amended Rule 1113 caps interior flat paints at 10 g/L VOC as of 2025, effectively shifting the local coatings chain to waterborne or zero-VOC formulas. Large multinationals can absorb reformulation costs within 24 months, yet smaller firms confront USD 0.5-2 million capital outlays, spurring consolidation. Oxygenated and bio-based suppliers are consequently signing multi-year technical-service agreements to guide mid-tier formulators through compliance, embedding themselves more deeply into customer workflows.
Rapid Scale-Up Of Solvent-Based Polymer Recycling Technologies
Solvent-mediated dissolution of mixed plastics is moving from pilot to commercial status. ExxonMobil’s Exxtend processed 40,000 metric tons of waste in 2025 and targets 500,000 metric tons annually by 2027[2]. Fraunhofer’s 95% solvent-reuse loop for polystyrene achieved virgin-grade properties, easing concerns over quality drift. The EU Packaging and Packaging Waste Regulation now mandates 65% recycled content in PET bottles by 2030, creating a regulatory pull for advanced recycling volumes that could absorb 200,000 metric tons of solvents by 2031. Supply chains are therefore examining toluene- and xylene-based dissolution recipes as strategic hedges against virgin-resin price volatility.
Restraints Impact Analysis of Solvents Market*
| Restraints | (~) % Impact on CAGR Forecast | Geographic Relevance | Impact Timeline |
|---|---|---|---|
| Feedstock volatility and margin pressure for petro-solvents | -0.7% | Global, acute in regions dependent on imported crude (Europe, Asia-Pacific net importers) | Short term (≤ 2 years) |
| High cost-of-ownership for bio-solvent formulations in high-spec inks | -0.5% | North America and EU, limited impact in Asia-Pacific | Medium term (2-4 years) |
| Growing OEM bans on aromatic solvents in automotive interiors post-2027 | -0.3% | Global, with early enforcement in EU and California | Medium term (2-4 years) |
| Source: Mordor Intelligence | |||
Feedstock Volatility And Margin Pressure For Petro-Solvents
Brent crude oscillated between USD 70 and USD 85 per barrel during 2024-2025, translating each USD 10 move into a 100- to 150-basis-point swing in integrated solvent margins. European operators endured an additional spike in natural-gas feedstock to EUR 45 per megawatt-hour after Norwegian outages in January 2025, triggering unplanned cracker shutdowns and curtailing naphtha-sourced solvent output. Smaller standalone units, lacking hedging programs or refinery integration, recorded revenue declines of 5%–8% and accelerated asset divestitures. Although bio-routes offer partial insulation, volatility in corn and sugar prices introduces parallel risk profiles, and scale disadvantages keep cash costs higher than large cracker complexes.
High Cost-Of-Ownership For Bio-Solvent Formulations In High-Spec Inks
Bio-alcohols and esters sourced from corn or sugarcane still carry 20%–40% price premiums versus petrochemical equivalents, a gap that narrows materially only when Brent exceeds USD 90 per barrel. Food-contact ink applications require residual-impurity levels below 10 ppm, often mandating double distillation and activated-carbon polishing steps that add USD 100–200 per metric ton. Despite EPA Safer Choice and carbon-credit incentives, uptake in North American converters remains below 5% because brand owners resist passing on incremental costs without visible sustainability labeling. Until bio-refineries approach 200,000-plus metric-ton scale, economics will restrict adoption to niches where performance or regulatory mandates justify price differentials.
*Our forecasts treat driver/restraint impacts as directional, not additive. The impact forecasts reflect baseline growth, mix effects, and variable interactions.
Solvents Market Segment Analysis
By Source:
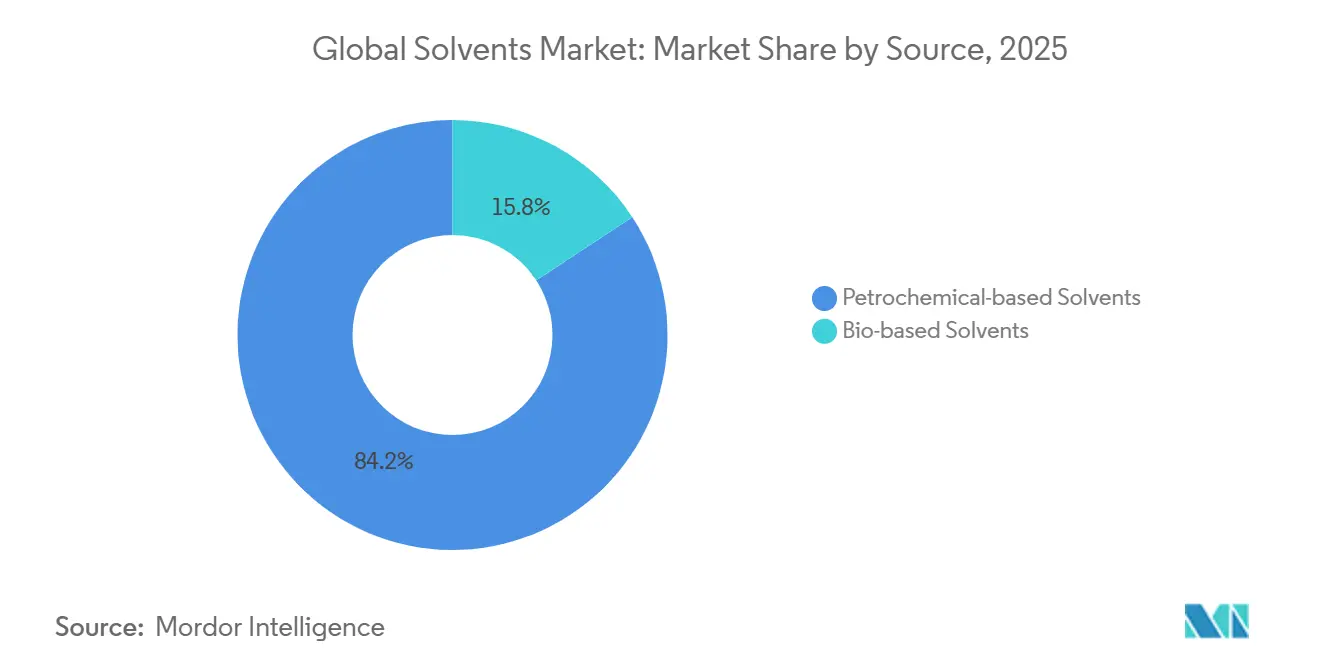
Bio-Based Gains Outpace Petrochemical IncumbentsPetrochemical grades retained 84.23% solvents market share in 2025, yet bio-based alternatives are advancing at an 8.13% CAGR that nearly doubles overall solvents market growth. The solvents market size attributable to bio routes is projected to surpass USD 8 billion by 2031 as EU carbon-intensity scoring and California’s low-carbon mandates translate into tradable credits. Cargill expanded bio-ethanol output by 50,000 metric tons in 2025 to supply pharmaceutical syntheses with carbon-label claims. Groupe Berkem’s lignin-derived stripper landed ISO 14001 certification and is displacing N-methyl-2-pyrrolidone in European cleaning lines.
In price-sensitive adhesives and metal cleaning, petrochemical solvents still dominate on cost grounds. Shell and ExxonMobil now co-process certified bio-naphtha within crackers, producing mass-balance solvents that carry renewable labels without dedicated units—a tactic that shields share while facing scrutiny from NGOs over chain-of-custody credibility. As regulatory intensity rises, the solvents market is likely to bifurcate further: bio-based or mass-balance streams serve regulated regions, while Asia-Pacific growth keeps petrochemical demand buoyant.

By Type:
Oxygenated Solvents Dominate Across Pharmaceutical And Coatings ApplicationsOxygenated solvents grades captured 65.78% of the solvents market size in 2025 and are predicted to expand at a 4.97% CAGR, underpinned by polarity, low odor, and multiple exemptions from VOC caps. Alcohols such as ethanol and isopropanol lead sub-segments, fueled by a surge in sanitizers and API crystallization. Glycol ethers are rising quickly as formulators chase sub-50 g/L VOC targets in architectural paints, supported by 80,000 metric tons of fresh capacity commissioned by Dow and Eastman in 2024-2025.
Hydrocarbon solvents held a considerable share in 2025 but are plateauing as OEM cabin-air standards retire aromatics. Halogenated niches are sliding by roughly 1% per year as REACH restrictions tighten. Eastman 168, launched in 2025, offers a non-halogenated drop-in with 90% lower global-warming potential, signaling momentum toward safer substitutes.
By Application:
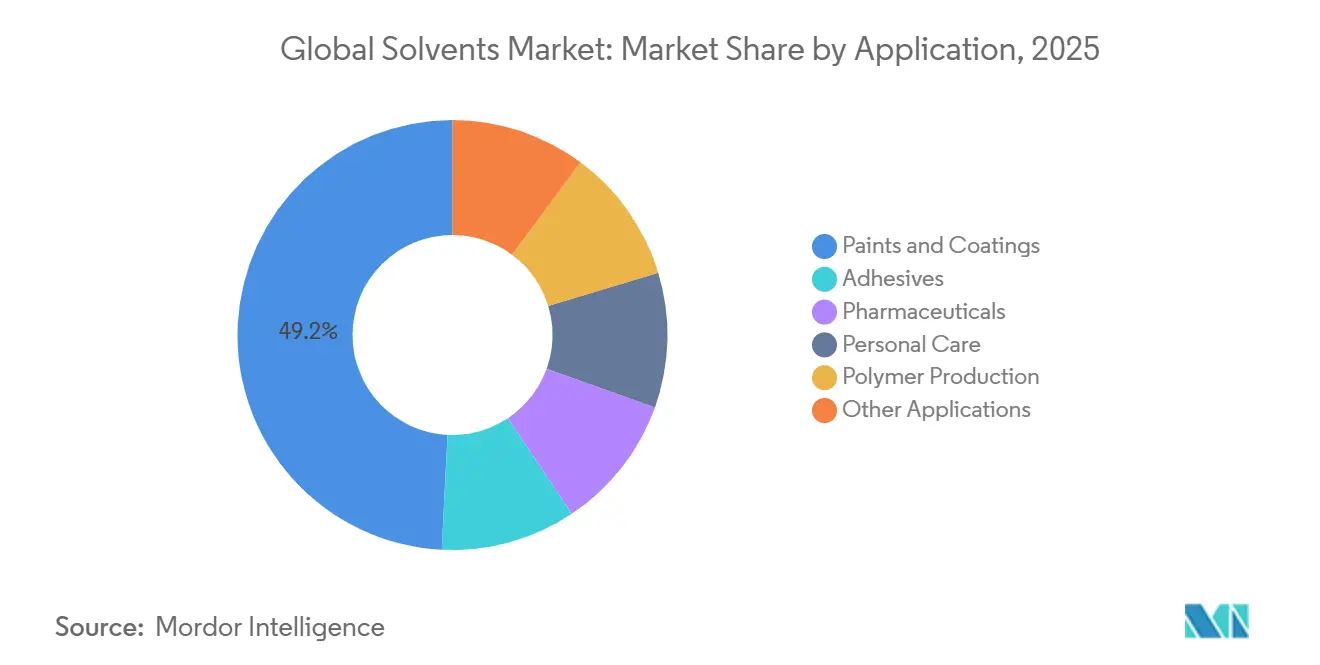
Pharmaceuticals Outpace Paints As API Production Shifts EastPaints and coatings consumed 49.22% of solvent volume in 2025, yet pharmaceutical demand is growing faster at 5.04% annually through 2031 as contract manufacturing organizations scale up in India, China, and Vietnam. A single 1,000-kilogram API batch can employ up to 10,000 liters of high-purity oxygenated solvent, and India alone added 3.2 million metric tons of API output in 2025, translating to an extra 50,000 metric tons of solvent demand.
Adhesives hold a considerable market share but migrate steadily toward hot-melt and waterborne chemistries, capping growth. Personal-care products are witnessing rising demand driven by rising disposable income in emerging regions. Polymer production demand is driven by toluene and xylene in synthetic rubber, while printing inks and ag-chemicals face distinct regulatory and digital-conversion headwinds.
Geography Analysis
APAC Solvents Market
Asia-Pacific generated 42.35% of the solvents market share in 2025 and is forecast to expand at a 5.21% CAGR through 2031. India secured USD 4.5 billion of foreign direct investment into pharma hubs between 2024-2025, boosting solvent uptake by 90,000 metric tons annually. China’s coatings output rose 6% in 2025 as residential construction in tier-2 cities resumed, prompting domestic giants to add 120,000 metric tons of solvent capacity. Vietnam’s tax incentives could lift regional demand by another 20,000 metric tons by 2031.
North America Solvents Market
In North America, VOC regulations redirect consumption from hydrocarbon blends toward oxygenated and bio-based streams. The U.S. EPA tightened vapor-recovery rules for chemical storage tanks in 2024, compelling a USD 300-500 million spend on compliance that favors exempt acetone and methyl acetate as reformulation solvents. Mexico’s 3.8 million vehicle output in 2025 sustains 5% growth in OEM coatings consumption, even as aromatic bans loom post-2027.
EMEA and South America Solvents Market
Europe's solvent demand is led by Germany’s EUR 1.2 billion solvent-recovery upgrades that cut virgin demand by up to 40%. France commissioned a 30,000-metric-ton bio-propanol plant in 2025 to serve low-VOC coatings lines. South America and the Middle East and Africa are witnessing rising demand, with Brazil’s herbicide formulations and Gulf ethane-advantaged solvent exports filling regional niches.
Value Chain Analysis
The solvents value chain begins with petrochemical and bio-feedstock sourcing, then moves through conversion to base solvents and purification before reaching bulk storage, distribution, and end-use formulation. On the petro side, crude-to-naphtha and natural-gas-linked olefins and aromatics streams feed oxygenated (alcohols, ketones, acetates, glycol ethers) and hydrocarbon solvents. On the bio side, sugar and starch fermentation plus downstream esterification and hydrogenation routes supply bio-alcohols and bio-esters, with mass-balance bio-naphtha co-processing also used by integrated players. Typical manufacturing assets include refineries and steam crackers upstream, dedicated solvent units and distillation trains midstream, and on-site recovery and abatement systems at large end-users in coatings, pharma, and electronics.
Midstream logistics and compliance increasingly drive delivered cost and availability. Shipping disruptions around the Red Sea and Suez Canal since late 2023, along with port labor disruptions in North America in 2024, exposed dependence on ocean freight, tank-container availability, and terminal throughput. As a result, buyers have leaned toward local sourcing and larger safety stocks for commodity grades. On the supply side, structural rationalization in Europe, including Dow confirming closures of major German upstream assets in 2025, tightens availability of certain chlorinated and ethylene-derivative solvent chains and increases reliance on imports from advantaged regions. In Asia, new large-scale units, including Qixiang Tengda scaling methyl ethyl ketone capacity to 260,000 tonnes/year in 2026, reinforce China as a swing supplier for oxygenated solvents. Distributors and traders continue to bridge the gap between bulk producers and fragmented downstream users that require consistent specifications, packaging formats (bulk, IBC, drums), and documentation for regulated applications such as pharmaceuticals.
Competitive Landscape
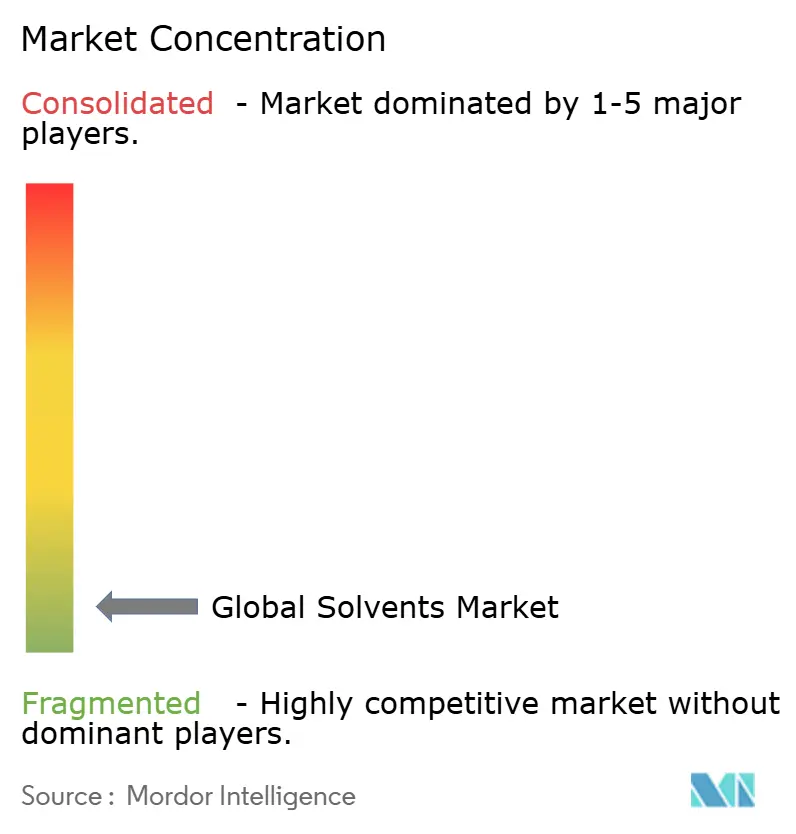
The global solvents market is moderately fragmented, where the top five players account for a considerable market share. BASF’s 2024 patent couples membrane separation with distillation to achieve 98% solvent reuse, offering a 40% energy cut and positioning the firm as a turnkey recovery partner. Dow and Eastman are co-developing bio-glycol ethers with farm-cooperative feedstock streams, seeking 10%–15% price premiums where renewable labeling carries weight. White-space innovation thrives in three pockets: ultra-high-purity pharmaceutical solvents below 50 ppm residuals, low-odor carriers for indoor architectural paints, and proprietary blends optimized for polymer dissolution recycling. AI-enabled recovery systems, led by Honeywell’s Forge installations that trim solvent losses to 2%–3% of throughput, can lop USD 50–100 per metric ton off operating costs, creating an efficiency wedge that favors technology-forward producers. Meanwhile, mass-balance certification debates may shake customer confidence; NGOs are pressing for segregated bio-streams rather than bookkeeping approaches, potentially reshaping investment flows toward dedicated renewable assets.
Solvents Industry Leaders
-
BASF SE
-
Dow
-
Exxon Mobil Corporation
-
LyondellBasell Industries Holdings BV
-
INEOS
- *Disclaimer: Major Players sorted in no particular order
Solvents Market Companies Covered in this Report
- ADM
- Arkema
- Ashland
- BASF SE
- Bharat Petroleum Corporation Limited
- Braskem
- Cargill, Incorporated
- Celanese Corporation
- Chevron Phillips Chemical Company LLC
- Clariant
- Dow
- Eastman Chemical Company
- Exxon Mobil Corporation
- Gandhar Oil Refinery (India) Limited
- GROUPE BERKEM
- Honeywell International Inc.
- Huntsman International LLC
- Idemitsu Kosan Co., Ltd.
- INEOS
- LyondellBasell Industries Holdings BV
- OXEA
- Sasol Limited
- Shell plc
- Solvay
- TotalEnergies SE
Market Opportunities and Future Outlook
White space is emerging in higher-purity and higher-specification solvent grades for electronics, batteries, and regulated formulation work, where quality systems, traceability, and tight impurity control set a higher bar than commodity scale. In China, Hubei Yihua initiated a 4.88 billion yuan project in May 2026 that includes a 300,000-ton/year electronic-grade dimethyl carbonate unit, signaling investment momentum toward battery electrolyte solvent chains. On the demand side, tightening VOC requirements in coatings continues to steer solvent selection toward oxygenates and compliant blends, which increases the value of technical service, specification management, and solvent-recovery integration relative to spot-only sourcing.
Capacity moves and feedstock integration are also changing competitive options for oxygenated and specialty solvent pools. OXEA confirmed a final investment decision in July 2026 to expand propionaldehyde, propanol, and butanol capacity at Bay City, Texas, with site preparation for a new on-site syngas unit planned for Q3 2026. This supports more resilient supply of key oxygenated building blocks. In parallel, scale additions in Asia, including Qixiang Tengda operating a 260,000 tonnes/year MEK unit, raise the premium on differentiation through consistent specifications, certifications, and closed-loop recovery offerings for customers targeting both cost control and compliance. Policy-driven industrial localization programs further widen scope for domestic capacity and substitution of imports in select markets, such as Balaji Amines starting commercial production at a 100,000 TPA dimethyl ether facility in India in May 2026.
Recent Industry Developments in Solvents Market
- July 2026: OXEA confirmed a final investment decision to expand capacity at its Bay City, Texas, site for propionaldehyde, propanol, and butanol, and outlined site preparation for a new on-site syngas unit in Q3 2026. The move improves North American availability of oxygenated solvent building blocks used in coatings and chemical intermediates. It also supports more integrated, flexible production economics versus merchant feedstock dependence.
- October 2025: BASF inaugurated an 80,000-metric-ton neopentyl glycol plant at its Zhanjiang Verbund site in China, increasing global NPG capacity to 335,000 metric tons. The start-up expands integrated supply into coatings and resin value chains where NPG-linked intermediates compete for solvent-enabled formulations. It further reinforces the role of large Verbund complexes in reducing logistics risk for regional customers.
- March 2024: Dow announced its intent to invest in a world-scale carbonate solvents facility on the US Gulf Coast to support lithium-ion battery supply chains, using captured CO2 from ethylene oxide production. The project links solvent supply growth to decarbonization pathways and battery-grade specifications rather than purely commodity demand. It also indicates continued capital allocation toward specialty solvent platforms positioned near advantaged feedstocks and major export logistics.
Solvents Market Report Scope and Research Methodology
Market Definition and Coverage
For this study, the solvents market covers commercially sold solvent products used to dissolve, thin, disperse, or clean in industrial and consumer formulations. It includes petroleum-based and bio-based chemistries traded as solvent grades across major regions.
Scope exclusions: on-site recycled solvent streams and supercritical extraction fluids, which are mainly bundled with equipment, are excluded from the market totals.
Segments Covered in This Report
- By Source
- Bio-based Solvents
- Petrochemical-based Solvents
- By Type
- Oxygenated Solvents
- Hydrocarbon Solvents
- Halogenated Solvents
- By Application
- Paints and Coatings
- Adhesives
- Pharmaceuticals
- Personal Care
- Polymer Production
- Other Applications (Printing Inks, Agricultural Chemicals, and Metal Cleaning)
- By Geography
- Asia-Pacific
- China
- India
- Japan
- South Korea
- Malaysia
- Thailand
- Indonesia
- Vietnam
- Rest of Asia-Pacific
- North America
- United States
- Canada
- Mexico
- Europe
- Germany
- United Kingdom
- France
- Italy
- Spain
- Nordic
- Turkey
- Russia
- Rest of Europe
- South America
- Brazil
- Argentina
- Colombia
- Rest of South America
- Middle East and Africa
- Saudi Arabia
- Qatar
- United Arab Emirates
- South Africa
- Nigeria
- Egypt
- Rest of Middle East and Africa
- Asia-Pacific
Data Sources, Market Sizing, and Validation
Desk Research
Desk research was used to set the market boundary and build the first set of demand and supply signals that can be checked over time. We relied on public and official references such as UN Comtrade trade statistics, USGS chemicals and materials data, U.S. EPA VOC and solvent-related regulatory resources, Eurostat industry and trade tables, and journals such as ACS Publications for solvent chemistry and application trends.
To keep company-level direction realistic, we also reviewed annual reports, investor presentations, sustainability disclosures, and credible trade press that discusses capacity changes, feedstock moves, and plant operating rates. Where needed, paid subscriptions that support company financials and intelligence, patent landscapes, and import-export shipment-level views were used to validate assumptions like product mix and route shifts. The desk sources listed here are illustrative, and many other public and paid references were also used for data collection, cross-checking, and clarification.
Primary Interviews and Surveys
Primary work focused on interviews and short surveys with producers, distributors, formulators, and large end users across coatings, adhesives, pharmaceuticals, and cleaning applications. We used these discussions to confirm which solvent families were being substituted, how pricing is moving by grade, and how demand differs by region. Those inputs were then used to tune the model assumptions.
Distribution of primary research fieldwork respondents
| Company type | Respondent position | Region |
|---|---|---|
| Top tier: 27% | CXOs: 15% | APAC: 45% |
| Mid tier: 52% | Functional/Unit leaders: 32% | EMEA: 36% |
| Smaller Players: 21% | Managers: 53% | Americas: 19% |
Market-Sizing & Forecasting
Sizing started with a top-down build where production and trade flows were used to reconstruct regional consumption, then aligned to the main solvent use pools in paints and coatings, adhesives, pharmaceuticals, personal care, and polymer processing. We corroborated the totals through selective bottom-up checks, including sampled supplier revenue lines, distributor channel checks, and volume-by-grade multiplied by realistic average selling prices.
Key inputs that shaped the model include regional coatings output trends, industrial production indicators tied to chemical demand, observed shifts between oxygenated and hydrocarbon solvent families, typical purity and regulatory-driven grade mix (for example, low-VOC compliant formulations), and feedstock-linked price movements that change solvent ASPs. When a bottom-up view was incomplete for smaller countries, gaps were handled using proxy variables such as relative manufacturing output and trade intensity, followed by interview-based correction factors.
For forecasting, we used scenario analysis so growth could be flexed based on plausible paths for VOC regulation tightening, bio-based substitution pace, and cyclical demand from downstream manufacturing. The final trajectory stayed consistent with the variables above and was refined using what interviewees expected for regional operating rates and pricing normalization.
Data Validation & Update Cycle
Model outputs were checked against independent signals such as trade balance direction, known capacity additions or shutdowns, and downstream activity trends that typically move solvent demand. If a region showed a sharp jump that did not match these signals, the assumptions were revisited and, when needed, respondents were re-contacted to determine whether it was a one-off event or a real step change.
Before sign-off, the work went through multiple analyst reviews, including math checks, unit consistency checks, and variance checks versus prior editions. The report is refreshed annually, and material events such as major plant outages, regulatory shifts, or feedstock shocks can trigger interim updates. Right before delivery, a final pass is done so clients receive the most current view available.
Mordor Intelligence's Global Solvents Market Size Compared With Other Published Estimates
Different published numbers for solvents can look far apart because the underlying scope and counting logic are not always the same. The biggest differences usually come from what is treated as a solvent product sale versus an internal stream, how bio-based grades are handled, and whether pricing is modeled as a blended average or as grade-level pricing.
In this study, the spread is mainly explained by excluding on-site recycled solvent loops and by counting only commercially traded solvent grades (not cleaning blends sold as finished mixtures). This scope choice is applied by Mordor Intelligence.
Benchmark comparison
| Source | Market Size | Gaps in Research Methodology |
|---|---|---|
| Mordor Intelligence | USD 35.16 B (2026) | |
| Trade Publication A | USD 32.53 B (2024) | Uses a broader chemicals category definition in places and may apply conservative pricing progression, which can pull the headline value down versus grade-weighted ASP logic. |
| Industry Report B | USD 50.58 B (2031) | Reports a later-year value with a lower stated CAGR profile, and the scope language suggests a revenue roll-up approach that can vary by whether blended products and wider solvent-like materials are counted. |
The table shows that year selection and scope boundaries create most of the variance, even before forecasting assumptions are compared. By keeping the demand pool tied to traded solvent grades and by checking totals against trade and downstream activity signals, the final number stays traceable to a repeatable set of inputs that a buyer can audit and update.
Key Questions Answered in the Report
How fast is global demand for solvents projected to grow through 2031?
The solvents market is forecast to expand at a 4.73% CAGR, reaching USD 44.30 billion by 2031.
Which end-use segment will add the most incremental volume?
Pharmaceutical manufacturing, particularly in India and China, is set to show the quickest 5.04% annual increase in solvent consumption.
What was Asia-Pacific’s share in 2025, and how fast is it expected to grow through 2031?
Asia-Pacific already held 42.35% in 2025 and is on course for a 5.21% CAGR, keeping it the largest regional demand center.
Which solvent types face the steepest regulatory headwinds?
Hydrocarbon, especially aromatic, solvents confront phase-outs in automotive interiors and tougher VOC caps in coatings markets.
Are bio-based solvents cost-competitive with petroleum grades?
They currently carry 20%–40% premiums, becoming economically attractive mainly when crude prices sustain above USD 90 per barrel or when carbon-credit mechanisms offset the gap.
How fragmented is supplier competition?
The top 10 companies control 45%–50% of installed capacity, so the global field remains moderately fragmented, offering opportunities for niche specialists.