
| Study Period | 2018 - 2030 |
| Base Year For Estimation | 2024 |
| Forecast Data Period | 2025 - 2030 |
| Market Size (2025) | USD 706.6 Billion |
| Market Size (2030) | USD 901.7 Billion |
| CAGR (2025 - 2030) | 5.00 % |
| Market Concentration | Low |
Major Players*Disclaimer: Major Players sorted in no particular order |


Soft Drinks Market Analysis
The Soft Drinks Market size is estimated at 706.6 billion USD in 2025, and is expected to reach 901.7 billion USD by 2030, growing at a CAGR of 5.00% during the forecast period (2025-2030).
The soft drink industry is experiencing a significant transformation driven by evolving consumer preferences and health consciousness. Major manufacturers are actively reformulating their products to align with the growing demand for healthier alternatives, particularly focusing on reduced sugar content and natural ingredients. This shift is evidenced by recent innovations like Coca-Cola's launch of Y3000 in October 2023, which leverages artificial intelligence to create new flavors that cater to changing consumer preferences. The industry has witnessed a notable trend where approximately 72% of UK consumers in 2023 expressed a preference for energy drinks containing natural ingredients and associated health benefits, highlighting the growing importance of clean label products.
Sustainability has emerged as a crucial focus area for the soft drinks market, with major players implementing comprehensive environmental initiatives. Companies are increasingly transitioning to eco-friendly packaging solutions, as demonstrated by significant developments in 2023. For instance, Coca-Cola India introduced fully recycled PET bottles for its carbonated beverages in October 2023, while PepsiCo India launched 100% recycled PET bottles for Pepsi Black in July 2023. These initiatives reflect the industry's commitment to reducing its environmental footprint while maintaining product quality and consumer appeal.
The industry is witnessing a notable shift in consumer behavior, particularly regarding health-conscious purchasing decisions. In 2022, approximately 32% of Chinese consumers specifically sought out health-focused products, including nutritious beverages, indicating a growing awareness of the relationship between diet and wellness. This trend is further reinforced by the fact that about 40% of juice and smoothie consumers in the United States increased their juice intake in 2023, primarily motivated by the desire to boost their vitamin intake and overall health benefits.
Digital transformation and social media marketing have become increasingly vital in shaping consumer preferences and driving soft drink industry trends. The industry has witnessed enhanced engagement through digital platforms, as exemplified by the significant social media penetration in markets like Saudi Arabia, where 28.81 million users (representing 79.30% of the population) were active on social media platforms in 2023. Companies are leveraging these platforms for product launches, consumer engagement, and brand building, creating more personalized and interactive experiences for consumers while gathering valuable insights into changing preferences and trends.
Global Soft Drinks Market Trends
Continous innovation in flavors along with unique formations are catering to changing consumer preferences
- The average volume per person in the Soft Drinks market amounted to 42.91 liters in 2023. RTD coffee, RTD tea, RTD juices, energy drinks are high in demand due to their convenient and health benefits. The soft drink consumption is increasing rapidly owing to continued attention on health and comfort.
- Products are constantly being developed to cater to a wide range of consumers who are getting more health-conscious, brands like Pepsi recently released Pepsi Zero Sugar Cola Soft Drink with Mango Flavor. However, juices and nectars, carbonated beverages, and iced tea were the most launched soft drink subcategories in 2022.
- The average retail prices has increased from USD 0.3 per 355 ml in 2019 to USD 0.5 per 355 ml in 2023. However, the soft drinks market per person revenues of USD 111.20 are generated in 2023. In global comparison, most revenue is generated in the United States where carbonated beverage sales were up 9.7% totaling USD 35.1 billion for the 52 weeks ending May 15, in total U.S. multi-outlets.
- Many people have experienced a quick boost in their energy after consuming soft drinks. It boosts a person’s mind and also helps in regaining energy. Drinking carbonated soft drinks can make consumer feel better in nausea. Furthermore, soft drinks in addition to water also meets the minimum fluid requirement by the body.
Understand The Key Trends Shaping This Market
Download PDF
OTHER KEY INDUSTRY TRENDS COVERED IN THE REPORT
- Brands are investing in packaging solutions leading to a shift towards eco-friendly packaging solutions
- Coca Cola developed unique strategies like customized bottle designs, festive season designs, and other innovative packaging to attract customers thereby marking its dominance
Segment Analysis: Soft Drink Category
Carbonated Soft Drinks Segment in Global Soft Drinks Market
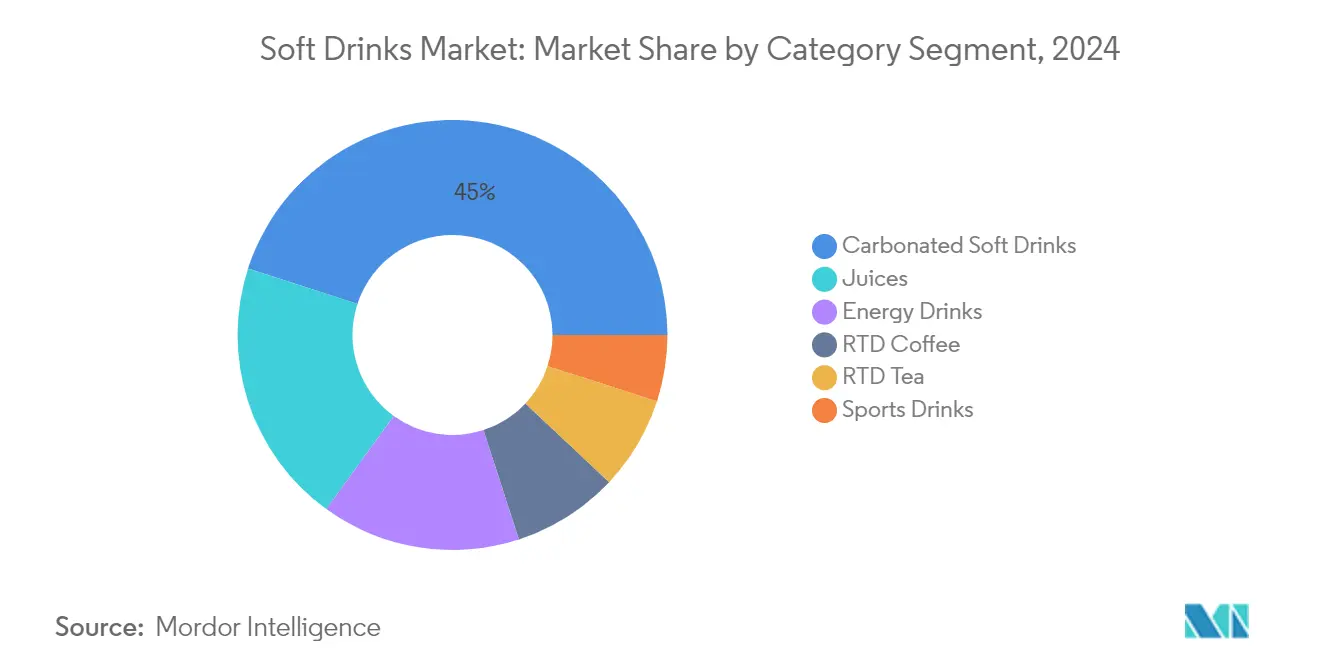
Carbonated soft drinks maintain their dominance in the global soft drinks market, commanding approximately 45% soft drink market share in 2024. This segment's strong position is driven by continuous product innovations, particularly in sugar-free and low-calorie variants, along with the introduction of unique flavors to cater to evolving consumer preferences. Major players like Coca-Cola and PepsiCo have strengthened their market presence through strategic marketing campaigns and celebrity endorsements. The segment's growth is further supported by the widespread availability of these beverages through various distribution channels, including supermarkets, convenience stores, and online platforms. Additionally, the increasing demand for premium and craft sodas, often featuring natural ingredients and innovative flavor combinations, has helped maintain the segment's market leadership.
RTD Tea Segment in Global Soft Drinks Market
The Ready-to-Drink (RTD) tea segment is emerging as the most dynamic category in the soft drinks market, projected to achieve remarkable growth between 2024 and 2029. This growth is primarily driven by increasing health consciousness among consumers who are seeking alternatives to traditional carbonated beverages. The segment's expansion is supported by continuous product innovations, including the introduction of functional ingredients, natural sweeteners, and unique flavor combinations. Manufacturers are focusing on developing premium RTD tea products with added health benefits, such as antioxidants and natural energy boosters. The segment is also benefiting from the rising popularity of green tea and herbal tea variants, particularly among health-conscious millennials and Gen Z consumers. Additionally, the convenience factor of RTD tea products, coupled with their perceived health benefits, has contributed to their increasing adoption across various consumer demographics.
Remaining Segments in Soft Drink Category
The soft drink industry encompasses several other significant segments, including energy drinks, juices, RTD coffee, and sports drinks, each serving distinct consumer needs and preferences. Energy drinks have carved out a strong niche, particularly among younger consumers and sports enthusiasts, while the juice segment maintains its appeal through natural and functional beverage offerings. RTD coffee continues to evolve with innovative flavors and formats, catering to the growing coffee culture and on-the-go consumption trends. Sports drinks have established themselves as essential beverages for athletes and fitness enthusiasts, with manufacturers focusing on enhanced hydration and recovery benefits. These segments collectively contribute to the market's diversity and cater to various consumer preferences and occasions.
Segment Analysis: Packaging Type
PET Bottles Segment in Global Soft Drinks Market
PET bottles maintain their dominance in the soft drink industry packaging market, commanding approximately 58% market share in 2024. This leadership position can be attributed to PET bottles' superior cost-effectiveness and reduced energy requirements during transportation, weighing only about 15% of comparable glass containers. Their glass-like transparency, lightweight nature, and exceptional resistance to shattering make them ideal for challenging transport conditions. PET bottles also offer manufacturers significant flexibility in customization, allowing for easy incorporation of labels, graphics, and branding elements that enhance brand visibility. Major companies are increasingly adopting recycled PET bottles for their soft drink offerings, driven by sustainability concerns and recycling initiatives. For instance, in October 2023, Coca-Cola India introduced fully recycled PET bottles for its carbonated beverages in 250 ml and 750 ml sizes, while in July 2023, PepsiCo India launched 100% recycled PET bottles for Pepsi Black.
Glass Bottles Segment in Global Soft Drinks Market
Glass bottles are emerging as the fastest-growing segment in the soft drinks packaging market, projected to achieve approximately 6% growth from 2024 to 2029. This growth trajectory is driven by several key factors, including the material's superior ability to preserve taste and quality. Being non-reactive, glass bottles ensure beverage flavors remain intact, making them an ideal packaging choice for premium products. The segment's growth is further propelled by increasing consumer awareness around sustainability and environmental concerns, with glass being infinitely recyclable without quality loss. Glass packaging is particularly gaining traction in the ready-to-drink (RTD) tea segment, where preservation of natural flavors and antioxidants is crucial. Manufacturers are also investing in innovative glass packaging designs and lighter weight options to address transportation and handling concerns while maintaining the premium appeal that glass bottles offer to consumers.
Remaining Segments in Packaging Type
The soft drinks packaging landscape is further diversified by metal cans, aseptic packages, and disposable cups, each serving distinct market needs. Metal cans have established themselves as a reliable packaging solution, particularly favored for carbonated beverages due to their excellent gas barrier properties and ability to maintain product freshness. Aseptic packages offer extended shelf life without requiring refrigeration, making them particularly suitable for juices and other non-carbonated beverages. Disposable cups cater primarily to the immediate consumption and food service segments, offering convenience for on-the-go consumption. These packaging formats continue to evolve with technological advancements and changing consumer preferences, with manufacturers increasingly focusing on sustainable and recyclable options across all segments.
Segment Analysis: Distribution Channel
Supermarket/Hypermarket Segment in Global Soft Drinks Market
Supermarkets and hypermarkets maintain their dominance in the global soft drinks distribution landscape, commanding approximately 48% of the market share of soft drinks in 2024. This channel's supremacy can be attributed to its ability to offer an extensive selection of carbonated soft drinks, including traditional cola, fruit-flavored varieties, and low-sugar options. These retail giants leverage their ample infrastructure to stock a vast range of soft drinks encompassing various packaging formats and brands. Major retailers like Walmart, Kroger, and Target employ dynamic pricing strategies for soft drinks, offering them at low, medium, and high price points to attract a diverse customer base. The average selling price for these beverages stands at USD 2.23, with some options priced as high as USD 11.34, reflecting the segment's pricing variability. Their strategic placement of soft drinks near checkout counters amplifies impulse purchases, while bulk purchase options and frequent promotional activities further solidify their market position.
Online Retail Segment in Global Soft Drinks Market
The online retail channel is experiencing remarkable growth, projected to achieve approximately 6% growth from 2024 to 2029. This surge is primarily driven by the convenience of purchasing a diverse array of soft drinks online, which saves time and helps consumers avoid crowds at physical stores. The increasing number of smartphone users, coupled with extensive internet penetration in key regions, is expected to boost online soft drink sales. As of April 2023, there were 5.18 billion internet users globally, representing 64.6% of the world's population. Additional benefits such as complimentary deliveries, straightforward order cancellation, efficient refund processes, and attractive coupon codes enhance the online shopping experience. Major online retailers, including Amazon, Walmart, Costco, and Kroger, offer a variety of soft drink flavors and packaging options through their e-commerce channels. The convenience and time-saving benefits of online shopping continue to fuel the surge in soft drink purchases through this channel.
Remaining Segments in Distribution Channel
The soft drinks market encompasses several other significant distribution channels, including convenience stores, specialty stores, and on-trade venues. Convenience stores serve as crucial points of sale, particularly for impulse purchases and immediate consumption needs, with their widespread presence and extended operating hours. Specialty stores cater to niche markets and premium products, offering unique and artisanal soft drink varieties that appeal to discerning consumers. The on-trade channel, comprising restaurants, bars, cafes, and other foodservice establishments, plays a vital role in the market by providing freshly prepared beverages and mixing options. These channels collectively contribute to the market's diversity and accessibility, each serving distinct consumer preferences and consumption occasions while maintaining their unique value propositions in the distribution landscape.
Soft Drinks Market Geography Segment Analysis
Soft Drinks Market in Africa
The African soft drinks market demonstrates significant regional diversity in consumption patterns and preferences. Egypt, Nigeria, and South Africa emerge as key markets, each with distinct characteristics shaped by local tastes, demographics, and economic conditions. The region's growth is primarily driven by increasing urbanization, rising disposable incomes, and a growing young population. Manufacturers are adapting their strategies to cater to local preferences while introducing healthier alternatives to meet evolving consumer demands. The market is witnessing a transformation with the introduction of natural ingredients, reduced sugar content, and innovative flavors that appeal to health-conscious consumers.
Soft Drinks Market in Nigeria
Nigeria stands out as the largest soft drinks market in Africa, commanding approximately 35% market share of soft drinks in 2024. The country's dominance is attributed to its large population and growing middle class, which has fueled the demand for various soft drink categories. The market is characterized by strong distribution networks and effective marketing strategies that resonate with local consumers. Nigerian consumers show a particular affinity for carbonated soft drinks and juices, with a notable trend toward fruit-flavored beverages. The presence of both international and local brands has created a competitive landscape, leading to continuous product innovations and improved accessibility across urban and rural areas.
Growth Dynamics in Nigerian Soft Drinks Market
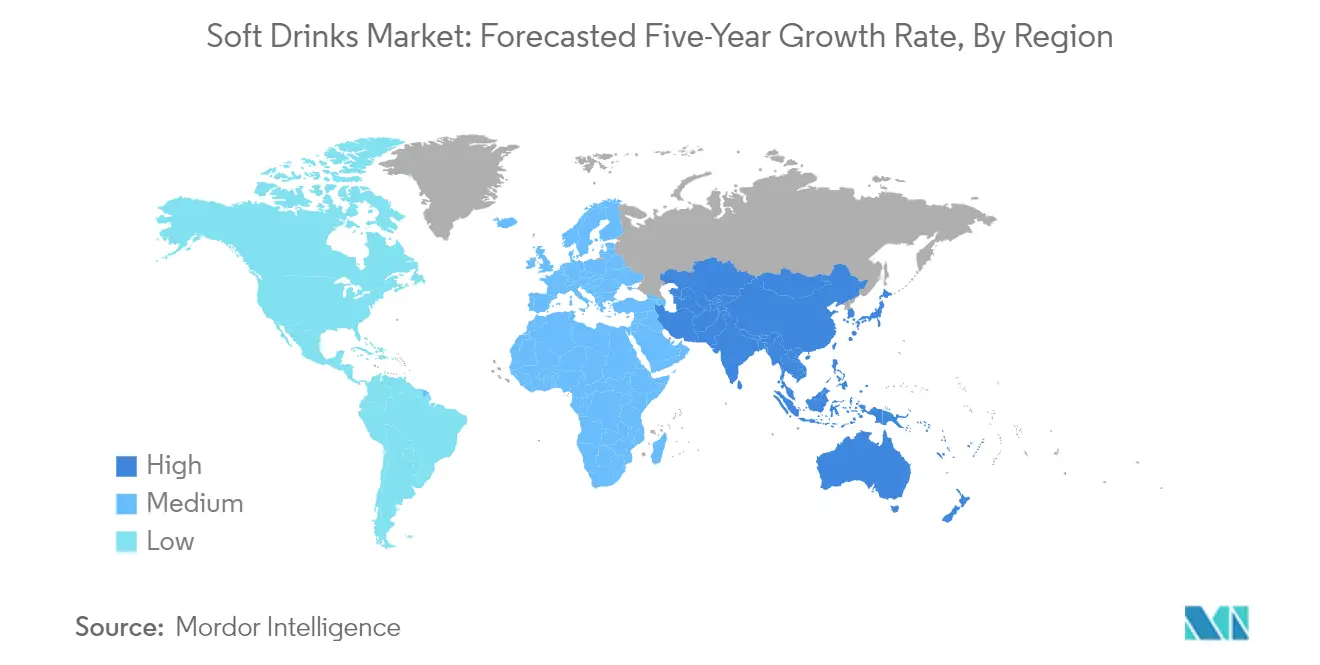
Nigeria is projected to maintain its position as the fastest-growing market in Africa, with an expected growth rate of approximately 12% from 2024 to 2029. This exceptional growth is driven by several factors, including rapid urbanization and a youthful demographic profile. The country's soft drinks industry is witnessing significant investments in production capacity and distribution infrastructure. Health consciousness is increasingly influencing consumer choices, leading to a rising demand for natural and functional beverages. The market is also benefiting from innovative marketing approaches and the introduction of new flavors that cater to local preferences.
Soft Drinks Market in Asia-Pacific
The Asia-Pacific region represents a dynamic and diverse soft drinks market, characterized by varying consumer preferences and consumption patterns across different countries. The market encompasses major economies like China, Japan, India, and emerging markets such as Indonesia, Vietnam, and Thailand. Consumer behavior in the region is increasingly influenced by health consciousness, leading to a growing demand for functional beverages and natural ingredients. The market is witnessing significant innovations in product formulations and packaging, with manufacturers focusing on sustainable practices and health-oriented offerings.
Soft Drinks Market in China
China dominates the Asia-Pacific soft drinks market, holding approximately 40% market share of soft drinks in 2024. The country's market leadership is supported by its vast population, rising disposable incomes, and extensive distribution networks. Chinese consumers show increasing sophistication in their beverage choices, with a growing preference for premium and functional drinks. The market is characterized by strong domestic brands competing alongside international players, leading to continuous innovation in flavors and formulations. Urban areas drive significant consumption, with younger consumers particularly receptive to new product launches and health-oriented beverages.
Growth Trajectory in Chinese Soft Drinks Market
China is maintaining its position as the fastest-growing market in the Asia-Pacific region, with a projected growth rate of approximately 8% from 2024 to 2029. This robust growth is driven by increasing urbanization, rising health consciousness, and evolving consumer preferences. The market is witnessing significant investments in product innovation and distribution infrastructure. Digital marketing and e-commerce platforms play crucial roles in reaching consumers, particularly the younger demographic. The trend toward premium and functional beverages continues to shape market development, with manufacturers focusing on natural ingredients and health benefits.
Soft Drinks Market in Europe
Europe's soft drinks market showcases a mature yet dynamic landscape, with diverse consumer preferences across different regions. The market encompasses both established Western European markets and emerging Eastern European economies, each with distinct consumption patterns. Health consciousness and sustainability concerns significantly influence consumer choices, leading to increased demand for natural and low-sugar alternatives. The region demonstrates strong innovation in product development, particularly in functional beverages and sustainable packaging solutions.
Soft Drinks Market in Germany
Germany leads the European soft drinks market, commanding approximately 17% market share in 2024. The country's market leadership reflects its strong retail infrastructure and consumer purchasing power. German consumers demonstrate a growing preference for healthier beverage options, driving innovation in natural and functional drinks. The market features a robust distribution network and strong presence of both domestic and international brands. Environmental consciousness plays a significant role in shaping consumer choices and manufacturer strategies.
Growth Dynamics in Turkish Soft Drinks Market
Turkey emerges as the fastest-growing market in Europe, with a projected growth rate of approximately 7% from 2024 to 2029. The market benefits from a young population and increasing urbanization trends. Turkish consumers show strong interest in innovative flavors and functional benefits. The market witnesses continuous product innovations and expanding distribution networks. Health awareness and changing lifestyle patterns contribute significantly to market growth, particularly in urban areas.
Soft Drinks Market in Middle East
The Middle Eastern soft drinks market demonstrates robust growth potential, driven by factors such as high disposable incomes, young population demographics, and changing consumer preferences. Qatar, Saudi Arabia, and the United Arab Emirates represent key markets in the region, each contributing significantly to overall market development. Saudi Arabia emerges as the largest market, while the rest of the Middle East shows the fastest growth potential. The region's hot climate drives strong demand for refreshing beverages, while increasing health consciousness influences product innovations and marketing strategies. Manufacturers are focusing on introducing healthier alternatives and unique flavors to cater to evolving consumer preferences.
Soft Drinks Market in North America
The North American soft drinks industry represents a mature yet innovative landscape, characterized by sophisticated consumer preferences and strong brand presence. The United States, Canada, and Mexico each contribute uniquely to the market's dynamics, with varying consumer behaviors and preferences. The United States maintains its position as the largest market, while Mexico demonstrates the fastest growth potential. Health consciousness and sustainability concerns increasingly influence consumer choices, leading to innovations in natural ingredients and packaging solutions. The region witnesses continuous product development, particularly in functional beverages and sugar-free alternatives, while maintaining strong traditional carbonated drink segments.
Soft Drinks Market in South America
The South American soft drink market exhibits unique characteristics shaped by local preferences and cultural influences. Brazil and Argentina represent the key markets in the region, each with distinct consumption patterns and consumer preferences. Brazil emerges as the largest market, while Argentina shows promising growth potential. The region's tropical climate drives strong demand for refreshing beverages, while increasing health consciousness influences product development. Manufacturers focus on introducing innovative flavors and healthier alternatives to meet evolving consumer demands. The market benefits from strong distribution networks and effective marketing strategies that resonate with local consumers.
Get Analysis on Important Geographic Markets
Download PDF
Soft Drinks Industry Overview
Top Companies in Soft Drinks Market
The soft drinks market is characterized by continuous product innovation among major players, with soft drinks companies focusing on developing healthier alternatives and unique flavor profiles to meet evolving consumer preferences. Operational agility is demonstrated through the rapid adaptation of manufacturing processes to accommodate new product launches and sustainable packaging initiatives, particularly in recyclable PET bottles and eco-friendly materials. Strategic moves in the industry predominantly revolve around partnerships with sports organizations, entertainment venues, and digital platforms to enhance brand visibility and market penetration. Companies are expanding their geographical footprint through strategic acquisitions of regional brands and establishing new manufacturing facilities in emerging markets, while simultaneously strengthening their distribution networks through partnerships with local bottlers and retailers. The emphasis on digital transformation and automation in production processes, combined with investments in research and development for innovative beverages, reflects the industry's commitment to maintaining competitive advantages.
Consolidated Market Led By Global Giants
The soft drink industry exhibits a moderately consolidated structure dominated by multinational conglomerates with extensive brand portfolios and global distribution networks. These industry leaders leverage their established manufacturing capabilities, robust supply chains, and strong brand recognition to maintain their market positions, while regional players focus on serving local preferences and niche market segments. The competitive landscape is characterized by a mix of global beverage specialists and diversified food and beverage conglomerates, with companies like Coca-Cola and PepsiCo maintaining significant soft drink market share through their extensive product portfolios and distribution capabilities. The presence of numerous regional players, particularly in emerging markets, adds to the competitive intensity, though their influence remains largely localized.
The market has witnessed significant merger and acquisition activity, with major players acquiring smaller, innovative beverage companies to expand their product portfolios and gain access to new market segments. These strategic acquisitions particularly target companies with strong positions in emerging categories such as functional beverages, energy drinks, and natural/organic offerings. Companies are also forming strategic alliances with technology providers and sustainability-focused organizations to enhance their operational efficiency and environmental credentials, while simultaneously investing in direct-to-consumer channels and digital platforms to strengthen their market presence.
Innovation and Sustainability Drive Future Success
Success in the soft drink industry increasingly depends on companies' ability to innovate while maintaining sustainable practices throughout their value chain. Market leaders are focusing on developing healthier beverage options, incorporating natural ingredients, and reducing sugar content to address growing health consciousness among consumers. Companies are investing heavily in sustainable packaging solutions, water conservation initiatives, and renewable energy adoption to meet environmental regulations and consumer expectations. The ability to maintain efficient distribution networks while adapting to changing retail landscapes, particularly the growth of e-commerce, has become crucial for maintaining soft drink market share.
For contenders looking to gain ground, differentiation through unique product offerings and strong regional presence remains key. Success factors include developing products tailored to local tastes, establishing efficient supply chains, and building strong relationships with retailers and distributors. Companies must also navigate increasing regulatory scrutiny regarding sugar content, packaging waste, and environmental impact while maintaining price competitiveness. The ability to quickly adapt to changing consumer preferences, invest in digital capabilities, and maintain operational efficiency while meeting sustainability goals will determine future market success. Additionally, companies must focus on building direct relationships with consumers through digital platforms and innovative marketing approaches to strengthen brand loyalty and market position.
Soft Drinks Market Leaders
-
PepsiCo, Inc.
-
Red Bull GmbH
-
Suntory Holdings Limited
-
The Coca-Cola Company
-
Tingyi (Cayman Islands) Holding Corporation
- *Disclaimer: Major Players sorted in no particular order

Need More Details on Market Players and Competiters?
Download PDF
Soft Drinks Market News
- February 2024: Pepsi Gatorade has entered into a partnership with the top tier of Saudi Arabian soccer, becoming its official sports drink partner. The collaboration is focused on enhancing the matchday experience for fans through a series of activations and events.
- February 2024: Rockstar® Energy Drink, a subsidiary of PepsiCo, Inc unveiled “Rockstar Focus™,” a new line of energy drinks delivering energy & mental boost made with innovative ingredients like Lion’s Mane, a mushroom used in traditional eastern cultures, and providing 200 mg of caffeine. These products are avilable in retail channels in Saudi Arabia, UAE and Qatar.
- December 2023: Costa Coffee’s Moroccan franchisee Goldex Morocco planned to launch five new outlets in Morocco by the end of Q3 2023 at a cost of USD 3.2 million. Two will be in Casablanca, two in Rabat and the final outlet will be opened in Bouskoura.
Free With This Report
We provide a comprehensive and exhaustive set of data pointers for global, regional, and country-level metrics that illustrate the fundamentals of the soft drinks industry. With the help of 45+ free charts, clients can access in-depth market analysis based on price trend analysis of per capita spending on various soft drinks, through granular-level segmental information supported by a repository of market data, trends, and expert analysis. Data and analysis on soft drink category, packaging type, distribution channel insights into consumer preferences and purchasing patterns, an overview of key market players, etc., are available in the form of comprehensive reports as well as excel-based data worksheets.


Soft Drinks Market Report - Table of Contents
1. EXECUTIVE SUMMARY & KEY FINDINGS
2. REPORT OFFERS
3. INTRODUCTION
- 3.1 Study Assumptions & Market Definition
- 3.2 Scope of the Study
- 3.3 Research Methodology
4. KEY INDUSTRY TRENDS
- 4.1 Consumer Buying Behaviour
- 4.2 Innovations
- 4.3 Brand Share Analysis
- 4.4 Regulatory Framework
5. MARKET SEGMENTATION (includes market size in Value in USD and Volume, Forecasts up to 2030 and analysis of growth prospects)
-
5.1 Soft Drink Category
- 5.1.1 Carbonated Soft Drinks
- 5.1.1.1 By Soft Drink Type
- 5.1.1.1.1 Diet Cola
- 5.1.1.1.2 Fruit Flavored Carbonates
- 5.1.1.1.3 Standard Cola
- 5.1.1.1.4 Other Types
- 5.1.2 Energy Drinks
- 5.1.2.1 By Soft Drink Type
- 5.1.2.1.1 Energy Shots
- 5.1.2.1.2 Natural/Organic Energy Drinks
- 5.1.2.1.3 Sugar-free or Low-calories Energy Drinks
- 5.1.2.1.4 Traditional Energy Drinks
- 5.1.2.1.5 Other Energy Drinks
- 5.1.3 Juices
- 5.1.3.1 By Soft Drink Type
- 5.1.3.1.1 100% Juice
- 5.1.3.1.2 Juice Drinks (up to 24% Juice)
- 5.1.3.1.3 Juice concentrates
- 5.1.3.1.4 Nectars (25-99% Juice)
- 5.1.4 RTD Coffee
- 5.1.4.1 By Soft Drink Type
- 5.1.4.1.1 Cold Brew Coffee
- 5.1.4.1.2 Iced coffee
- 5.1.4.1.3 Other RTD Coffee
- 5.1.5 RTD Tea
- 5.1.5.1 By Soft Drink Type
- 5.1.5.1.1 Green Tea
- 5.1.5.1.2 Herbal Tea
- 5.1.5.1.3 Iced Tea
- 5.1.5.1.4 Other RTD Tea
- 5.1.6 Sport Drinks
- 5.1.6.1 By Soft Drink Type
- 5.1.6.1.1 Electrolyte-Enhanced Water
- 5.1.6.1.2 Hypertonic
- 5.1.6.1.3 Hypotonic
- 5.1.6.1.4 Isotonic
- 5.1.6.1.5 Protein-based Sport Drinks
-
5.2 Packaging Type
- 5.2.1 Aseptic packages
- 5.2.2 Disposable Cups
- 5.2.3 Glass Bottles
- 5.2.4 Metal Can
- 5.2.5 PET Bottles
-
5.3 Distribution Channel
- 5.3.1 Off-trade
- 5.3.1.1 Convenience Stores
- 5.3.1.2 Online Retail
- 5.3.1.3 Specialty Stores
- 5.3.1.4 Supermarket/Hypermarket
- 5.3.1.5 Others
- 5.3.2 On-trade
-
5.4 Region
- 5.4.1 Africa
- 5.4.1.1 Egypt
- 5.4.1.2 Nigeria
- 5.4.1.3 South Africa
- 5.4.1.4 Rest of Africa
- 5.4.2 Asia-Pacific
- 5.4.2.1 Australia
- 5.4.2.2 China
- 5.4.2.3 India
- 5.4.2.4 Indonesia
- 5.4.2.5 Japan
- 5.4.2.6 Malaysia
- 5.4.2.7 South Korea
- 5.4.2.8 Thailand
- 5.4.2.9 Vietnam
- 5.4.2.10 Rest of Asia-Pacific
- 5.4.3 Europe
- 5.4.3.1 Belgium
- 5.4.3.2 France
- 5.4.3.3 Germany
- 5.4.3.4 Italy
- 5.4.3.5 Netherlands
- 5.4.3.6 Russia
- 5.4.3.7 Spain
- 5.4.3.8 Turkey
- 5.4.3.9 United Kingdom
- 5.4.3.10 Rest of Europe
- 5.4.4 Middle East
- 5.4.4.1 Qatar
- 5.4.4.2 Saudi Arabia
- 5.4.4.3 United Arab Emirates
- 5.4.4.4 Rest of Middle East
- 5.4.5 North America
- 5.4.5.1 Canada
- 5.4.5.2 Mexico
- 5.4.5.3 United States
- 5.4.5.4 Rest of North America
- 5.4.6 South America
- 5.4.6.1 Argentina
- 5.4.6.2 Brazil
- 5.4.6.3 Rest of South America
6. COMPETITIVE LANDSCAPE
- 6.1 Key Strategic Moves
- 6.2 Market Share Analysis
- 6.3 Company Landscape
-
6.4 Company Profiles
- 6.4.1 Asahi Group Holdings, Ltd.
- 6.4.2 Eckes-Granini Group GmbH
- 6.4.3 Hangzhou Wahaha Group Co., Ltd.
- 6.4.4 Keurig Dr Pepper, Inc.
- 6.4.5 Monster Beverage Corporation
- 6.4.6 Nongfu Spring Co., Ltd.
- 6.4.7 PepsiCo, Inc.
- 6.4.8 Red Bull GmbH
- 6.4.9 Refresco Group BV
- 6.4.10 Suntory Holdings Limited
- 6.4.11 The Coca-Cola Company
- 6.4.12 Tingyi (Cayman Islands) Holding Corporation
- 6.4.13 Uni-President Enterprises Corp.
- *List Not Exhaustive
7. KEY STRATEGIC QUESTIONS FOR SOFT DRINK CEOS
8. APPENDIX
-
8.1 Global Overview
- 8.1.1 Overview
- 8.1.2 Porter’s Five Forces Framework
- 8.1.3 Market Dynamics (DROs)
- 8.2 Sources & References
- 8.3 List of Tables & Figures
- 8.4 Primary Insights
- 8.5 Data Pack
- 8.6 Glossary of Terms
You Can Purchase Parts Of This Report. Check Out Prices For Specific Sections
Get Price Break-up Now
List of Tables & Figures
- Figure 1:
- CONSUMER BUYING BEHAVIOUR
- Figure 2:
- INNOVATIONS
- Figure 3:
- BRAND SHARE ANALYSIS
- Figure 4:
- VOLUME OF SOFT DRINKS MARKET, LITRES, GLOBAL, 2018 - 2030
- Figure 5:
- VALUE OF SOFT DRINKS MARKET, USD, GLOBAL, 2018 - 2030
- Figure 6:
- VOLUME OF SOFT DRINKS MARKET BY SOFT DRINK CATEGORY, LITRES, GLOBAL, 2018 - 2030
- Figure 7:
- VALUE OF SOFT DRINKS MARKET BY SOFT DRINK CATEGORY, USD, GLOBAL, 2018 - 2030
- Figure 8:
- VALUE SHARE OF SOFT DRINKS MARKET SPLIT BY SOFT DRINK CATEGORY, %, GLOBAL, 2018 VS 2024 VS 2030
- Figure 9:
- VOLUME SHARE OF SOFT DRINKS MARKET SPLIT BY SOFT DRINK CATEGORY, %, GLOBAL, 2018 VS 2024 VS 2030
- Figure 10:
- VOLUME OF SOFT DRINKS MARKET BY SOFT DRINK TYPE, LITRES, GLOBAL, 2018 - 2030
- Figure 11:
- VALUE OF SOFT DRINKS MARKET BY SOFT DRINK TYPE, USD, GLOBAL, 2018 - 2030
- Figure 12:
- VALUE SHARE OF SOFT DRINKS MARKET SPLIT BY SOFT DRINK TYPE, %, GLOBAL, 2018 VS 2024 VS 2030
- Figure 13:
- VOLUME SHARE OF SOFT DRINKS MARKET SPLIT BY SOFT DRINK TYPE, %, GLOBAL, 2018 VS 2024 VS 2030
- Figure 14:
- VOLUME OF DIET COLA MARKET, LITRES, GLOBAL, 2018 - 2030
- Figure 15:
- VALUE OF DIET COLA MARKET, USD, GLOBAL, 2018 - 2030
- Figure 16:
- VALUE SHARE OF DIET COLA MARKET SPLIT BY PACKAGING TYPE, %, GLOBAL, 2023 VS 2030
- Figure 17:
- VOLUME OF FRUIT FLAVORED CARBONATES MARKET, LITRES, GLOBAL, 2018 - 2030
- Figure 18:
- VALUE OF FRUIT FLAVORED CARBONATES MARKET, USD, GLOBAL, 2018 - 2030
- Figure 19:
- VALUE SHARE OF FRUIT FLAVORED CARBONATES MARKET SPLIT BY PACKAGING TYPE, %, GLOBAL, 2023 VS 2030
- Figure 20:
- VOLUME OF STANDARD COLA MARKET, LITRES, GLOBAL, 2018 - 2030
- Figure 21:
- VALUE OF STANDARD COLA MARKET, USD, GLOBAL, 2018 - 2030
- Figure 22:
- VALUE SHARE OF STANDARD COLA MARKET SPLIT BY PACKAGING TYPE, %, GLOBAL, 2023 VS 2030
- Figure 23:
- VOLUME OF OTHER TYPES MARKET, LITRES, GLOBAL, 2018 - 2030
- Figure 24:
- VALUE OF OTHER TYPES MARKET, USD, GLOBAL, 2018 - 2030
- Figure 25:
- VALUE SHARE OF OTHER TYPES MARKET SPLIT BY PACKAGING TYPE, %, GLOBAL, 2023 VS 2030
- Figure 26:
- VOLUME OF SOFT DRINKS MARKET BY SOFT DRINK TYPE, LITRES, GLOBAL, 2018 - 2030
- Figure 27:
- VALUE OF SOFT DRINKS MARKET BY SOFT DRINK TYPE, USD, GLOBAL, 2018 - 2030
- Figure 28:
- VALUE SHARE OF SOFT DRINKS MARKET SPLIT BY SOFT DRINK TYPE, %, GLOBAL, 2018 VS 2024 VS 2030
- Figure 29:
- VOLUME SHARE OF SOFT DRINKS MARKET SPLIT BY SOFT DRINK TYPE, %, GLOBAL, 2018 VS 2024 VS 2030
- Figure 30:
- VOLUME OF ENERGY SHOTS MARKET, LITRES, GLOBAL, 2018 - 2030
- Figure 31:
- VALUE OF ENERGY SHOTS MARKET, USD, GLOBAL, 2018 - 2030
- Figure 32:
- VALUE SHARE OF ENERGY SHOTS MARKET SPLIT BY PACKAGING TYPE, %, GLOBAL, 2023 VS 2030
- Figure 33:
- VOLUME OF NATURAL/ORGANIC ENERGY DRINKS MARKET, LITRES, GLOBAL, 2018 - 2030
- Figure 34:
- VALUE OF NATURAL/ORGANIC ENERGY DRINKS MARKET, USD, GLOBAL, 2018 - 2030
- Figure 35:
- VALUE SHARE OF NATURAL/ORGANIC ENERGY DRINKS MARKET SPLIT BY PACKAGING TYPE, %, GLOBAL, 2023 VS 2030
- Figure 36:
- VOLUME OF SUGAR-FREE OR LOW-CALORIES ENERGY DRINKS MARKET, LITRES, GLOBAL, 2018 - 2030
- Figure 37:
- VALUE OF SUGAR-FREE OR LOW-CALORIES ENERGY DRINKS MARKET, USD, GLOBAL, 2018 - 2030
- Figure 38:
- VALUE SHARE OF SUGAR-FREE OR LOW-CALORIES ENERGY DRINKS MARKET SPLIT BY PACKAGING TYPE, %, GLOBAL, 2023 VS 2030
- Figure 39:
- VOLUME OF TRADITIONAL ENERGY DRINKS MARKET, LITRES, GLOBAL, 2018 - 2030
- Figure 40:
- VALUE OF TRADITIONAL ENERGY DRINKS MARKET, USD, GLOBAL, 2018 - 2030
- Figure 41:
- VALUE SHARE OF TRADITIONAL ENERGY DRINKS MARKET SPLIT BY PACKAGING TYPE, %, GLOBAL, 2023 VS 2030
- Figure 42:
- VOLUME OF OTHER ENERGY DRINKS MARKET, LITRES, GLOBAL, 2018 - 2030
- Figure 43:
- VALUE OF OTHER ENERGY DRINKS MARKET, USD, GLOBAL, 2018 - 2030
- Figure 44:
- VALUE SHARE OF OTHER ENERGY DRINKS MARKET SPLIT BY PACKAGING TYPE, %, GLOBAL, 2023 VS 2030
- Figure 45:
- VOLUME OF SOFT DRINKS MARKET BY SOFT DRINK TYPE, LITRES, GLOBAL, 2018 - 2030
- Figure 46:
- VALUE OF SOFT DRINKS MARKET BY SOFT DRINK TYPE, USD, GLOBAL, 2018 - 2030
- Figure 47:
- VALUE SHARE OF SOFT DRINKS MARKET SPLIT BY SOFT DRINK TYPE, %, GLOBAL, 2018 VS 2024 VS 2030
- Figure 48:
- VOLUME SHARE OF SOFT DRINKS MARKET SPLIT BY SOFT DRINK TYPE, %, GLOBAL, 2018 VS 2024 VS 2030
- Figure 49:
- VOLUME OF 100% JUICE MARKET, LITRES, GLOBAL, 2018 - 2030
- Figure 50:
- VALUE OF 100% JUICE MARKET, USD, GLOBAL, 2018 - 2030
- Figure 51:
- VALUE SHARE OF 100% JUICE MARKET SPLIT BY PACKAGING TYPE, %, GLOBAL, 2023 VS 2030
- Figure 52:
- VOLUME OF JUICE DRINKS (UP TO 24% JUICE) MARKET, LITRES, GLOBAL, 2018 - 2030
- Figure 53:
- VALUE OF JUICE DRINKS (UP TO 24% JUICE) MARKET, USD, GLOBAL, 2018 - 2030
- Figure 54:
- VALUE SHARE OF JUICE DRINKS (UP TO 24% JUICE) MARKET SPLIT BY PACKAGING TYPE, %, GLOBAL, 2023 VS 2030
- Figure 55:
- VOLUME OF JUICE CONCENTRATES MARKET, LITRES, GLOBAL, 2018 - 2030
- Figure 56:
- VALUE OF JUICE CONCENTRATES MARKET, USD, GLOBAL, 2018 - 2030
- Figure 57:
- VALUE SHARE OF JUICE CONCENTRATES MARKET SPLIT BY PACKAGING TYPE, %, GLOBAL, 2023 VS 2030
- Figure 58:
- VOLUME OF NECTARS (25-99% JUICE) MARKET, LITRES, GLOBAL, 2018 - 2030
- Figure 59:
- VALUE OF NECTARS (25-99% JUICE) MARKET, USD, GLOBAL, 2018 - 2030
- Figure 60:
- VALUE SHARE OF NECTARS (25-99% JUICE) MARKET SPLIT BY PACKAGING TYPE, %, GLOBAL, 2023 VS 2030
- Figure 61:
- VOLUME OF SOFT DRINKS MARKET BY SOFT DRINK TYPE, LITRES, GLOBAL, 2018 - 2030
- Figure 62:
- VALUE OF SOFT DRINKS MARKET BY SOFT DRINK TYPE, USD, GLOBAL, 2018 - 2030
- Figure 63:
- VALUE SHARE OF SOFT DRINKS MARKET SPLIT BY SOFT DRINK TYPE, %, GLOBAL, 2018 VS 2024 VS 2030
- Figure 64:
- VOLUME SHARE OF SOFT DRINKS MARKET SPLIT BY SOFT DRINK TYPE, %, GLOBAL, 2018 VS 2024 VS 2030
- Figure 65:
- VOLUME OF COLD BREW COFFEE MARKET, LITRES, GLOBAL, 2018 - 2030
- Figure 66:
- VALUE OF COLD BREW COFFEE MARKET, USD, GLOBAL, 2018 - 2030
- Figure 67:
- VALUE SHARE OF COLD BREW COFFEE MARKET SPLIT BY PACKAGING TYPE, %, GLOBAL, 2023 VS 2030
- Figure 68:
- VOLUME OF ICED COFFEE MARKET, LITRES, GLOBAL, 2018 - 2030
- Figure 69:
- VALUE OF ICED COFFEE MARKET, USD, GLOBAL, 2018 - 2030
- Figure 70:
- VALUE SHARE OF ICED COFFEE MARKET SPLIT BY PACKAGING TYPE, %, GLOBAL, 2023 VS 2030
- Figure 71:
- VOLUME OF OTHER RTD COFFEE MARKET, LITRES, GLOBAL, 2018 - 2030
- Figure 72:
- VALUE OF OTHER RTD COFFEE MARKET, USD, GLOBAL, 2018 - 2030
- Figure 73:
- VALUE SHARE OF OTHER RTD COFFEE MARKET SPLIT BY PACKAGING TYPE, %, GLOBAL, 2023 VS 2030
- Figure 74:
- VOLUME OF SOFT DRINKS MARKET BY SOFT DRINK TYPE, LITRES, GLOBAL, 2018 - 2030
- Figure 75:
- VALUE OF SOFT DRINKS MARKET BY SOFT DRINK TYPE, USD, GLOBAL, 2018 - 2030
- Figure 76:
- VALUE SHARE OF SOFT DRINKS MARKET SPLIT BY SOFT DRINK TYPE, %, GLOBAL, 2018 VS 2024 VS 2030
- Figure 77:
- VOLUME SHARE OF SOFT DRINKS MARKET SPLIT BY SOFT DRINK TYPE, %, GLOBAL, 2018 VS 2024 VS 2030
- Figure 78:
- VOLUME OF GREEN TEA MARKET, LITRES, GLOBAL, 2018 - 2030
- Figure 79:
- VALUE OF GREEN TEA MARKET, USD, GLOBAL, 2018 - 2030
- Figure 80:
- VALUE SHARE OF GREEN TEA MARKET SPLIT BY PACKAGING TYPE, %, GLOBAL, 2023 VS 2030
- Figure 81:
- VOLUME OF HERBAL TEA MARKET, LITRES, GLOBAL, 2018 - 2030
- Figure 82:
- VALUE OF HERBAL TEA MARKET, USD, GLOBAL, 2018 - 2030
- Figure 83:
- VALUE SHARE OF HERBAL TEA MARKET SPLIT BY PACKAGING TYPE, %, GLOBAL, 2023 VS 2030
- Figure 84:
- VOLUME OF ICED TEA MARKET, LITRES, GLOBAL, 2018 - 2030
- Figure 85:
- VALUE OF ICED TEA MARKET, USD, GLOBAL, 2018 - 2030
- Figure 86:
- VALUE SHARE OF ICED TEA MARKET SPLIT BY PACKAGING TYPE, %, GLOBAL, 2023 VS 2030
- Figure 87:
- VOLUME OF OTHER RTD TEA MARKET, LITRES, GLOBAL, 2018 - 2030
- Figure 88:
- VALUE OF OTHER RTD TEA MARKET, USD, GLOBAL, 2018 - 2030
- Figure 89:
- VALUE SHARE OF OTHER RTD TEA MARKET SPLIT BY PACKAGING TYPE, %, GLOBAL, 2023 VS 2030
- Figure 90:
- VOLUME OF SOFT DRINKS MARKET BY SOFT DRINK TYPE, LITRES, GLOBAL, 2018 - 2030
- Figure 91:
- VALUE OF SOFT DRINKS MARKET BY SOFT DRINK TYPE, USD, GLOBAL, 2018 - 2030
- Figure 92:
- VALUE SHARE OF SOFT DRINKS MARKET SPLIT BY SOFT DRINK TYPE, %, GLOBAL, 2018 VS 2024 VS 2030
- Figure 93:
- VOLUME SHARE OF SOFT DRINKS MARKET SPLIT BY SOFT DRINK TYPE, %, GLOBAL, 2018 VS 2024 VS 2030
- Figure 94:
- VOLUME OF ELECTROLYTE-ENHANCED WATER MARKET, LITRES, GLOBAL, 2018 - 2030
- Figure 95:
- VALUE OF ELECTROLYTE-ENHANCED WATER MARKET, USD, GLOBAL, 2018 - 2030
- Figure 96:
- VALUE SHARE OF ELECTROLYTE-ENHANCED WATER MARKET SPLIT BY PACKAGING TYPE, %, GLOBAL, 2023 VS 2030
- Figure 97:
- VOLUME OF HYPERTONIC MARKET, LITRES, GLOBAL, 2018 - 2030
- Figure 98:
- VALUE OF HYPERTONIC MARKET, USD, GLOBAL, 2018 - 2030
- Figure 99:
- VALUE SHARE OF HYPERTONIC MARKET SPLIT BY PACKAGING TYPE, %, GLOBAL, 2023 VS 2030
- Figure 100:
- VOLUME OF HYPOTONIC MARKET, LITRES, GLOBAL, 2018 - 2030
- Figure 101:
- VALUE OF HYPOTONIC MARKET, USD, GLOBAL, 2018 - 2030
- Figure 102:
- VALUE SHARE OF HYPOTONIC MARKET SPLIT BY PACKAGING TYPE, %, GLOBAL, 2023 VS 2030
- Figure 103:
- VOLUME OF ISOTONIC MARKET, LITRES, GLOBAL, 2018 - 2030
- Figure 104:
- VALUE OF ISOTONIC MARKET, USD, GLOBAL, 2018 - 2030
- Figure 105:
- VALUE SHARE OF ISOTONIC MARKET SPLIT BY PACKAGING TYPE, %, GLOBAL, 2023 VS 2030
- Figure 106:
- VOLUME OF PROTEIN-BASED SPORT DRINKS MARKET, LITRES, GLOBAL, 2018 - 2030
- Figure 107:
- VALUE OF PROTEIN-BASED SPORT DRINKS MARKET, USD, GLOBAL, 2018 - 2030
- Figure 108:
- VALUE SHARE OF PROTEIN-BASED SPORT DRINKS MARKET SPLIT BY PACKAGING TYPE, %, GLOBAL, 2023 VS 2030
- Figure 109:
- VOLUME OF SOFT DRINKS MARKET BY PACKAGING TYPE, LITRES, GLOBAL, 2018 - 2030
- Figure 110:
- VALUE OF SOFT DRINKS MARKET BY PACKAGING TYPE, USD, GLOBAL, 2018 - 2030
- Figure 111:
- VALUE SHARE OF SOFT DRINKS MARKET SPLIT BY PACKAGING TYPE, %, GLOBAL, 2018 VS 2024 VS 2030
- Figure 112:
- VOLUME SHARE OF SOFT DRINKS MARKET SPLIT BY PACKAGING TYPE, %, GLOBAL, 2018 VS 2024 VS 2030
- Figure 113:
- VOLUME OF SOFT DRINKS MARKET SOLD VIA ASEPTIC PACKAGES, LITRES, GLOBAL, 2018 - 2030
- Figure 114:
- VALUE OF SOFT DRINKS MARKET SOLD VIA ASEPTIC PACKAGES, USD, GLOBAL, 2018 - 2030
- Figure 115:
- VALUE SHARE OF SOFT DRINKS MARKET SOLD VIA ASEPTIC PACKAGES, SPLIT BY SOFT DRINK CATEGORY %, GLOBAL, 2023 VS 2030
- Figure 116:
- VOLUME OF SOFT DRINKS MARKET SOLD VIA DISPOSABLE CUPS, LITRES, GLOBAL, 2018 - 2030
- Figure 117:
- VALUE OF SOFT DRINKS MARKET SOLD VIA DISPOSABLE CUPS, USD, GLOBAL, 2018 - 2030
- Figure 118:
- VALUE SHARE OF SOFT DRINKS MARKET SOLD VIA DISPOSABLE CUPS, SPLIT BY SOFT DRINK CATEGORY %, GLOBAL, 2023 VS 2030
- Figure 119:
- VOLUME OF SOFT DRINKS MARKET SOLD VIA GLASS BOTTLES, LITRES, GLOBAL, 2018 - 2030
- Figure 120:
- VALUE OF SOFT DRINKS MARKET SOLD VIA GLASS BOTTLES, USD, GLOBAL, 2018 - 2030
- Figure 121:
- VALUE SHARE OF SOFT DRINKS MARKET SOLD VIA GLASS BOTTLES, SPLIT BY SOFT DRINK CATEGORY %, GLOBAL, 2023 VS 2030
- Figure 122:
- VOLUME OF SOFT DRINKS MARKET SOLD VIA METAL CAN, LITRES, GLOBAL, 2018 - 2030
- Figure 123:
- VALUE OF SOFT DRINKS MARKET SOLD VIA METAL CAN, USD, GLOBAL, 2018 - 2030
- Figure 124:
- VALUE SHARE OF SOFT DRINKS MARKET SOLD VIA METAL CAN, SPLIT BY SOFT DRINK CATEGORY %, GLOBAL, 2023 VS 2030
- Figure 125:
- VOLUME OF SOFT DRINKS MARKET SOLD VIA PET BOTTLES, LITRES, GLOBAL, 2018 - 2030
- Figure 126:
- VALUE OF SOFT DRINKS MARKET SOLD VIA PET BOTTLES, USD, GLOBAL, 2018 - 2030
- Figure 127:
- VALUE SHARE OF SOFT DRINKS MARKET SOLD VIA PET BOTTLES, SPLIT BY SOFT DRINK CATEGORY %, GLOBAL, 2023 VS 2030
- Figure 128:
- VOLUME OF SOFT DRINKS MARKET BY DISTRIBUTION CHANNEL, LITRES, GLOBAL, 2018 - 2030
- Figure 129:
- VALUE OF SOFT DRINKS MARKET BY DISTRIBUTION CHANNEL, USD, GLOBAL, 2018 - 2030
- Figure 130:
- VALUE SHARE OF SOFT DRINKS MARKET SPLIT BY DISTRIBUTION CHANNEL, %, GLOBAL, 2018 VS 2024 VS 2030
- Figure 131:
- VOLUME SHARE OF SOFT DRINKS MARKET SPLIT BY DISTRIBUTION CHANNEL, %, GLOBAL, 2018 VS 2024 VS 2030
- Figure 132:
- VOLUME OF SOFT DRINKS MARKET SOLD VIA OFF-TRADE CHANNELS, LITRES, GLOBAL, 2018 - 2030
- Figure 133:
- VALUE OF SOFT DRINKS MARKET SOLD VIA OFF-TRADE CHANNELS, USD, GLOBAL, 2018 - 2030
- Figure 134:
- VALUE SHARE OF SOFT DRINKS MARKET SOLD VIA OFF-TRADE CHANNELS, %, GLOBAL, 2018 VS 2024 VS 2030
- Figure 135:
- VOLUME SHARE OF SOFT DRINKS MARKET SOLD VIA OFF-TRADE CHANNELS, %, GLOBAL, 2018 VS 2024 VS 2030
- Figure 136:
- VOLUME OF SOFT DRINKS MARKET SOLD VIA CONVENIENCE STORES, LITRES, GLOBAL, 2018 - 2030
- Figure 137:
- VALUE OF SOFT DRINKS MARKET SOLD VIA CONVENIENCE STORES, USD, GLOBAL, 2018 - 2030
- Figure 138:
- VALUE SHARE OF SOFT DRINKS MARKET SOLD VIA CONVENIENCE STORES SPLIT BY SOFT DRINK CATEGORY, %, GLOBAL, 2023 VS 2030
- Figure 139:
- VOLUME OF SOFT DRINKS MARKET SOLD VIA ONLINE RETAIL, LITRES, GLOBAL, 2018 - 2030
- Figure 140:
- VALUE OF SOFT DRINKS MARKET SOLD VIA ONLINE RETAIL, USD, GLOBAL, 2018 - 2030
- Figure 141:
- VALUE SHARE OF SOFT DRINKS MARKET SOLD VIA ONLINE RETAIL SPLIT BY SOFT DRINK CATEGORY, %, GLOBAL, 2023 VS 2030
- Figure 142:
- VOLUME OF SOFT DRINKS MARKET SOLD VIA SPECIALTY STORES, LITRES, GLOBAL, 2018 - 2030
- Figure 143:
- VALUE OF SOFT DRINKS MARKET SOLD VIA SPECIALTY STORES, USD, GLOBAL, 2018 - 2030
- Figure 144:
- VALUE SHARE OF SOFT DRINKS MARKET SOLD VIA SPECIALTY STORES SPLIT BY SOFT DRINK CATEGORY, %, GLOBAL, 2023 VS 2030
- Figure 145:
- VOLUME OF SOFT DRINKS MARKET SOLD VIA SUPERMARKET/HYPERMARKET, LITRES, GLOBAL, 2018 - 2030
- Figure 146:
- VALUE OF SOFT DRINKS MARKET SOLD VIA SUPERMARKET/HYPERMARKET, USD, GLOBAL, 2018 - 2030
- Figure 147:
- VALUE SHARE OF SOFT DRINKS MARKET SOLD VIA SUPERMARKET/HYPERMARKET SPLIT BY SOFT DRINK CATEGORY, %, GLOBAL, 2023 VS 2030
- Figure 148:
- VOLUME OF SOFT DRINKS MARKET SOLD VIA OTHER DISTRIBUTION CHANNEL, LITRES, GLOBAL, 2018 - 2030
- Figure 149:
- VALUE OF SOFT DRINKS MARKET SOLD VIA OTHER DISTRIBUTION CHANNEL, USD, GLOBAL, 2018 - 2030
- Figure 150:
- VALUE SHARE OF SOFT DRINKS MARKET SOLD VIA OTHERS SPLIT BY SOFT DRINK CATEGORY, %, GLOBAL, 2023 VS 2030
- Figure 151:
- VOLUME OF SOFT DRINKS MARKET SOLD VIA ON-TRADE CHANNEL, LITRES, GLOBAL, 2018 - 2030
- Figure 152:
- VALUE OF SOFT DRINKS MARKET SOLD VIA ON-TRADE CHANNEL, USD, GLOBAL, 2018 - 2030
- Figure 153:
- VALUE SHARE OF SOFT DRINKS MARKET SOLD VIA ON-TRADE CHANNEL, SPLIT BY SOFT DRINK CATEGORY, %, GLOBAL, 2023 VS 2030
- Figure 154:
- VOLUME OF SOFT DRINKS MARKET BY REGION, LITRES, GLOBAL, 2018 - 2030
- Figure 155:
- VALUE OF SOFT DRINKS MARKET BY REGION, USD, GLOBAL, 2018 - 2030
- Figure 156:
- VALUE SHARE OF SOFT DRINKS MARKET SPLIT BY REGION, %, GLOBAL, 2018 VS 2024 VS 2030
- Figure 157:
- VOLUME SHARE OF SOFT DRINKS MARKET SPLIT BY REGION, %, GLOBAL, 2018 VS 2024 VS 2030
- Figure 158:
- VOLUME OF SOFT DRINKS MARKET BY COUNTRY, LITRES, AFRICA, 2018 - 2030
- Figure 159:
- VALUE OF SOFT DRINKS MARKET BY COUNTRY, USD, AFRICA, 2018 - 2030
- Figure 160:
- VALUE SHARE OF SOFT DRINKS MARKET SPLIT BY COUNTRY, %, AFRICA, 2018 VS 2024 VS 2030
- Figure 161:
- VOLUME SHARE OF SOFT DRINKS MARKET SPLIT BY COUNTRY, %, AFRICA, 2018 VS 2024 VS 2030
- Figure 162:
- VOLUME OF SOFT DRINK MARKET, LITRES, EGYPT, 2018 - 2030
- Figure 163:
- VALUE OF SOFT DRINK MARKET, USD, EGYPT, 2018 - 2030
- Figure 164:
- VALUE SHARE OF SOFT DRINKS MARKET SPLIT BY SUB DISTRIBUTION CHANNEL, %, EGYPT, 2023 VS 2030
- Figure 165:
- VOLUME OF SOFT DRINK MARKET, LITRES, NIGERIA, 2018 - 2030
- Figure 166:
- VALUE OF SOFT DRINK MARKET, USD, NIGERIA, 2018 - 2030
- Figure 167:
- VALUE SHARE OF SOFT DRINKS MARKET SPLIT BY SUB DISTRIBUTION CHANNEL, %, NIGERIA, 2023 VS 2030
- Figure 168:
- VOLUME OF SOFT DRINK MARKET, LITRES, SOUTH AFRICA, 2018 - 2030
- Figure 169:
- VALUE OF SOFT DRINK MARKET, USD, SOUTH AFRICA, 2018 - 2030
- Figure 170:
- VALUE SHARE OF SOFT DRINKS MARKET SPLIT BY SUB DISTRIBUTION CHANNEL, %, SOUTH AFRICA, 2023 VS 2030
- Figure 171:
- VOLUME OF SOFT DRINK MARKET, LITRES, REST OF AFRICA, 2018 - 2030
- Figure 172:
- VALUE OF SOFT DRINK MARKET, USD, REST OF AFRICA, 2018 - 2030
- Figure 173:
- VALUE SHARE OF SOFT DRINKS MARKET SPLIT BY SUB DISTRIBUTION CHANNEL, %, REST OF AFRICA, 2023 VS 2030
- Figure 174:
- VOLUME OF SOFT DRINKS MARKET BY COUNTRY, LITRES, ASIA-PACIFIC, 2018 - 2030
- Figure 175:
- VALUE OF SOFT DRINKS MARKET BY COUNTRY, USD, ASIA-PACIFIC, 2018 - 2030
- Figure 176:
- VALUE SHARE OF SOFT DRINKS MARKET SPLIT BY COUNTRY, %, ASIA-PACIFIC, 2018 VS 2024 VS 2030
- Figure 177:
- VOLUME SHARE OF SOFT DRINKS MARKET SPLIT BY COUNTRY, %, ASIA-PACIFIC, 2018 VS 2024 VS 2030
- Figure 178:
- VOLUME OF SOFT DRINK MARKET, LITRES, AUSTRALIA, 2018 - 2030
- Figure 179:
- VALUE OF SOFT DRINK MARKET, USD, AUSTRALIA, 2018 - 2030
- Figure 180:
- VALUE SHARE OF SOFT DRINKS MARKET SPLIT BY SUB DISTRIBUTION CHANNEL, %, AUSTRALIA, 2023 VS 2030
- Figure 181:
- VOLUME OF SOFT DRINK MARKET, LITRES, CHINA, 2018 - 2030
- Figure 182:
- VALUE OF SOFT DRINK MARKET, USD, CHINA, 2018 - 2030
- Figure 183:
- VALUE SHARE OF SOFT DRINKS MARKET SPLIT BY SUB DISTRIBUTION CHANNEL, %, CHINA, 2023 VS 2030
- Figure 184:
- VOLUME OF SOFT DRINK MARKET, LITRES, INDIA, 2018 - 2030
- Figure 185:
- VALUE OF SOFT DRINK MARKET, USD, INDIA, 2018 - 2030
- Figure 186:
- VALUE SHARE OF SOFT DRINKS MARKET SPLIT BY SUB DISTRIBUTION CHANNEL, %, INDIA, 2023 VS 2030
- Figure 187:
- VOLUME OF SOFT DRINK MARKET, LITRES, INDONESIA, 2018 - 2030
- Figure 188:
- VALUE OF SOFT DRINK MARKET, USD, INDONESIA, 2018 - 2030
- Figure 189:
- VALUE SHARE OF SOFT DRINKS MARKET SPLIT BY SUB DISTRIBUTION CHANNEL, %, INDONESIA, 2023 VS 2030
- Figure 190:
- VOLUME OF SOFT DRINK MARKET, LITRES, JAPAN, 2018 - 2030
- Figure 191:
- VALUE OF SOFT DRINK MARKET, USD, JAPAN, 2018 - 2030
- Figure 192:
- VALUE SHARE OF SOFT DRINKS MARKET SPLIT BY SUB DISTRIBUTION CHANNEL, %, JAPAN, 2023 VS 2030
- Figure 193:
- VOLUME OF SOFT DRINK MARKET, LITRES, MALAYSIA, 2018 - 2030
- Figure 194:
- VALUE OF SOFT DRINK MARKET, USD, MALAYSIA, 2018 - 2030
- Figure 195:
- VALUE SHARE OF SOFT DRINKS MARKET SPLIT BY SUB DISTRIBUTION CHANNEL, %, MALAYSIA, 2023 VS 2030
- Figure 196:
- VOLUME OF SOFT DRINK MARKET, LITRES, SOUTH KOREA, 2018 - 2030
- Figure 197:
- VALUE OF SOFT DRINK MARKET, USD, SOUTH KOREA, 2018 - 2030
- Figure 198:
- VALUE SHARE OF SOFT DRINKS MARKET SPLIT BY SUB DISTRIBUTION CHANNEL, %, SOUTH KOREA, 2023 VS 2030
- Figure 199:
- VOLUME OF SOFT DRINK MARKET, LITRES, THAILAND, 2018 - 2030
- Figure 200:
- VALUE OF SOFT DRINK MARKET, USD, THAILAND, 2018 - 2030
- Figure 201:
- VALUE SHARE OF SOFT DRINKS MARKET SPLIT BY SUB DISTRIBUTION CHANNEL, %, THAILAND, 2023 VS 2030
- Figure 202:
- VOLUME OF SOFT DRINK MARKET, LITRES, VIETNAM, 2018 - 2030
- Figure 203:
- VALUE OF SOFT DRINK MARKET, USD, VIETNAM, 2018 - 2030
- Figure 204:
- VALUE SHARE OF SOFT DRINKS MARKET SPLIT BY SUB DISTRIBUTION CHANNEL, %, VIETNAM, 2023 VS 2030
- Figure 205:
- VOLUME OF SOFT DRINK MARKET, LITRES, REST OF ASIA-PACIFIC, 2018 - 2030
- Figure 206:
- VALUE OF SOFT DRINK MARKET, USD, REST OF ASIA-PACIFIC, 2018 - 2030
- Figure 207:
- VALUE SHARE OF SOFT DRINKS MARKET SPLIT BY SUB DISTRIBUTION CHANNEL, %, REST OF ASIA-PACIFIC, 2023 VS 2030
- Figure 208:
- VOLUME OF SOFT DRINKS MARKET BY COUNTRY, LITRES, EUROPE, 2018 - 2030
- Figure 209:
- VALUE OF SOFT DRINKS MARKET BY COUNTRY, USD, EUROPE, 2018 - 2030
- Figure 210:
- VALUE SHARE OF SOFT DRINKS MARKET SPLIT BY COUNTRY, %, EUROPE, 2018 VS 2024 VS 2030
- Figure 211:
- VOLUME SHARE OF SOFT DRINKS MARKET SPLIT BY COUNTRY, %, EUROPE, 2018 VS 2024 VS 2030
- Figure 212:
- VOLUME OF SOFT DRINK MARKET, LITRES, BELGIUM, 2018 - 2030
- Figure 213:
- VALUE OF SOFT DRINK MARKET, USD, BELGIUM, 2018 - 2030
- Figure 214:
- VALUE SHARE OF SOFT DRINKS MARKET SPLIT BY SUB DISTRIBUTION CHANNEL, %, BELGIUM, 2023 VS 2030
- Figure 215:
- VOLUME OF SOFT DRINK MARKET, LITRES, FRANCE, 2018 - 2030
- Figure 216:
- VALUE OF SOFT DRINK MARKET, USD, FRANCE, 2018 - 2030
- Figure 217:
- VALUE SHARE OF SOFT DRINKS MARKET SPLIT BY SUB DISTRIBUTION CHANNEL, %, FRANCE, 2023 VS 2030
- Figure 218:
- VOLUME OF SOFT DRINK MARKET, LITRES, GERMANY, 2018 - 2030
- Figure 219:
- VALUE OF SOFT DRINK MARKET, USD, GERMANY, 2018 - 2030
- Figure 220:
- VALUE SHARE OF SOFT DRINKS MARKET SPLIT BY SUB DISTRIBUTION CHANNEL, %, GERMANY, 2023 VS 2030
- Figure 221:
- VOLUME OF SOFT DRINK MARKET, LITRES, ITALY, 2018 - 2030
- Figure 222:
- VALUE OF SOFT DRINK MARKET, USD, ITALY, 2018 - 2030
- Figure 223:
- VALUE SHARE OF SOFT DRINKS MARKET SPLIT BY SUB DISTRIBUTION CHANNEL, %, ITALY, 2023 VS 2030
- Figure 224:
- VOLUME OF SOFT DRINK MARKET, LITRES, NETHERLANDS, 2018 - 2030
- Figure 225:
- VALUE OF SOFT DRINK MARKET, USD, NETHERLANDS, 2018 - 2030
- Figure 226:
- VALUE SHARE OF SOFT DRINKS MARKET SPLIT BY SUB DISTRIBUTION CHANNEL, %, NETHERLANDS, 2023 VS 2030
- Figure 227:
- VOLUME OF SOFT DRINK MARKET, LITRES, RUSSIA, 2018 - 2030
- Figure 228:
- VALUE OF SOFT DRINK MARKET, USD, RUSSIA, 2018 - 2030
- Figure 229:
- VALUE SHARE OF SOFT DRINKS MARKET SPLIT BY SUB DISTRIBUTION CHANNEL, %, RUSSIA, 2023 VS 2030
- Figure 230:
- VOLUME OF SOFT DRINK MARKET, LITRES, SPAIN, 2018 - 2030
- Figure 231:
- VALUE OF SOFT DRINK MARKET, USD, SPAIN, 2018 - 2030
- Figure 232:
- VALUE SHARE OF SOFT DRINKS MARKET SPLIT BY SUB DISTRIBUTION CHANNEL, %, SPAIN, 2023 VS 2030
- Figure 233:
- VOLUME OF SOFT DRINK MARKET, LITRES, TURKEY, 2018 - 2030
- Figure 234:
- VALUE OF SOFT DRINK MARKET, USD, TURKEY, 2018 - 2030
- Figure 235:
- VALUE SHARE OF SOFT DRINKS MARKET SPLIT BY SUB DISTRIBUTION CHANNEL, %, TURKEY, 2023 VS 2030
- Figure 236:
- VOLUME OF SOFT DRINK MARKET, LITRES, UNITED KINGDOM, 2018 - 2030
- Figure 237:
- VALUE OF SOFT DRINK MARKET, USD, UNITED KINGDOM, 2018 - 2030
- Figure 238:
- VALUE SHARE OF SOFT DRINKS MARKET SPLIT BY SUB DISTRIBUTION CHANNEL, %, UNITED KINGDOM, 2023 VS 2030
- Figure 239:
- VOLUME OF SOFT DRINK MARKET, LITRES, REST OF EUROPE, 2018 - 2030
- Figure 240:
- VALUE OF SOFT DRINK MARKET, USD, REST OF EUROPE, 2018 - 2030
- Figure 241:
- VALUE SHARE OF SOFT DRINKS MARKET SPLIT BY SUB DISTRIBUTION CHANNEL, %, REST OF EUROPE, 2023 VS 2030
- Figure 242:
- VOLUME OF SOFT DRINKS MARKET BY COUNTRY, LITRES, MIDDLE EAST, 2018 - 2030
- Figure 243:
- VALUE OF SOFT DRINKS MARKET BY COUNTRY, USD, MIDDLE EAST, 2018 - 2030
- Figure 244:
- VALUE SHARE OF SOFT DRINKS MARKET SPLIT BY COUNTRY, %, MIDDLE EAST, 2018 VS 2024 VS 2030
- Figure 245:
- VOLUME SHARE OF SOFT DRINKS MARKET SPLIT BY COUNTRY, %, MIDDLE EAST, 2018 VS 2024 VS 2030
- Figure 246:
- VOLUME OF SOFT DRINK MARKET, LITRES, QATAR, 2018 - 2030
- Figure 247:
- VALUE OF SOFT DRINK MARKET, USD, QATAR, 2018 - 2030
- Figure 248:
- VALUE SHARE OF SOFT DRINKS MARKET SPLIT BY SUB DISTRIBUTION CHANNEL, %, QATAR, 2023 VS 2030
- Figure 249:
- VOLUME OF SOFT DRINK MARKET, LITRES, SAUDI ARABIA, 2018 - 2030
- Figure 250:
- VALUE OF SOFT DRINK MARKET, USD, SAUDI ARABIA, 2018 - 2030
- Figure 251:
- VALUE SHARE OF SOFT DRINKS MARKET SPLIT BY SUB DISTRIBUTION CHANNEL, %, SAUDI ARABIA, 2023 VS 2030
- Figure 252:
- VOLUME OF SOFT DRINK MARKET, LITRES, UNITED ARAB EMIRATES, 2018 - 2030
- Figure 253:
- VALUE OF SOFT DRINK MARKET, USD, UNITED ARAB EMIRATES, 2018 - 2030
- Figure 254:
- VALUE SHARE OF SOFT DRINKS MARKET SPLIT BY SUB DISTRIBUTION CHANNEL, %, UNITED ARAB EMIRATES, 2023 VS 2030
- Figure 255:
- VOLUME OF SOFT DRINK MARKET, LITRES, REST OF MIDDLE EAST, 2018 - 2030
- Figure 256:
- VALUE OF SOFT DRINK MARKET, USD, REST OF MIDDLE EAST, 2018 - 2030
- Figure 257:
- VALUE SHARE OF SOFT DRINKS MARKET SPLIT BY SUB DISTRIBUTION CHANNEL, %, REST OF MIDDLE EAST, 2023 VS 2030
- Figure 258:
- VOLUME OF SOFT DRINKS MARKET BY COUNTRY, LITRES, NORTH AMERICA, 2018 - 2030
- Figure 259:
- VALUE OF SOFT DRINKS MARKET BY COUNTRY, USD, NORTH AMERICA, 2018 - 2030
- Figure 260:
- VALUE SHARE OF SOFT DRINKS MARKET SPLIT BY COUNTRY, %, NORTH AMERICA, 2018 VS 2024 VS 2030
- Figure 261:
- VOLUME SHARE OF SOFT DRINKS MARKET SPLIT BY COUNTRY, %, NORTH AMERICA, 2018 VS 2024 VS 2030
- Figure 262:
- VOLUME OF SOFT DRINK MARKET, LITRES, CANADA, 2018 - 2030
- Figure 263:
- VALUE OF SOFT DRINK MARKET, USD, CANADA, 2018 - 2030
- Figure 264:
- VALUE SHARE OF SOFT DRINKS MARKET SPLIT BY SUB DISTRIBUTION CHANNEL, %, CANADA, 2023 VS 2030
- Figure 265:
- VOLUME OF SOFT DRINK MARKET, LITRES, MEXICO, 2018 - 2030
- Figure 266:
- VALUE OF SOFT DRINK MARKET, USD, MEXICO, 2018 - 2030
- Figure 267:
- VALUE SHARE OF SOFT DRINKS MARKET SPLIT BY SUB DISTRIBUTION CHANNEL, %, MEXICO, 2023 VS 2030
- Figure 268:
- VOLUME OF SOFT DRINK MARKET, LITRES, UNITED STATES, 2018 - 2030
- Figure 269:
- VALUE OF SOFT DRINK MARKET, USD, UNITED STATES, 2018 - 2030
- Figure 270:
- VALUE SHARE OF SOFT DRINKS MARKET SPLIT BY SUB DISTRIBUTION CHANNEL, %, UNITED STATES, 2023 VS 2030
- Figure 271:
- VOLUME OF SOFT DRINK MARKET, LITRES, REST OF NORTH AMERICA, 2018 - 2030
- Figure 272:
- VALUE OF SOFT DRINK MARKET, USD, REST OF NORTH AMERICA, 2018 - 2030
- Figure 273:
- VALUE SHARE OF SOFT DRINKS MARKET SPLIT BY SUB DISTRIBUTION CHANNEL, %, REST OF NORTH AMERICA, 2023 VS 2030
- Figure 274:
- VOLUME OF SOFT DRINKS MARKET BY COUNTRY, LITRES, SOUTH AMERICA, 2018 - 2030
- Figure 275:
- VALUE OF SOFT DRINKS MARKET BY COUNTRY, USD, SOUTH AMERICA, 2018 - 2030
- Figure 276:
- VALUE SHARE OF SOFT DRINKS MARKET SPLIT BY COUNTRY, %, SOUTH AMERICA, 2018 VS 2024 VS 2030
- Figure 277:
- VOLUME SHARE OF SOFT DRINKS MARKET SPLIT BY COUNTRY, %, SOUTH AMERICA, 2018 VS 2024 VS 2030
- Figure 278:
- VOLUME OF SOFT DRINK MARKET, LITRES, ARGENTINA, 2018 - 2030
- Figure 279:
- VALUE OF SOFT DRINK MARKET, USD, ARGENTINA, 2018 - 2030
- Figure 280:
- VALUE SHARE OF SOFT DRINKS MARKET SPLIT BY SUB DISTRIBUTION CHANNEL, %, ARGENTINA, 2023 VS 2030
- Figure 281:
- VOLUME OF SOFT DRINK MARKET, LITRES, BRAZIL, 2018 - 2030
- Figure 282:
- VALUE OF SOFT DRINK MARKET, USD, BRAZIL, 2018 - 2030
- Figure 283:
- VALUE SHARE OF SOFT DRINKS MARKET SPLIT BY SUB DISTRIBUTION CHANNEL, %, BRAZIL, 2023 VS 2030
- Figure 284:
- VOLUME OF SOFT DRINK MARKET, LITRES, REST OF SOUTH AMERICA, 2018 - 2030
- Figure 285:
- VALUE OF SOFT DRINK MARKET, USD, REST OF SOUTH AMERICA, 2018 - 2030
- Figure 286:
- VALUE SHARE OF SOFT DRINKS MARKET SPLIT BY SUB DISTRIBUTION CHANNEL, %, REST OF SOUTH AMERICA, 2023 VS 2030
- Figure 287:
- MOST ACTIVE COMPANIES BY NUMBER OF STRATEGIC MOVES, COUNT, GLOBAL, 2020 - 2023
- Figure 288:
- MOST ADOPTED STRATEGIES, COUNT, GLOBAL, 2020 - 2023
- Figure 289:
- VALUE SHARE OF MAJOR PLAYERS, %, GLOBAL
Soft Drinks Industry Segmentation
Carbonated Soft Drinks, Energy Drinks, Juices, RTD Coffee, RTD Tea, Sport Drinks are covered as segments by Soft Drink Category. Aseptic packages, Disposable Cups, Glass Bottles, Metal Can, PET Bottles are covered as segments by Packaging Type. Off-trade, On-trade are covered as segments by Distribution Channel. Africa, Asia-Pacific, Europe, Middle East, North America, South America are covered as segments by Region.| Soft Drink Category | Carbonated Soft Drinks | By Soft Drink Type | Diet Cola | |
| Fruit Flavored Carbonates | ||||
| Standard Cola | ||||
| Other Types | ||||
| Energy Drinks | By Soft Drink Type | Energy Shots | ||
| Natural/Organic Energy Drinks | ||||
| Sugar-free or Low-calories Energy Drinks | ||||
| Traditional Energy Drinks | ||||
| Other Energy Drinks | ||||
| Juices | By Soft Drink Type | 100% Juice | ||
| Juice Drinks (up to 24% Juice) | ||||
| Juice concentrates | ||||
| Nectars (25-99% Juice) | ||||
| RTD Coffee | By Soft Drink Type | Cold Brew Coffee | ||
| Iced coffee | ||||
| Other RTD Coffee | ||||
| RTD Tea | By Soft Drink Type | Green Tea | ||
| Herbal Tea | ||||
| Iced Tea | ||||
| Other RTD Tea | ||||
| Sport Drinks | By Soft Drink Type | Electrolyte-Enhanced Water | ||
| Hypertonic | ||||
| Hypotonic | ||||
| Isotonic | ||||
| Protein-based Sport Drinks | ||||
| Packaging Type | Aseptic packages | |||
| Disposable Cups | ||||
| Glass Bottles | ||||
| Metal Can | ||||
| PET Bottles | ||||
| Distribution Channel | Off-trade | Convenience Stores | ||
| Online Retail | ||||
| Specialty Stores | ||||
| Supermarket/Hypermarket | ||||
| Others | ||||
| On-trade | ||||
| Region | Africa | Egypt | ||
| Nigeria | ||||
| South Africa | ||||
| Rest of Africa | ||||
| Asia-Pacific | Australia | |||
| China | ||||
| India | ||||
| Indonesia | ||||
| Japan | ||||
| Malaysia | ||||
| South Korea | ||||
| Thailand | ||||
| Vietnam | ||||
| Rest of Asia-Pacific | ||||
| Europe | Belgium | |||
| France | ||||
| Germany | ||||
| Italy | ||||
| Netherlands | ||||
| Russia | ||||
| Spain | ||||
| Turkey | ||||
| United Kingdom | ||||
| Rest of Europe | ||||
| Middle East | Qatar | |||
| Saudi Arabia | ||||
| United Arab Emirates | ||||
| Rest of Middle East | ||||
| North America | Canada | |||
| Mexico | ||||
| United States | ||||
| Rest of North America | ||||
| South America | Argentina | |||
| Brazil | ||||
| Rest of South America | ||||
Need A Different Region or Segment?
Customize Now
Market Definition
- Carbonated Soft Drinks (CSDs) - Carbonated soft drinks (CSDs) refer to non-alcoholic beverages that are carbonated and typically flavored, containing dissolved carbon dioxide to create effervescence. These beverages commonly include cola, lemon-lime, orange, and various fruit-flavored sodas. Marketed in cans, bottles, or fountain dispense.
- Juices - We have considered packaged juices which encompass non-alcoholic beverages derived from fruits, vegetables, or a combination thereof, processed and sealed in various packaging formats such as bottles, cartons, or pouches. Excluding fresh juices, this market segment involves commercially prepared and preserved juices, often with added preservatives and flavors.
- Ready-to-Drink (RTD) Tea and RTD Coffee - Ready-to-Drink (RTD) tea and RTD coffee are pre-packaged, non-alcoholic beverages that are brewed and prepared for consumption without further dilution. RTD tea typically includes various tea varieties, infused with flavors and sweeteners, and comes in bottles, cans, or cartons. Similarly, RTD coffee involves pre-brewed coffee formulations, often mixed with milk, sugar, or flavorings, and is conveniently packaged for on-the-go consumption.
- Energy Drinks - Energy drinks are non-alcoholic beverages formulated to provide a quick boost of energy and alertness. Whereas, sports drinks are beverages designed to hydrate and replenish electrolytes, particularly after physical exertion, exercise, or intense activity
| Keyword | Definition |
|---|---|
| Carbonated Soft Drinks | Carbonated soft drinks (CSDs) are a combination of carbonated water and flavouring, sweetened by sugar or a non-sugar sweeteners. |
| Standard Cola | Standard Cola is defined as the original flavor of cola soda. |
| Diet Cola | A cola-based soft drink containing no or low amounts of sugar |
| Fruit Flavored Carbonates | A carbonated beverage prepared from fruit juice/fruit flavor with carbonated water and containing sugar, dextrose, invert sugar or liquid glucose either singly or in combination. It may contain peel oil and fruit essences. |
| Juice | Juice is a drink made from the extraction or pressing of the natural liquid contained in fruit and vegetables. |
| 100% Juice | Fruit/vegetable juice made from fruit in the form of its juice with no water added to make up the volume. It is not permitted to add sugars, sweeteners, preservatives, flavourings or colourings to fruit juice. |
| Juice Drinks (up to 24% Juice) | Fruit/vegetable juice drinks with up to 24% fruits/vegetable extract. |
| Nectars (25-99% Juice) | Juices that can have between 25 and 99% of fruit, with the minimum legal limits defined depending on the type of fruit |
| Juice concentrates | Juice Concentrates are those form of juices when most of this liquid is removed resulting in a thick, syrupy product known as juice concentrate. |
| RTD Coffee | Packaged coffee beverages that are sold in a prepared form and are ready for consumption at the time of purchase. |
| Iced Coffee | An iced coffee is a cold version of coffee, usually a combination of hot espresso and milk with ice added to it. |
| Cold Brew Coffee | Cold brew also called cold water extraction or cold pressing is made by steeping ground coffee in room-temperature water for several hours. |
| RTD Tea | Ready-to-drink (RTD) tea is a packaged tea product ready for immediate consumption without brewing or preparation |
| Iced Tea | Ice tea or iced tea is a drink made from tea without milk but with sugar and sometimes fruit flavourings, drunk cold. |
| Green Tea | Green tea is a tea beverage which promotes mental alertness, relieving digestive symptoms and promoting weight loss. |
| Herbal Tea | Herbal tea beverages are made from the infusion or decoction of herbs, spices, or other plant material in hot water. |
| Energy Drink | A type of drink containing stimulant compounds, usually caffeine, which is marketed as providing mental and physical stimulation. They may or may not be carbonated and may also contain sugar, other sweeteners, or herbal extracts, among numerous possible ingredients. |
| Sugar-free or Low-calories Energy Drinks | Sugar-free or Low-calories Energy Drinks are sugar-free, artificially sweetened energy drinks with few or no calories. |
| Traditional Energy Drink | Traditional Energy Drinks are functional soft drinks containing ingredients designed to boost the consumer's energy. |
| Natural/Oraganic Energy Drinks | Natural/Organic energy drinks are energy drinks free of artificial sweeteners and synthetic colorings. Instead, they contain naturally derived ingredients such as green tea, yerba mate, and botanical extracts. |
| Energy Shots | A small but highly concentrated energy drink that contains large amounts of caffeine and/or other stimulants. The quantity is comparatively smaller compared to energy drinks. |
| Sports Drink | Sports drinks are beverages designed specifically for the rapid supply of fluid, carbohydrates, and electrolytes before, during or after exercise. |
| Isotonic | Isotonic drinks contain similar concentrations of salt and sugar as in the human body, and are designed to quickly replace fluids lost during exercise but with an increase of carbohydrate. |
| Hypertonic | Hypertonic drinks have a higher concentration of salt and sugar than the human body. They are best drunk after exercise as it is important to replace glycogen levels quickly after exercise. |
| Hypotonic | Hypotonic drinks are designed to quickly replace fluids lost during exercise. They have very low carbohydrate content and a lower concentration of salt and sugar than the human body. |
| Electrolyte-Enhanced Water | Electrolyte water is water infused with electrically-charged minerals, such as sodium, potassium, calcium, and magnesium. |
| Protein-based Sport Drinks | Protein-based sports drinks are those sports drinks which has added protein in it that will improve performance and reduce muscle protein breakdown. |
| On-Trade | The on-trade refers to places that sell beverages for immediate consumption on the premises like bars, restaurants, and pubs |
| Off-Trade | Off-trade usually means places like liquor stores, supermarkets and other places where you don't consume the beverage right away. |
| Convenience Store | A retail business that provides the public with a convenient location to quickly purchase a wide variety of consumable products and services, generally food and gasoline. |
| Specialty store | A specialty store is a shop/store that carries a deep assortment of brands, styles, or models within a relatively narrow category of goods |
| Online Retail | Online retail is a type of eCommerce whereby a business sells goods or services directly to consumers from a website. |
| Aseptic Packaging | Aseptic packaging refers to the filling of a cold, commercially sterile product under sterile conditions into a presterilized container and closure under sterile conditions to form a seal that effectively excludes microorganisms. These includes tetra packs, cartons, pouches etc. |
| PET Bottle | PET bottle means a bottle made of polyethylene terephthalate. |
| Metal Cans | Metal containers made of aluminum or tin- plated or zinc-plated steel, which are commonly used for packaging food, beverages or other products. |
| Disposable Cups | Disposable Cup means a cup or other container designed for single use to serve beverages, such as water, cold drinks, hot drinks and alcoholic beverages. |
| Gen Z | A way of referring to the group of people who were born in the late 1990s and early 2000s. |
| Millenial | Anyone born between 1981 and 1996 (ages 23 to 38 in 2019) is considered a Millennial |
| Taurine | Taurine is an amino acid that supports immune health and nervous system function. |
| Bars & Pubs | It is a drinking establishment licensed to serve alcoholic drinks for consumption on the premises. |
| Café | It is a foodservice establishment serving refreshments (mainly coffee) and light meals. |
| On the go | It means doing / dealing with while busily engaged with something and not diverting plans in order to accommodate. |
| Internet Penetration | The Internet Penetration Rate corresponds to the percentage of the total population of a given country or region that uses the Internet. |
| Vending Machine | A machine that dispenses small articles such as food, drinks, or cigarettes when a coin or token is inserted |
| Discount store | A discount store or discounter offers a retail format in which products are sold at prices that are in principle lower than an actual or supposed "full retail price". Discounters rely on bulk purchasing and efficient distribution to keep down costs. |
| Clean Label | Clean label on the beverage market are drinks that are made from few ingredients of natural origin and are not or only slightly processed. |
| Caffeine | An alkaloid compound which is a stimulant of the central nervous system. It is mainly used recreationally, as a mild cognitive enhancer to increase alertness and attentional performance. |
| Extreme sport | Action sports, adventure sports or extreme sports are activities perceived as involving a high degree of risk. |
| High-intensity interval training | It incorporates several rounds that alternate between several minutes of high intensity movements to significantly increase the heart rate to at least 80% of one's maximum heart rate, followed by short periods of lower intensity movements. |
| Shelf life | The length of time for which an item remains usable, fit for consumption, or saleable. |
| Cream Soda | Cream soda is a sweet soft drink. Generally flavored with vanilla and based on the taste of an ice cream float |
| Root Beer | Root beer is a sweet North American soft drink traditionally made using the root bark of the sassafras tree Sassafras albidum or the vine of Smilax ornata as the primary flavor. Root beer is typically, but not exclusively, non-alcoholic, caffeine-free, sweet, and carbonated. |
| Vanilla Soda | A carbonated soft drink flavoured with vanilla. |
| Dairy-Free | A product that does not contain any milk or milk products from cows, sheep or goats. |
| Caffeine-Free Energy Drinks | Caffeine-free energy drinks rely on other ingredients to boost the energy. Popular choices include amino acids, B vitamins, and electrolytes. |
Need More Details on Market Definition?
Ask a Question
Research Methodology
Mordor Intelligence follows a four-step methodology in all our reports.
- Step-1: IDENTIFY KEY VARIABLES: In order to build a robust forecasting methodology, the variables and factors identified in Step 1 are tested against available historical market numbers. Through an iterative process, the variables required for market forecast are set, and the model is built on the basis of these variables.
- Step-2: Build a Market Model: Market-size estimations for the forecast years are in nominal terms. Inflation is not a part of the pricing, and the average selling price (ASP) is kept constant throughout the forecast period for each country.
- Step-3: Validate and Finalize: In this important step, all market numbers, variables, and analyst calls are validated through an extensive network of primary research experts from the market studied. The respondents are selected across levels and functions to generate a holistic picture of the market studied.
- Step-4: Research Outputs: Syndicated reports, custom consulting assignments, databases & subscription platforms

Get More Details On Research Methodology
Download PDF


