
Social Networking Market Size and Share
Market Overview
| Study Period | 2020 - 2031 |
|---|---|
| Market Size (2026) | USD 210.66 Billion |
| Market Size (2031) | USD 411.27 Billion |
| Growth Rate (2026 - 2031) | 14.32 % |
| Fastest Growing Market | Middle East and Africa |
| Largest Market | Asia Pacific |
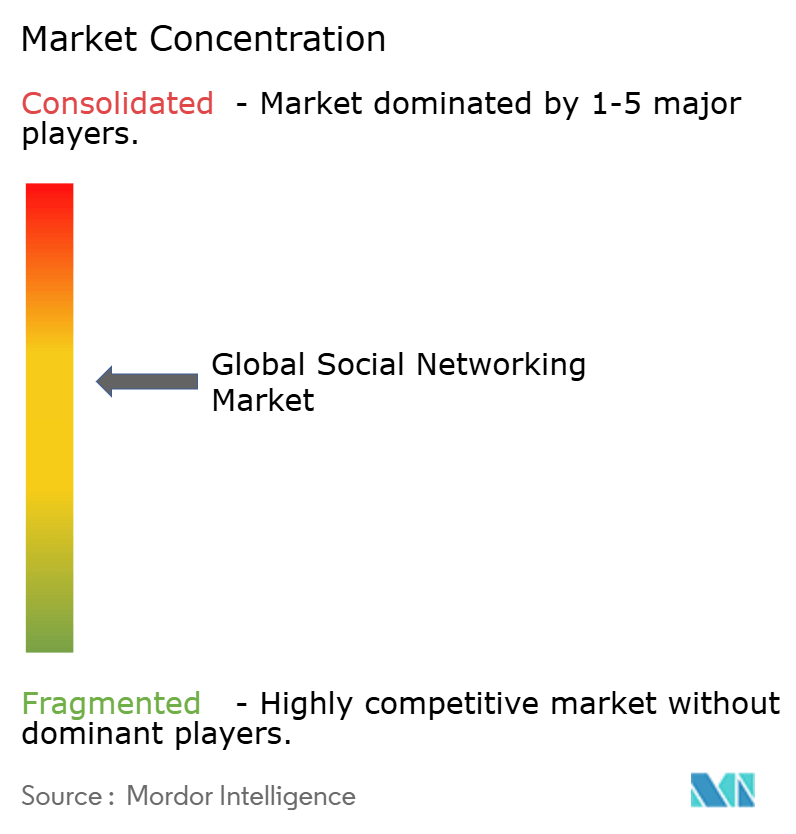
| Market Concentration | Medium |
Major Players *Disclaimer: Major Players sorted in no particular order Image © Mordor Intelligence. Reuse requires attribution under CC BY 4.0. | |
Social Networking Market Analysis by Mordor Intelligence
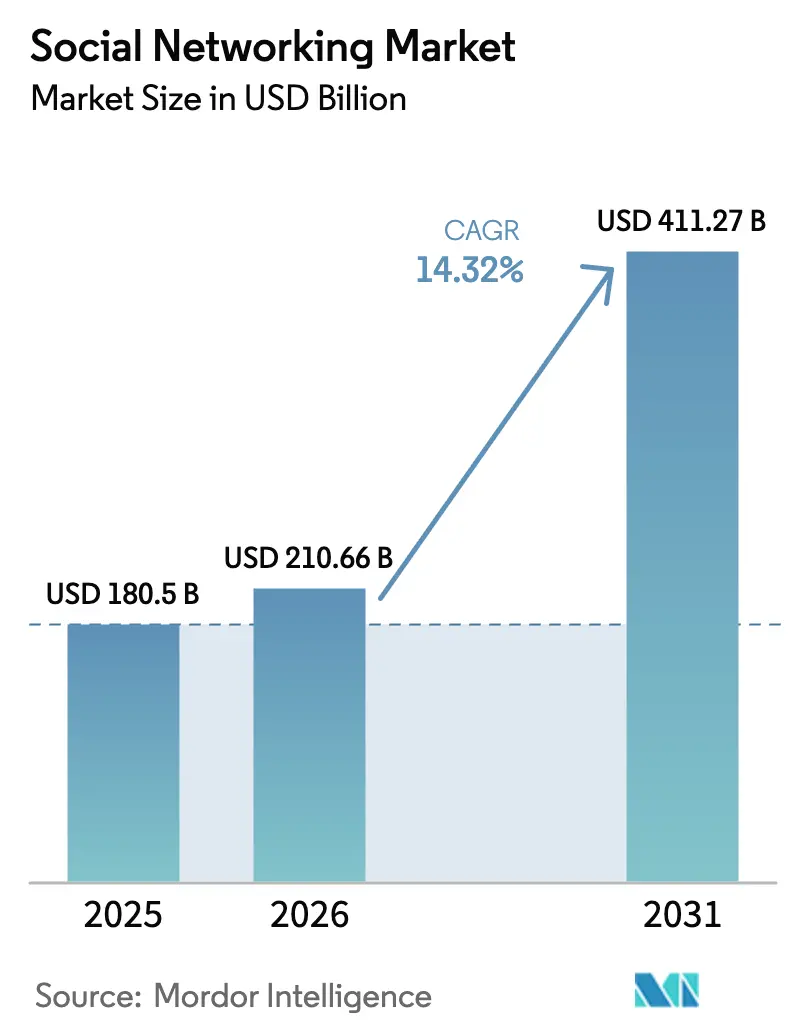
The Social Networking Market size is expected to increase from USD 180.5 billion in 2025 to USD 210.66 billion in 2026 and reach USD 411.27 billion by 2031, growing at a CAGR of 14.32% over 2026-2031.
Advertising remains the primary revenue engine, but creator-oriented models such as virtual goods and tipping are scaling quickly as platforms diversify earnings streams. Smartphones account for the bulk of user sessions, yet head-worn displays and smartwatches are opening fresh surface areas for quick, low-friction interactions. Platform fragmentation is intensifying as decentralized networks win funding, while Gen Z engagement shifts toward short-form video and private group messaging. Asia Pacific leads by revenue, the Middle East and Africa posts the fastest growth, and regulatory rulings in Europe, Australia, and the United States are reshaping compliance costs and product design.
Key Report Takeaways
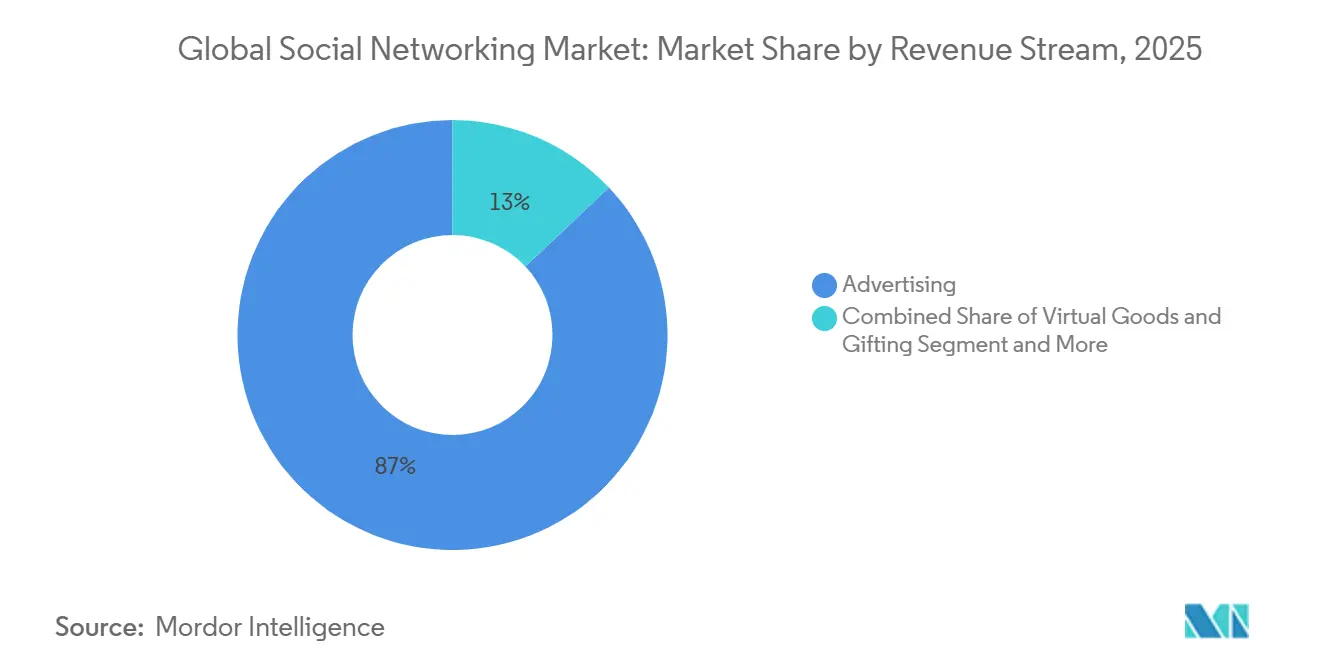
- By revenue stream, advertising commanded 87.03% of global social networking market share in 2025; virtual goods and gifting is advancing at a 14.89% CAGR through 2031.
- By device type, smartphones captured 78.21% of sessions in 2025, while wearables are forecast to expand at a 15.72% CAGR to 2031.
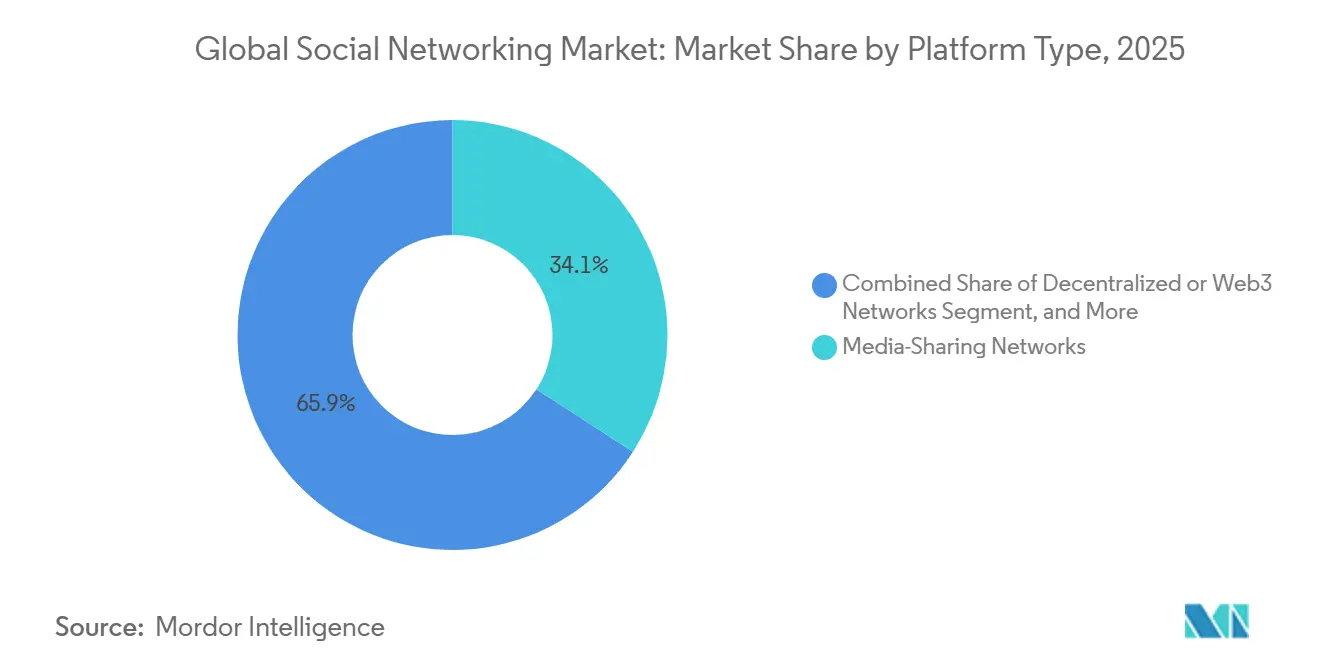
- By platform type, media-sharing networks held 34.14% of 2025 revenue; decentralized networks are projected to grow at a 15.23% CAGR during 2026-2031.
- By user demographic, the 25-34 cohort accounted for 31.44% of active users in 2025; the 13-24 segment is rising at a 16.01% CAGR through 2031.
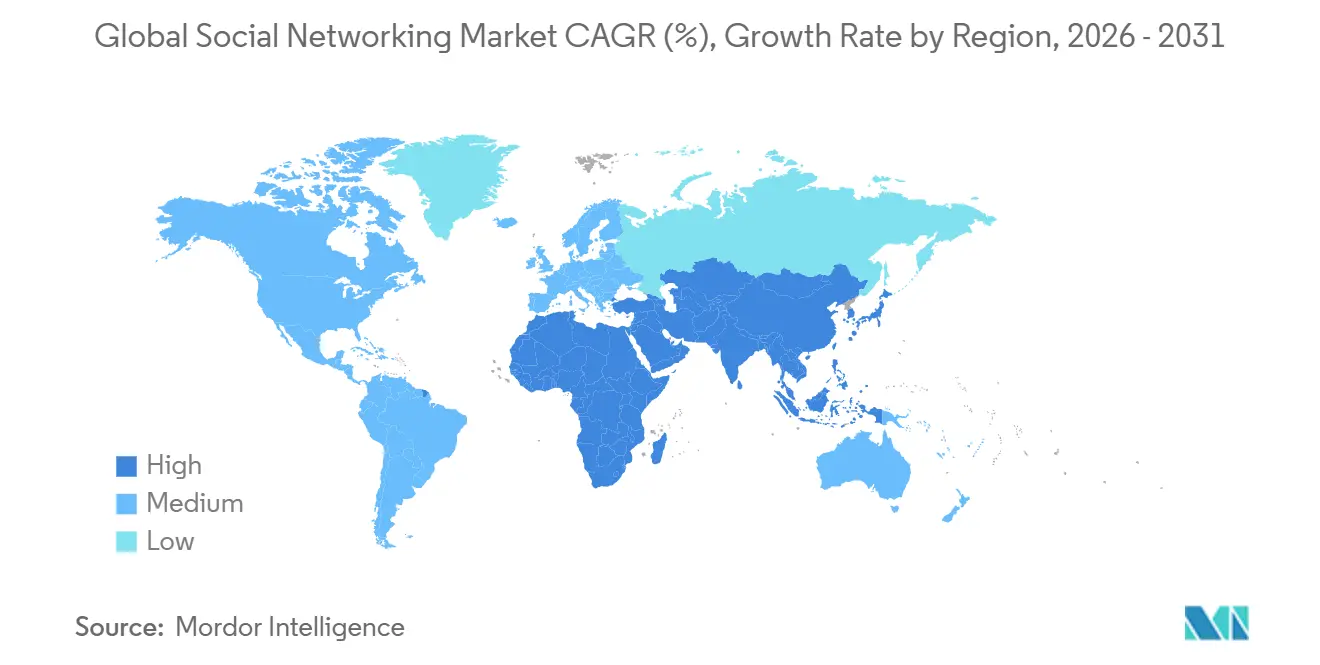
- By geography, Asia Pacific generated 34.83% of global revenue in 2025, while the Middle East and Africa is on track for a 15.81% CAGR to 2031.
Note: Market size and forecast figures in this report are generated using Mordor Intelligence’s proprietary estimation framework, updated with the latest available data and insights as of January 2026.
Market Trends and Insights
Drivers Impact Analysis of Social Networking Market*
| Driver | (~) % Impact on CAGR Forecast | Geographic Relevance | Impact Timeline |
|---|---|---|---|
| Rising Mobile-Internet Penetration | +2.30% | Global, with acceleration in South Asia and Sub-Saharan Africa | Medium term (2-4 years) |
| Surge in Digital Ad Spend on Social Media | +3.10% | North America, Europe, Asia Pacific | Short term (≤ 2 years) |
| Short-Form Video Adoption Across Regions | +2.80% | Global, led by Asia Pacific and Latin America | Short term (≤ 2 years) |
| Expansion of Social Commerce and Live Shopping Tools | +2.50% | Asia Pacific core, spill-over to Middle East and North America | Medium term (2-4 years) |
| Decentralized Social Protocols and Blockchain ID Adoption | +1.40% | North America and Europe early adopters, Asia Pacific following | Long term (≥ 4 years) |
| Synthetic-Media Influencers Unlocking New Engagement Models | +1.20% | Global, with brand partnerships concentrated in North America and Europe | Medium term (2-4 years) |
| Source: Mordor Intelligence | |||
Rising Mobile-Internet Penetration
Global smartphone users reached 5.7 billion in 2025, and 5G subscriptions crossed 1.9 billion connections, lifting average monthly data use to 25 gigabytes in developed markets.[1] First-time internet access now occurs primarily through budget Android handsets, with India alone adding 120 million smartphone users during 2023-2025.[2] Platforms that bundle lite apps and 3G-fallback modes win share in bandwidth-constrained regions, as illustrated by the Philippines’ daily average of 3 hours 32 minutes on social media in 2025. These conditions reinforce the global social networking market’s ability to reach new users without desktop dependence.
Surge in Digital Ad Spend on Social Media
Instagram supplied more than half of Meta’s United States advertising revenue in 2025 as brands redirected budgets to Stories, Reels, and Shop tabs that merge content discovery with checkout.[3] Machine-learning models lowered cost-per-acquisition on Meta platforms by 18% year over year, validating performance-first budget allocations. Snap logged USD 1.5 billion in third-quarter 2025 revenue, with augmented-reality lenses driving 22% of impressions and 30% higher click-through rates than static units. Spending momentum supports sustained monetization across the global social networking market.
Short-Form Video Adoption Across Regions
TikTok users in Southeast Asia averaged 45 hours per month on the app in 2025, surpassing YouTube’s 38 hours and Instagram’s 29 hours. Algorithmic feeds give micro-creators with fewer than 10,000 followers outsized reach, fuelling a 79% jump in creator-economy payouts during 2025. Instagram Reels and YouTube Shorts together engaged 2.1 billion monthly users in 2025, compelling legacy platforms to prioritize vertical video. The format’s stickiness underpins robust user-time growth for the global social networking market.
Expansion of Social Commerce and Live Shopping Tools
United States social-commerce sales grew from USD 31.7 billion in 2023 to USD 67.8 billion in 2026, propelled by one-click checkout and influencer-led streams. China’s gross merchandise value reached CNY 4.9 trillion (USD 680 billion) in 2024, with Douyin and Kuaishou commanding 58% of activity. The United Arab Emirates recorded a 73% social-commerce conversion rate in 2025, the highest outside Asia. Live shopping strengthens the revenue depth of the global social networking market beyond ads.
Restraints Impact Analysis of Social Networking Market*
| Restraint | (~) % Impact on CAGR Forecast | Geographic Relevance | Impact Timeline |
|---|---|---|---|
| Intensifying Data-Privacy and Security Regulations | -2.10% | Europe and North America, with Asia Pacific adopting similar frameworks | Short term (≤ 2 years) |
| Global Antitrust Scrutiny of Dominant Platforms | -1.60% | North America and Europe, with spillover to Asia Pacific | Medium term (2-4 years) |
| User-Attention Saturation and Engagement Fatigue | -1.30% | Global, most pronounced in North America and Europe | Medium term (2-4 years) |
| Algorithmic Bias and Misinformation Hurting Brand Safety | -1.10% | Global, with heightened sensitivity in North America and Europe | Short term (≤ 2 years) |
| Source: Mordor Intelligence | |||
Intensifying Data-Privacy and Security Regulations
The European Union fined Meta EUR 251 million (USD 268 million) in 2024 for GDPR breaches, lifting cumulative penalties to EUR 1.2 billion (USD 1.28 billion) since 2018. Australia’s under-16 access ban, effective 10 December 2025, forces platforms to deploy age-verification layers and accept AUD 49.5 million (USD 32.7 million) breach risks. Compliance investments in data localization, consent management, and audits elevate cost structures across the global social networking market.
Global Antitrust Scrutiny of Dominant Platforms
A United States federal judge ruled in 2024 that Google maintained an illegal monopoly in online search and advertising. Parallel probes in the United Kingdom and European Union pressure Meta and ByteDance to open application programming interfaces and embrace data portability. These proceedings inject uncertainty into merger pipelines and could force structural remedies that dilute network effects in the global social networking market.
*Our forecasts treat driver/restraint impacts as directional, not additive. The impact forecasts reflect baseline growth, mix effects, and variable interactions.
Social Networking Market Segment Analysis
By Revenue Stream – Advertising Weight Faces Diversification Push
Advertising generated 87.03% of 2025 revenue, confirming its outsized influence on the global social networking market. Meta booked USD 50.1 billion in third-quarter 2025 ad sales after algorithmic tweaks cut cost-per-click, helping advertisers secure sub-USD 5 acquisition costs. The global social networking market size tied to ad spend still dwarfs other levers, but risk exposure is growing.
Virtual goods and gifting are the fastest-rising stream, advancing at a 14.89% CAGR through 2031. TikTok’s USD 2.5 billion creator payouts in 2024 illustrate how direct user-to-creator payments can scale without gatekeeper ad exchanges. Subscriptions are gaining relevance, with Snapchat+ delivering USD 150 million in quarterly revenue from 17 million users. The revenue remix reduces cyclicality in the global social networking industry and unlocks predictable cash flow.

By Device Type – Wearables Add Ambient Access Points
Smartphones retained 78.21% of user sessions in 2025, cementing their role as the dominant interface for the global social networking market. Tablets and desktops held modest shares linked to long-form video and professional networking.
Wearables and “other” form factors, however, are projected to post a 15.72% CAGR to 2031. Meta’s Messenger integration into Quest headsets and broader smartwatch notification ecosystems allow quick replies and voice-to-text input. For the global social networking market size attributed to wearables, cross-device sync and low-latency identity management remain gating factors, but adoption in high-income regions signals a shift toward always-on ambient networking.
By Platform Type – Decentralized Networks Break Walled Gardens
In 2025, media-sharing networks led by Instagram, TikTok, and YouTube accounted for 34.14% of total revenue. While messaging apps, professional networks, and niche communities maintain dedicated followings, decentralized Web3 protocols are projected to grow at a 15.23% CAGR through 2031.
In 2024, Lens Protocol and Farcaster collectively secured USD 77 million, supporting user-owned social graphs that challenge traditional lock-in models. Although Web3's slice of the global social networking market remains modest, its upward momentum is compelling established players to adapt, notably by opening APIs and enhancing portability.
By User Demographic – Gen Z Alters Engagement Metrics
In 2025, users aged 25-34 made up 31.44% of active users, significantly boosting premium subscriptions on platforms like LinkedIn and Snapchat+. This demographic's professional focus and purchasing power have made them a key target for platforms aiming to monetize through premium offerings. Meanwhile, the 13-24 age group, the fastest-growing segment, is expanding at a 16.01% CAGR.
Their strong preference for short-form videos and private messaging is driving platforms to adapt by prioritizing engagement metrics such as 'watch time' and 'message count' over traditional metrics like 'likes'. This shift reflects the evolving user behavior and the need for platforms to stay relevant in a competitive market. Additionally, with Gen Z increasingly normalizing AI-generated content, synthetic influencers are expected to gain a stronger foothold in the global social networking landscape, reshaping how brands and users interact within these platforms.
Geography Analysis
APAC Social Networking Market
Asia Pacific produced 34.83% of 2025 revenue, powered by China’s super-app ecosystems and India’s 120 million new smartphone users added during 2023-2025. TikTok usage in Southeast Asia exceeded 45 hours per month, and Indonesia devoted 42.6% of online time to social media. The global social networking market size attributable to the region is poised for further upticks as vernacular interfaces and integrated payments deepen adoption.
MEA Social Networking Market
The Middle East and Africa is forecast to register a 15.81% CAGR through 2031, the fastest globally. Saudi Arabia’s social-media penetration reached 111% in 2025, while the United Arab Emirates posted a 73% social-commerce conversion rate. Data-center buildouts under Vision 2030, worth USD 2.7 billion, reduce latency for live shopping and augmented reality, widening monetization capacity.
The Americas, Europe, Africa and Oceania Social Networking Market
North America and Europe remain income leaders thanks to high average revenue per user, but their mature user bases mean single-digit growth. Regulatory expenses linked to GDPR, CCPA, and pending antitrust actions temper margins. South America and Africa boast faster user-base expansion; Brazil’s penetration crossed 70% in 2025, and Nigeria’s youthful demographics present large upside, yet monetization trails due to infrastructure gaps and lower disposable income. Australia’s under-16 ban illustrates how regional regulation can curtail reachable audiences in otherwise high-value markets.
Regulatory Landscape
Regulation is tightening around platform accountability, transparency, and child safety, which is increasing compliance and product design costs for social networking providers. In Europe, the Digital Services Act (DSA) is pushing systemic-risk requirements for very large online platforms, including ad transparency and researcher data access. In July 2026, the European Commission accepted an action plan from X to address DSA compliance issues, reinforcing enforcement momentum.
The United Kingdom is shifting from legislation to operational duties under the Online Safety Act framework. The Online Safety Act 2023 (Commencement No. 7) Regulations 2026 took effect on 7 April 2026, establishing duties for user-to-user services to report Child Sexual Exploitation and Abuse (CSEA) content to the National Crime Agency, and Ofcom has published a roadmap that includes further reporting on age-assurance effectiveness scheduled for July 2026. At an intergovernmental level, the Council of Europe adopted Recommendation CM/Rec(2026)4 in April 2026, and the G7 and the European Union agreed on common principles in June 2026 focused on protecting minors in digital services, supporting broader convergence on safety-by-design expectations.
Competitive Landscape
Meta Platforms dominates daily active people at 3.43 billion in third-quarter 2025 and leverages unified ad buying across Facebook, Instagram, WhatsApp, and Messenger. Alphabet’s YouTube remains the largest long-form video hub, while ByteDance’s TikTok paid USD 2.5 billion to creators in 2024 to secure supply. Together, the top three players capture the majority of ad spend flowing through the global social networking market.
Second-tier contenders focus on niche intensity rather than scale. Telegram turned its first profit in 2024 with USD 1 billion in revenue, validating a premium-feature subscription path. Discord filed confidentially for an initial public offering in December 2025, revealing 231 million monthly active users and USD 725 million in annual recurring revenue, 54% of which comes from non-gaming communities. Reddit, LinkedIn, and regional champions such as Kuaishou and Line add further fragmentation.
White-space innovation clusters around decentralized networks, professional micro-communities, and synthetic influencer tooling. Lens Protocol and Farcaster exemplify funding momentum behind user-owned graphs. Meanwhile, Meta’s 2024 launch of Meta Verified and Snap’s premium tier underscore the pivot to recurring revenue streams. Machine-learning investments, particularly in content recommendation and ad targeting, remain key competitive differentiators, though looming interoperability mandates could blunt proprietary data advantages.
Social Networking Industry Leaders
-
YouTube
-
ByteDance
-
Meta
-
Snap Inc.
-
Pinterest Inc.
- *Disclaimer: Major Players sorted in no particular order
Social Networking Market Companies Covered in this Report
- Meta Platforms Inc.
- Alphabet Inc.
- ByteDance Ltd.
- Tencent Holdings Ltd.
- Snap Inc.
- Pinterest Inc.
- Reddit Inc.
- X Corp.
- LinkedIn Corporation
- Discord Inc.
- Telegram FZ-LLC
- Kuaishou Technology
- LINE Corporation
- VK Company Limited
- Weibo Corporation
- Baidu Inc.
- Tumblr (Automattic Inc.)
- Quora Inc.
- Clubhouse Media Group Inc.
- Mastodon gGmbH
Market Opportunities and Future Outlook
Monetization opportunities are widening beyond feed ads into commerce, creator tools, and AI-enabled experiences, supported by broad user reach and rising social-commerce penetration. As of October 2025, global social media user identities reached 5.66 billion (68.7% of the population), supporting ongoing demand for performance marketing and creator-led formats. Commerce depth is also expanding, with United States social-commerce sales increasing to USD 67.8 billion in 2026, as platforms that integrate checkout, live shopping, and affiliate tooling capture higher-value actions than impression-only inventory.
A second opportunity track centers on AI and infrastructure investment that supports richer content creation, personalization, and new surfaces, including wearables. In January 2026, Meta created a dedicated "Meta Compute" division, and in July 2026 it announced AI-optimized data center expansions that include a new 1 GW facility in Alberta, Canada (CAD 13 billion) and an expansion of its Richland Parish, Louisiana campus to 5 GW (over USD 50 billion). Taken together, these capacity additions point to more compute for generative features and recommendation systems at scale. In parallel, youth-protection policy discussions are pushing product differentiation through age assurance, youth modes, and reduced-targeting experiences, and in July 2026 EU institutions and South Korea's KMCC advanced proposals on age-based restrictions and limits on addictive features, creating whitespace for compliant identity, parental controls, and privacy-preserving ad and measurement stacks.
Recent Industry Developments in Social Networking Market
- July 2026: Meta introduced Muse Image through Meta AI and highlighted ongoing work on related generative models, expanding the in-app creation toolset available to users and creators. The update supports higher content supply and engagement loops while adding additional inventory types for advertisers and brand collaborations.
- June 2026: Snap Inc. debuted SPECS augmented reality glasses and announced new developer tools for building experiences, including additions to Lens Studio and a Native Development Kit. This expands Snap’s wearable and developer ecosystem, connecting social content creation to head-worn computing as another session surface alongside smartphones.
- November 2024: The ITU reported global internet penetration reached 68% with 5.5 billion users, reinforcing the addressable base for social networking growth in emerging markets. Higher connectivity supports mobile-first engagement and provides more scale for ad-funded and creator-led monetization models.
Social Networking Market Report Scope and Research Methodology
Market Definition and Coverage
For this study, the social networking market is defined as global revenue earned by online platforms that let users create profiles, connect with others, and share content through apps or browsers, including monetization that is directly attributable to those platforms.
Scope exclusions: Enterprise collaboration suites and standalone email services are not counted in this market size.
Segments Covered in This Report
- By Revenue Stream
- Advertising
- In-App Purchases
- Subscriptions
- Virtual Goods and Gifting
- By Device Type
- Smartphone
- Tablet
- Desktop or Laptop
- Wearable and Others
- By Platform Type
- Traditional Social Networks
- Media-Sharing Networks
- Messaging or Communication Apps
- Professional Networks
- Niche and Interest-Based Networks
- Decentralized or Web3 Networks
- By User Demographics (Age Group)
- 13-24 Years
- 25-34 Years
- 35-44 Years
- 45+ Years
- By Geography
- North America
- United States
- Canada
- Mexico
- South America
- Brazil
- Argentina
- Rest of South America
- Europe
- United Kingdom
- Germany
- France
- Italy
- Spain
- Rest of Europe
- Asia Pacific
- China
- India
- Japan
- South Korea
- Southeast Asia
- Australia
- Rest of Asia Pacific
- Middle East
- Saudi Arabia
- UAE
- Turkey
- Rest of Middle East
- Africa
- South Africa
- Nigeria
- Egypt
- Rest of Africa
- North America
Data Sources, Market Sizing, and Validation
Desk Research
Desk work started by mapping the demand pool using public digital adoption indicators, then linking that to platform monetization signals. We referred to open sources such as ITU connectivity statistics, World Bank macro and demographic series, OECD digital economy notes, and national telecom regulators and statistics offices that publish internet and smartphone usage data. Policy and privacy context was cross-checked using sources such as the FTC, the European Commission, and academic papers that summarize platform governance trends.
To translate adoption into market value, we used company filings, annual reports, investor presentations, and earnings call commentary to understand revenue mix, ad load trends, and the shift toward subscriptions and in-app features. News and financial databases were used to track major product launches, policy changes, and M and A that can shift revenues between years. Patent databases were referenced to sanity check emerging feature directions that can influence monetization. The sources listed here are illustrative only, and many other public and paid references were reviewed to collect, validate, and clarify data.
Primary Interviews and Surveys
Primary work focused on validating how platform revenues are formed in practice, especially the split between advertising, premium subscriptions, and in-app purchases, and how that mix changes by region. We interviewed platform-side roles, agencies and marketing buyers, and app ecosystem specialists, so assumptions like ARPU progression, ad pricing direction, and user time spent could be checked and adjusted. Because this is a global market, inputs were tested across APAC, EMEA, and the Americas to avoid over-weighting a single geography when building the final model.
Distribution of primary research fieldwork respondents
| Company type | Respondent position | Region |
|---|---|---|
| Top tier: 38% | CXOs: 14% | APAC: 46% |
| Mid tier: 41% | Functional/Unit leaders: 35% | EMEA: 34% |
| Smaller Players: 21% | Managers: 51% | Americas: 20% |
Market-Sizing & Forecasting
The sizing logic mainly uses a top-down build where the internet user base, smartphone penetration, and social media time spent are used to reconstruct the addressable engagement pool, which is then translated into revenue using monetization rates. We then corroborated totals with selective bottom-up checks, such as sampling platform-reported revenue trends, ad pricing direction from buyer-side feedback, and proxy roll-ups of subscription and in-app purchase adoption, and then tuned the model where gaps were visible.
A few practical inputs that shaped the totals included active user trends by region, advertising load and pricing movement (CPM direction), subscription take-up for premium features, in-app purchase and virtual gifting intensity, and device mix shifts between mobile and desktop. Where direct values were missing for smaller platforms or emerging markets, we filled gaps using peer group ranges and regional ARPU bands confirmed in interviews, and then kept the implied revenue per user within realistic bounds versus reported benchmarks.
For forecasting, scenario analysis was used because ad spending sensitivity to macro conditions and policy shifts can move outcomes quickly. Assumptions for growth were anchored in interview consensus on ad budget allocation, creator economy monetization, and privacy and measurement changes, and then translated into annual revenue trajectories that stay consistent with adoption and pricing signals.
Data Validation & Update Cycle
Validation was handled through multiple checks so the market total stays consistent with independent signals. We compared outputs against proxy indicators like digital ad spend direction, connectivity growth, and reported revenue patterns from major listed platforms, and then investigated any sharp variance by region or year. When numbers looked inconsistent, follow-up conversations were triggered to confirm whether the issue came from currency timing, one-off events, or a real monetization shift.
Before sign-off, the model and assumptions go through analyst review steps that focus on outlier detection, logic consistency, and reproducibility of calculations. Reports are refreshed annually, and interim updates are made when material events occur, such as major regulatory changes or platform monetization shifts. Right before delivery, a final pass is completed so clients receive the most current view using the latest available information.
Mordor Intelligence's Global Social Networking Market Size Compared With Other Published Estimates
Published market sizes for social networking often do not match, even when they use similar years, because each publisher groups revenue streams and platform types in their own way. Differences also show up when one estimate leans more on ad-spend proxies, while another relies more on platform revenue disclosures, which changes the final tally.
Enterprise collaboration suites are kept outside Mordor Intelligence's scope, and that single exclusion can materially change totals when other estimates blend workplace messaging, community tools, and social networking under one umbrella. Other common gap drivers include whether virtual gifts and in-app purchases are fully counted, how multi-currency revenue is converted for a given year, and how fast ad pricing and subscription ARPU are assumed to rise when projecting forward.
Benchmark comparison
| Source | Market Size | Gaps in Research Methodology |
|---|---|---|
| Mordor Intelligence | USD 180.50 B (2025) | |
| Global Consultancy A | USD 205.00 B (2025) | Often blends adjacent categories like workplace collaboration and broader social media services, and can apply aggressive ad pricing uplift assumptions that are not consistently cross-checked against platform revenue mix. |
| Industry Association B | USD 165.00 B (2025) | May anchor sizing closer to reported advertising spend alone, which can undercount premium subscriptions, virtual gifting, and in-app purchase revenues that sit inside platform monetization. |
Overall, the spread is largely explained by what is counted as social networking revenue and how monetization beyond ads is handled. Our process keeps inputs tied to user base and engagement signals, then reconciles those with monetization rates validated through interviews, which makes the final number easier to trace and repeat.
Key Questions Answered in the Report
How large is the global social networking market in 2026?
The market generated USD 210.66 billion in revenue in 2026, on track for USD 411.27 billion by 2031 at a 14.32% CAGR.
Which revenue stream is growing fastest?
Virtual goods and gifting is forecast to expand at a 14.89% CAGR through 2031 as platforms embed tipping and digital collectibles.
What device category will see the highest growth?
Wearables, including smartwatches and head-worn displays, are expected to post a 15.72% CAGR during 2026-2031.
Which region leads market revenue?
Asia Pacific contributed 34.83% of global revenue in 2025, driven by China's super-app ecosystems and Indias rising smartphone base.
How are data-privacy regulations affecting the sector?
Cumulative GDPR and Digital Services Act fines exceeding USD 2 billion and Australia's under-16 access ban illustrate higher compliance costs and stricter user-age verification.
Who are the dominant players?
Meta Platforms, Alphabet, and ByteDance capture the majority of global ad spend, while Telegram, Discord, and emerging decentralized networks provide competitive pressure.