
Smartcard MCU Market Size and Share
Market Overview
| Study Period | 2020 - 2031 |
|---|---|
| Market Size (2026) | USD 3.68 Billion |
| Market Size (2031) | USD 4.71 Billion |
| Growth Rate (2026 - 2031) | 5.04% CAGR |
| Fastest Growing Market | Middle East and Africa |
| Largest Market | Asia Pacific |
| Market Concentration | High |
Major Players *Disclaimer: Major Players sorted in no particular order Image © Mordor Intelligence. Reuse requires attribution under CC BY 4.0. | |
Smartcard MCU Market Analysis by Mordor Intelligence
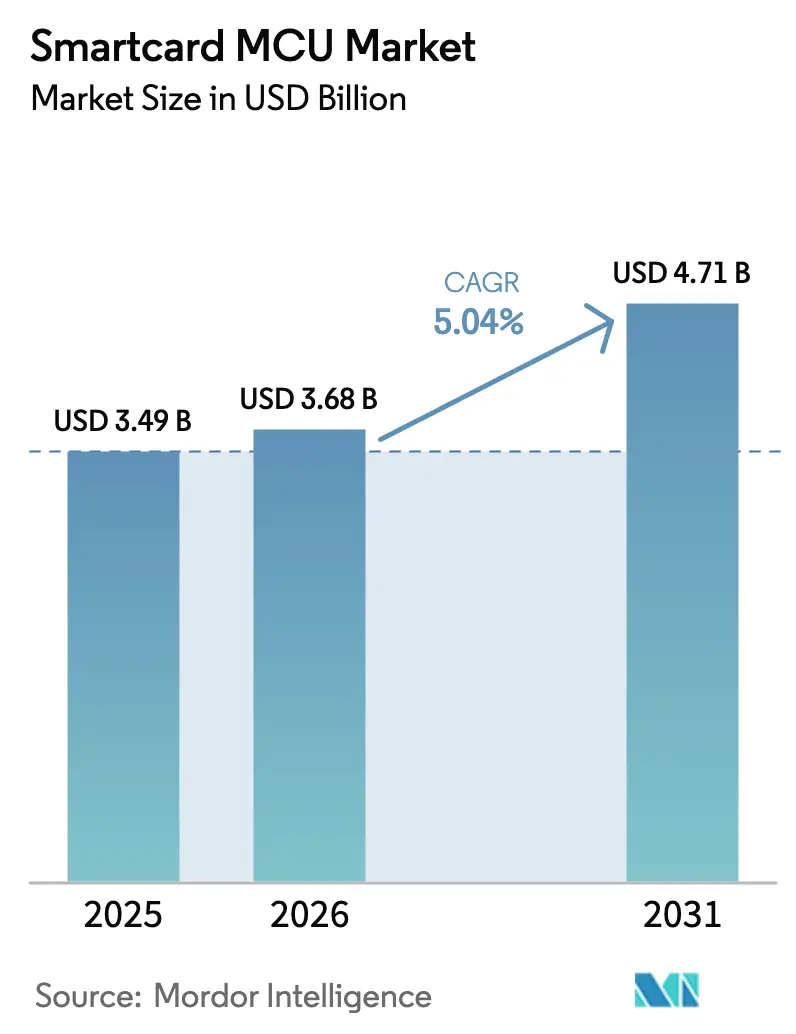
The Smartcard MCU Market size is projected to be USD 3.49 billion in 2025, USD 3.68 billion in 2026, and reach USD 4.71 billion by 2031, growing at a CAGR of 5.04% from 2026 to 2031.
Growth rests on a steady replacement cycle for payment cards, while government-driven digital-identity rollouts, post-quantum cryptography mandates, and biometric dual-interface innovations reshuffle bill-of-materials priorities. Vendors are re-certifying entire product portfolios to Common Criteria EAL6+ and EAL7 levels to satisfy the European Union’s Digital Identity Wallet regulation and multiple central-bank digital-currency pilots. Germany’s December 2024 certification of the first post-quantum-ready secure element accelerated tenders that specify ML-KEM and ML-DSA support. Asia Pacific retains volume leadership thanks to India’s Aadhaar-linked payments rail and China’s domestic substitution agenda, while the Middle East posts the fastest regional CAGR on the back of smart-government programs. On the architecture front, 32-bit devices dominate use cases that require Java Card runtime and Global Platform SCP03 and rising biometric and post-quantum payloads tilt demand toward 128 KB memory densities. Meanwhile, vendors face margin pressure as mobile-wallet substitution curbs fresh issuance in mature markets and Chinese secure-element entrants discount aggressively in domestic bids.
Key Report Takeaways
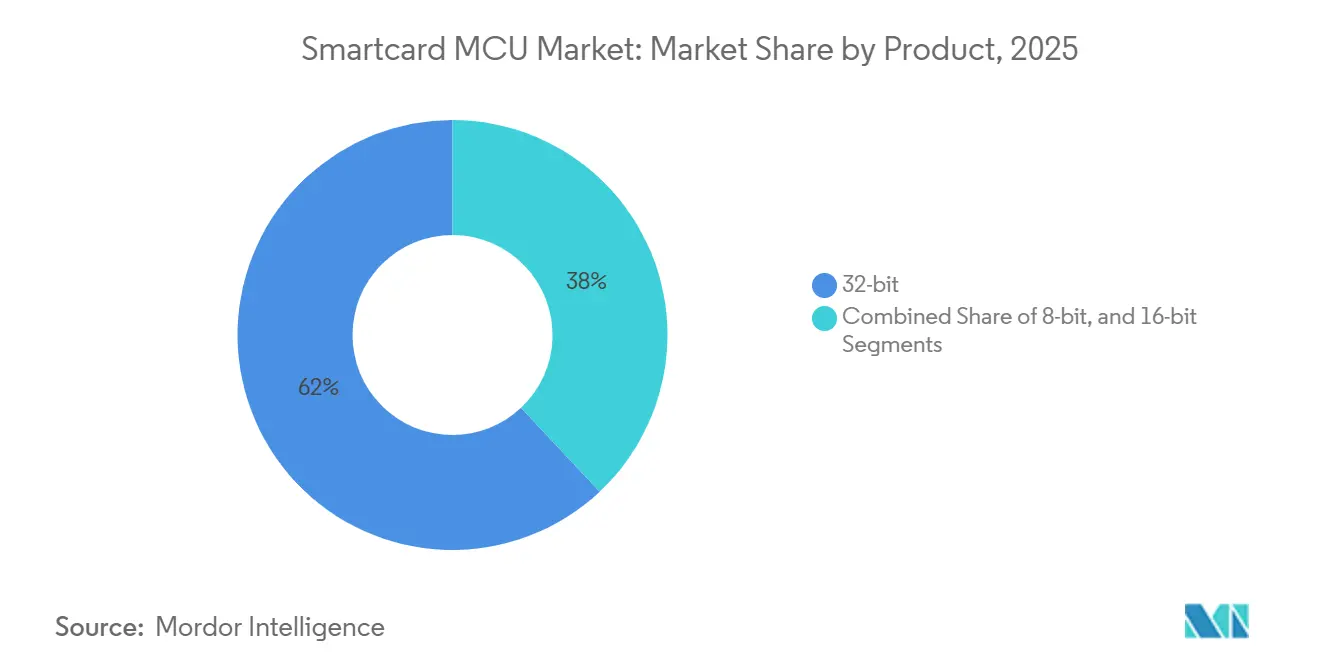
- By product architecture, 32-bit MCUs captured 62.01% revenue share in 2025; 8-bit and 16-bit combined are forecast to trail as 32-bit devices expand at a 5.62% CAGR through 2031.
- By functionality, Security and Access Control led with 44.34% share of the Smartcard MCU market size in 2025 and is advancing at a 6.02% CAGR to 2031.
- By end-user industry, Banking, Financial Services, and Insurance held 38.12% of 2025 revenue, while Government and Healthcare records the highest projected CAGR at 6.55% through 2031.
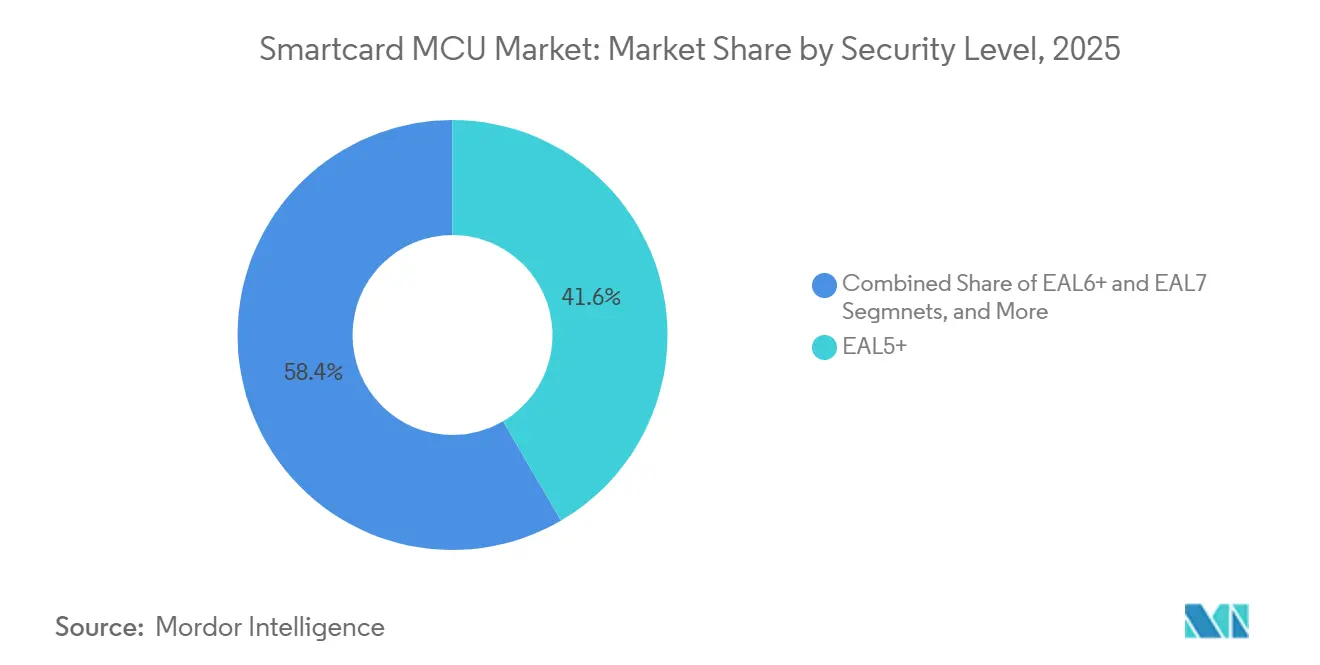
- By security level, EAL5+ retained a 41.58% share in 2025; EAL6+ is the fastest-growing tier with a 5.96% CAGR on post-quantum and critical-infrastructure demand.
- By memory density, 64 KB devices accounted for 39.05% volume in 2025, whereas ≥128 KB variants are projected to rise at a 6.23% CAGR on biometric and post-quantum payload requirements.
- By geography, Asia Pacific commanded a 37.82% Smartcard MCU market share in 2025; the Middle East and Africa is the fastest-expanding region at a 6.74% CAGR through 2031.
Note: Market size and forecast figures in this report are generated using Mordor Intelligence’s proprietary estimation framework, updated with the latest available data and insights as of January 2026.
Global Smartcard MCU Market Trends and Insights
Drivers Impact Analysis*
| Driver | (~) % Impact on CAGR Forecast | Geographic Relevance | Impact Timeline |
|---|---|---|---|
| Migration to EMV-compliant payment cards | +1.20% | Global, with acceleration in Latin America and MEA | Medium term (2-4 years) |
| National e-ID and e-passport roll-outs | +0.90% | Europe and Asia-Pacific core, expanding to MEA | Long term (≥ 4 years) |
| SIM swap to 5G-enabled eSIM form-factors | +0.70% | North America and Europe lead, APAC following | Medium term (2-4 years) |
| Contactless transit fare-collection upgrades | +0.60% | Urban centers globally, concentrated in APAC and Europe | Short term (≤ 2 years) |
| Post-quantum-ready secure element roadmaps | +0.50% | Global, with early adoption in government and defense | Long term (≥ 4 years) |
| Pay-TV smart-card refresh in emerging markets | +0.40% | Latin America, MEA, and select APAC markets | Medium term (2-4 years) |
| Source: Mordor Intelligence | |||
Migration to EMV-compliant payment cards
Mandated chip enablement in Brazil, Mexico, and most Gulf Cooperation Council states moved tens of millions of debit and credit accounts away from magnetic stripe media. Card-issuing banks are standardizing on dual-interface secure elements with larger EEPROM footprints to store dynamic cryptograms, thereby increasing silicon content per unit and raising the per-card ASP despite broader price erosion.[1]EMVCo, “EMV Contactless Specifications for Payment Systems,” EMVCo, Jul 01, 2024, emvco.com.
National e-ID and e-passport roll-outs
The EU Digital Identity Regulation obligates member states to upgrade credentials to EAL6+ secure elements that store biometric images and enable electronic signatures, locking in 10- to 15-year replacement cycles. India’s Aadhaar expansion and Japan’s My Number revamp trigger orders for secure elements that integrate on-card Public Key Infrastructure and multi-application partitioning, widening revenue streams for certification-ready suppliers.[2]European Commission, “Proposal for a Regulation on a Framework for a European Digital Identity,” Official Journal of the European Union, Mar 28, 2024, europa.eu.
SIM swap to 5G eSIM form-factors
Device-integrated eSIMs shift smartcard MCU demand from removable modules to embedded secure elements. Automotive OEMs and premium smartphone brands now pre-provision multiple operator profiles during manufacturing, driving higher non-payment unit volumes and favoring 32-bit cores with ultra-low-power standby modes.[3]GSMA Intelligence, “eSIM Whitepaper: The What, Why and How of eSIM,” GSMA, Mar 10, 2024, gsma.com.
Contactless transit fare-collection upgrades
Mega-city operators in Singapore, Seoul, and London are migrating legacy proprietary transit cards to open-loop EMV architecture, which lifts cryptographic requirements and pushes up controller complexity. Multi-application coexistence (transit, retail, building access) makes flash and RAM capacity decisive design parameters.[4]Transport for London, “Annual Report and Statement of Accounts 2024,” Transport for London, Sep 30, 2024, tfl.gov.uk.
Restraints Impact Analysis*
| Restraint | (~) % Impact on CAGR Forecast | Geographic Relevance | Impact Timeline |
|---|---|---|---|
| Rapid shift toward mobile wallets | -1.40% | Global, most pronounced in developed markets | Short term (≤ 2 years) |
| ASP pressure from Chinese fabs | -0.80% | Global, affecting commodity segments | Medium term (2-4 years) |
| Shortage of certified testing capacity (CC, FIPS) | -0.60% | Global, bottleneck for high-security applications | Medium term (2-4 years) |
| Geopolitical export-control restrictions | -0.50% | US-China trade corridors, spillover to allied markets | Long term (≥ 4 years) |
| Source: Mordor Intelligence | |||
Rapid shift toward mobile wallets
The USD 1 trillion mobile payment milestone in 2024 signals wallet preference for tap-to-pay in North America and Western Europe. Card volumes slide on basic debit portfolios; however, embedded secure elements in phones reclaim part of the silicon demand, altering form-factor mix rather than erasing total addressable volume.[5]Joanna Stavins, “Payments in the Digital Age,” Federal Reserve Bank of Boston Working Paper Series, Sep 15, 2024, bostonfed.org.
ASP pressure from Chinese fabs
Huahong and CEC Huada added 200 mm capacity focused on mature 90 nm nodes and bundle personalization services to undercut incumbents by 15-20%, placing particular stress on 8-bit and 16-bit tiers. Western suppliers reply by fast-tracking 40 nm process migrations and highlighting premium security certifications as a moat.[6]Infineon Technologies AG, “Infineon Reports Fourth-Quarter 2024 Results,” Infineon Press Release, Nov 01, 2024, infineon.com.
*Our forecasts treat driver/restraint impacts as directional, not additive. The impact forecasts reflect baseline growth, mix effects, and variable interactions.
Segment Analysis
By Product: 32-bit architectures underpin cryptographic evolution
32-bit devices accounted for 62.01% of 2025 revenue, and the segment is set to expand at a 5.62% CAGR as transaction latency and cryptographic-throughput requirements climb. This leadership underpins 32-bit control of the Smartcard MCU market size, especially in EMV dual-interface cards, eSIMs, and government e-ID credentials. NXP SmartMX3 and Infineon SLC38 integrate AES, RSA, and ECC engines that clear EMV Level 1 contactless limits while drawing under 100 mW. Post-quantum algorithms further lock in 32-bit supremacy, since lattice math outstrips the instruction headroom of 16-bit alternatives.
Biometric rollouts quicken the pace. Match-on-card algorithms demand 40-60 KB flash and sub-one-second template verification, driving issuers toward ≥128 KB configurations. IDEMIA F.CODE shipments in early 2025 demonstrate the performance bar premium portfolios now expect. Although mobile-wallet substitution trims first-issue volumes in developed economies, the installed base of 20 billion payment cards ensures a resilient replacement flow, stretching refresh cycles from three to five years to defray dual-interface costs.


By Functionality: Security and Access Control Leads Amid Multi-Factor Mandates
Security and Access Control claimed 44.34% of 2025 revenue, rising at a 6.02% trajectory as enterprises retrofit door-controllers and logical-access systems with smartcard-plus-biometric multi-factor flows. The European Union’s NIS2 directive, effective October 2024, obliges critical-infrastructure operators to deploy hardware-rooted credentials, elevating demand for EAL5+-certified chips. Transaction functionality, largely payment cards, matches the overall Smartcard MCU market CAGR, its upside capped by mobile-wallet cannibalization. Communication modules, including eSIMs, accelerate on 5G momentum; GSMA SGP.32 remote-provisioning rules add over-the-air memory overheads that nudge densities from 32 KB to 64 KB.
Functional convergence gathers speed. Transit fare media now co-reside with loyalty and ID applets on a single chip, and national e-ID cards embed digital-signature capabilities for e-government services. STMicroelectronics ST31P450, packing 128 KB EEPROM and sandboxed applet domains, typifies the platform approach that lets issuers monetize spare capacity via value-added services.
By End-User Industry: Government and Healthcare Surge on Digital Identity Mandates
Government and Healthcare is the fastest-growing vertical at 6.55% as electronic-health-record legislation in Germany, France, and Japan requires on-card key storage. Germany’s e-patient record went live in January 2025, issuing 73 million smartcards certified to EAL4+ today, with mandated post-quantum support by 2028. The EU Digital Identity Wallet alone underwrites more than 350 million credentials, giving the segment a long demand tail.
Banking, Financial Services, and Insurance holds 38.12% share but faces wallet-driven margin squeeze. Card-funded wallet transactions rose 10.91% year-on-year in 2025, muting re-issuance urgency. Telecommunications sees steady volume as eSIM adoption climbs: over 2 billion capable devices shipped in 2025. Retail, Transportation, and Education track overall growth yet lack the regulatory catalysts that pump the government pipeline.
By Security Level: EAL6+ Ascends on Post-Quantum and Critical-Infrastructure Needs
While EAL5+ commands a dominant 41.58% share, EAL6+ is witnessing the fastest growth, boasting a notable 5.96% CAGR. This surge is largely driven by heightened demands from regulators and central banks for stringent safeguards against side-channel leakage. The increasing focus on cybersecurity and data protection in critical applications has amplified the need for higher assurance levels, making EAL6+ certifications a key differentiator in the market. In a significant move, NXP's EdgeLock SE052F, which received EAL6+ certification in October 2024, is now eyeing the automotive and industrial sectors.
These sectors prioritize security, especially against threats like arbitrary code execution and covert channels, as they operate in environments where reliability and safety are paramount. However, the landscape is challenging: globally, fewer than 20 accredited labs are equipped to handle EAL6+ evaluations. This scarcity extends lead times to a lengthy 18-24 months, creating bottlenecks in the certification process. As a result, suppliers with pre-certified platforms gain a strategically advantageous position, enabling them to address market demands more swiftly and effectively. The limited evaluation capacity underscores the importance of early investments in certification processes to secure a competitive edge in this evolving market.
By Memory Density: High-Capacity Chips Gain Traction
In 2025, 64 KB parts accounted for 39.05% of the total, highlighting their significant presence in the market. However, parts with densities of 128 KB and above are projected to grow at a compound annual growth rate (CAGR) of 6.23%, indicating a shift in demand toward higher-density components. The increasing size of post-quantum public keys is a critical factor driving this trend. For instance, ML-KEM public keys require 1.3 KB, while ML-DSA public keys demand 2.6 KB. These sizes far exceed the footprints of ECC-256, creating additional pressure on the 64 KB Secure Operating Areas (SOAs) to accommodate such requirements. Biometric dual-interface cards further exacerbate this challenge. These cards already consume 40-60 KB of memory for storing fingerprint templates, leaving minimal space for firmware updates or the integration of value-added applets. This limitation has made higher-density memory options more appealing, with issuers willing to pay a premium for the additional capacity to meet evolving requirements. Simultaneously, advancements in semiconductor foundries have played a pivotal role in reducing the cost disparity between 64 KB and 128 KB dies.
The cost difference, which stood at 25% in 2020, is expected to decline to below 20% by 2025. This reduction in cost has lowered the barriers to adoption for higher-density components, enabling issuers to transition more seamlessly to these advanced solutions. As a result, the market is witnessing a gradual but steady shift toward higher-density memory parts to address the growing demands of modern applications.
Geography Analysis
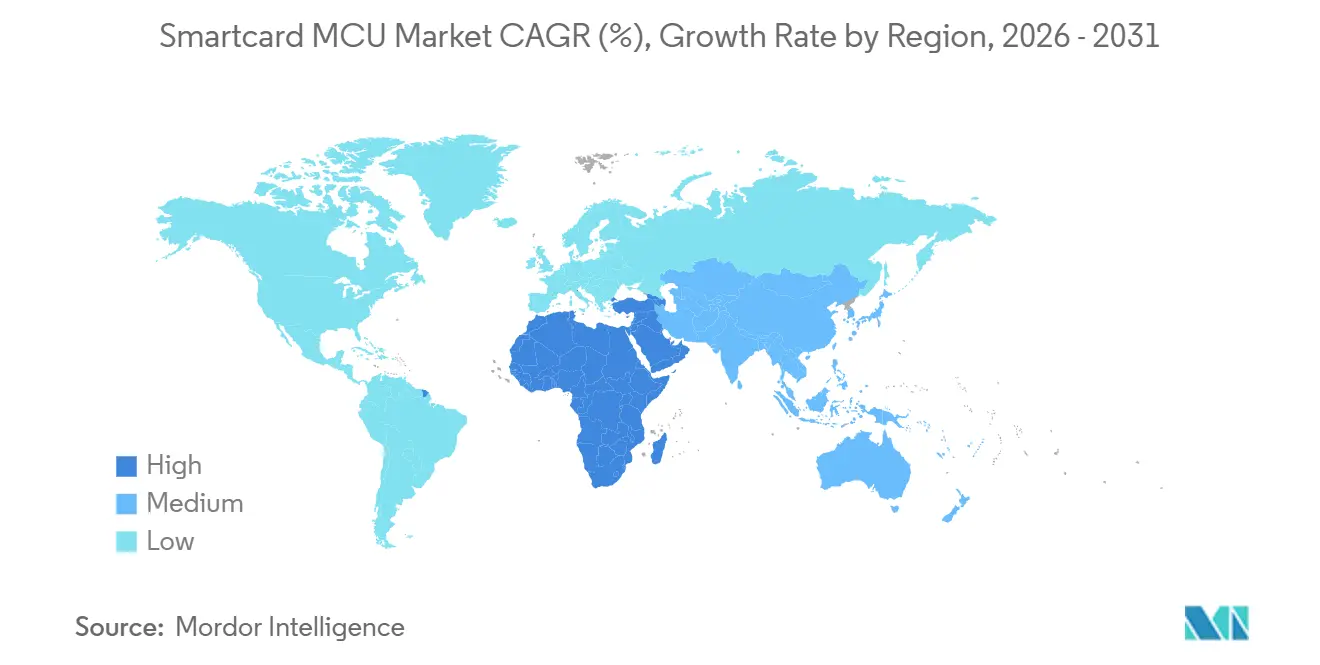
Asia Pacific controlled 37.82% of 2025 revenue, its scale anchored by India’s Aadhaar payments rail and China’s secure-element self-reliance push. China’s Ministry of Public Security endorses CEC Huada and Beijing Fudan Microelectronics parts for a market of 1.4 billion national IDs, locking Western vendors out of one of the largest credential pools. India’s Unified Payments Interface processed 16.7 billion transactions in December 2025, reinforcing demand for domestic-fabricated RuPay dual-interface cards, even as Chinese entrants test price competitiveness. Japan and South Korea add to the regional total with post-quantum passport upgrades and full contactless mandates, respectively.
The Middle East and Africa posts the highest 6.74% CAGR. Saudi Arabia’s Absher platform and the UAE’s biometric Emirates ID bundle secure elements across e-government and transit credentials, with national cybersecurity agencies stipulating EAL5+ minimums. Turkey pilots mobile digital IDs that lean on eSIM secure elements, illustrating regional appetite for hybrid credential schemes.
Europe benefits from the Digital Identity Wallet regulation that compels member-state issuance by 2026. Germany’s e-patient cards and France’s biometric Carte Vitale updates amplify public-sector orders. North America trails on public-ID momentum yet records steady payment-card replacement and industrial secure-boot demand. Latin America shows high EMV thesis but faces wallet erosion in urban hubs, while Africa’s adoption concentrates in South Africa and Nigeria, where financial-inclusion projects rely on EAL4+ chips to balance security with unit economics.

Regulatory Landscape
Security certification and payment interoperability standards continue to set the minimum bar for smartcard MCUs across ID, payment, and access credentials. In the European Union, the Cyber Resilience Act, Regulation (EU) 2024/2847, entered into force on 10 December 2024, and it pushes the market toward formal conformity assessment for products categorized as critical. Smartcards are explicitly pulled into the stricter compliance expectations ahead of full applicability on 11 December 2027. Parallel standardization work is also progressing through draft harmonized standards such as prEN 50764:2026 for smartcard platforms, alongside related drafts for security and tamper-resistant MCUs. This feeds directly into roadmap priorities around secure boot, vulnerability handling, and lifecycle update mechanisms.
Government identity frameworks and assurance schemes further guide silicon selection toward higher security levels and post-quantum readiness. In the United States, NIST released initial working drafts on 12 June 2026 for updates to PIV standards (SP 800-73-6 and SP 800-78-6) to incorporate post-quantum algorithms ML-KEM and ML-DSA, pushing credential ecosystems toward dual-stack cryptography and larger memory footprints. Certification signals in early 2026, including PayCert certification for STMicroelectronics STeID Java Card eMRTD and EMVCo CCD LoA certification for TongXin Microelectronics TMCOS V4.0.2, underscore that compliance with ICAO Doc 9303, ISO/IEC 14443, and EMVCo programs remains a procurement prerequisite for passport and payment-adjacent deployments.
Competitive Landscape
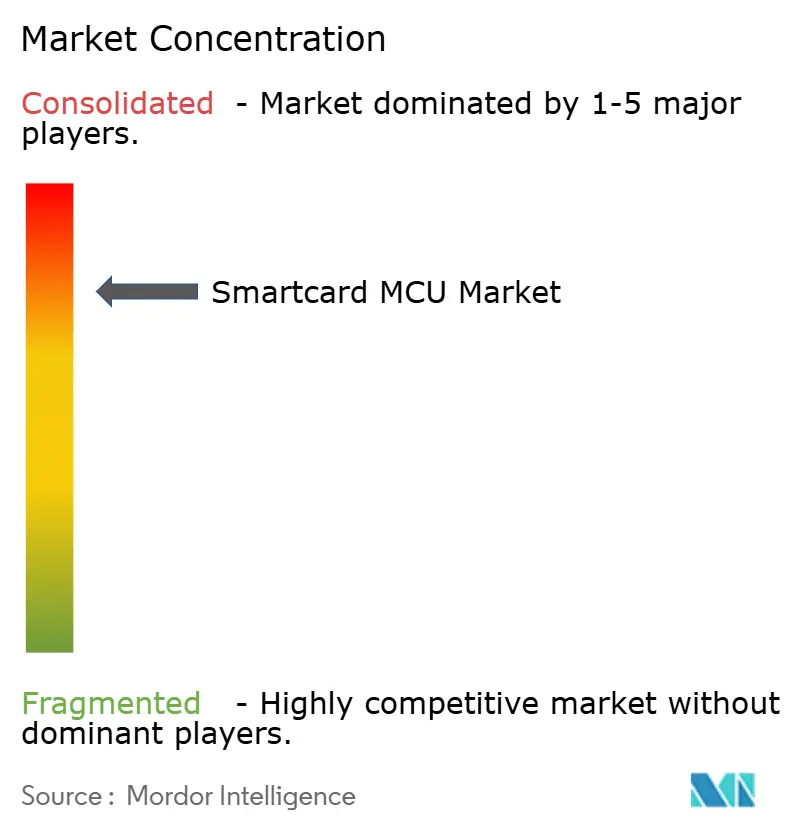
The Smartcard MCU market tilts moderately consolidated. NXP Semiconductors, Infineon Technologies, and STMicroelectronics together control roughly 60% of 32-bit shipments, fortified by decades of Common Criteria expertise and entrenched links to card bureaus such as IDEMIA, Thales, and Giesecke and Devrient. Chinese challengers CEC Huada, Beijing Fudan Microelectronics, and Shanghai Huahong erode share in domestic tenders with 20-30% price discounts, but process-node ceilings above 28 nm hobble their entry into post-quantum and biometric tiers.
Western incumbents defend premium lanes through bundled lifecycle-management software, EAL6+ or EAL7 certifications, and readiness for ML-KEM and ML-DSA standards. Ecosystem plays intensify as vendors such as NXP pair with Fingerprint Cards for hardware-sensor synergy, while IDEMIA packages end-to-end smartphone enrolment services that monetize beyond silicon. The scarcity of EAL6+ labs further cements incumbency, as firms able to parallel-stream firmware variants through certification can refresh portfolios faster than new entrants queued for evaluation.
White-space opportunities lie in biometric dual-interface cards and post-quantum wallets. Vendors that integrate secure elements, sensors, and remote-update stacks under one SKU can claim a 15-20% price premium in high-assurance tenders. The competitive narrative thus migrates from MHz and KB specs toward firmware agility and service hooks that lower issuers’ total cost of ownership across multi-million card estates.
Smartcard MCU Industry Leaders
NXP Semiconductors N.V.
Infineon Technologies AG
STMicroelectronics N.V.
Renesas Electronics Corporation
Microchip Technology Incorporated
- *Disclaimer: Major Players sorted in no particular order

Market Opportunities and Future Outlook
White-space is tightening around higher-assurance and higher-memory smartcard MCUs that can support post-quantum cryptography, biometric applets, and multi-application wallet stacks under formal certification constraints. The EU Cyber Resilience Act timeline, together with draft CRA harmonized standards such as prEN 50764:2026, is encouraging vendors and card ecosystem partners to refresh secure-element platforms with stronger vulnerability-management and update provisions. This aligns with demand growth for EAL6+ and above in government and critical-infrastructure credentials.
A second opportunity is the convergence of identity and payments across cards, wearables, and embedded form factors, which increases the need for interoperable credential specifications and secure provisioning. EMVCo actions in 2026, including public review activity around digital payment credential specifications and updates to EMV contactless chip requirements, create additional silicon headroom in secure elements as issuers and OEMs implement tokenized and credential-based authentication. Supply-chain localization initiatives also expand sourcing and capacity options across the ecosystem, reinforced by IDEMIA Secure Transactions inauguration of a Vitré, France facility aligned to a 100% European smartcard value chain by 2026 (with 28 nm technology developed with GlobalFoundries), and STMicroelectronics commencing volume production of China-manufactured STM32 microcontrollers via Huahong in March 2026. Together, these moves show how regional manufacturing strategies are being used to meet procurement and resilience objectives.
Recent Industry Developments
- June 2026: STMicroelectronics introduced the ST54M secure mobile chip combining NFC, secure element, and eSIM functions and adding a hardware accelerator aligned to post-quantum cryptography algorithms (ML-KEM and ML-DSA). The single-die integration targets smartphones and connected devices that need both connectivity credentials and payment-grade security, raising the bar for multi-application secure-element MCUs and related certification programs.
- May 2025: Multos International released the MULTOS STEP/ONE SC4-P20 series for entry-level EMV and identity smartcards, built on the Infineon SLE77 security controller. The launch expands the availability of certified, lower-cost profiles for card issuers and bureaus, supporting volume programs where bill-of-materials pressure is highest.
- November 2024: GlobalFoundries and IDEMIA Secure Transactions announced work to enable next-generation smart card ICs on GlobalFoundries 28ESF3 platform in Dresden, with mass production plans tied to 2026. The initiative strengthens a Europe-centered manufacturing option for secure elements, aligning procurement with sovereignty requirements while expanding access to an advanced node used in secure IC roadmaps.


Research Methodology Framework and Report Scope
Market Definition and Coverage
In this methodology, the market covers revenue generated from smartcard microcontroller units that are built into secure cards used for identity, payment, telecom, access control, and similar use cases across regions.
Scope exclusions: We exclude non-MCU secure elements, general-purpose MCUs not designed for smartcard form factors, and purely software security tools that do not ship as smartcard silicon.
Segmentation Overview
- By Product
- 8-bit
- 16-bit
- 32-bit
- By Functionality
- Transaction
- Communication
- Security and Access Control
- By End-User Industry
- Banking, Financial Services and Insurance (BFSI)
- Telecommunications
- Government and Healthcare
- Education
- Retail
- Transportation
- Other End-User Industries
- By Security Certification Level
- Common Criteria EAL4+
- EAL5+
- EAL6+
- EAL7
- By Memory Density
- ≤16 FB
- 32 KB
- 64 KB
- ≥128 KB
- By Geography
- North America
- United States
- Canada
- Mexico
- South America
- Brazil
- Argentina
- Rest of South America
- Europe
- Germany
- United Kingdom
- France
- Italy
- Spain
- Russia
- Rest of Europe
- Asia Pacific
- China
- Japan
- India
- South Korea
- Rest of Asia Pacific
- Middle East
- Saudi Arabia
- United Arab Emirates
- Turkey
- Rest of Middle East
- Africa
- South Africa
- Nigeria
- Rest of Africa
- North America
Data Sources, Market Sizing, and Validation
Desk Research
Desk work starts by mapping the demand pools where smartcard MCUs are consumed, and then linking them to measurable signals that can be checked over time. We referred to public sources such as ISO and ISO-IEC standards documentation for card interfaces, NIST publications for security guidance, ITU indicators for telecom connections that influence SIM volumes, and UN Comtrade for trade flows that help explain regional electronics movement. For payments and identity rollouts, we also reviewed central bank and government program updates where available, along with customs notes and press releases from major issuing ecosystems.
To convert those signals into a revenue model, we supplemented public data with company filings, investor presentations, and reputable industry news to understand shipment trends, product mix shifts, and pricing direction. Select paid database subscriptions were used only for company financial intelligence, patent tracking, and limited shipment-level import and export checks where public series had gaps. The sources listed here are illustrative only, and many additional public documents and datasets were reviewed for data collection, cross-checks, and clarification.
Primary Interviews and Surveys
Primary work was used to validate how much smartcard issuance translates into MCU demand, and how pricing changes across card types and security grades. We spoke with a mix of chip suppliers, module and card ecosystem participants, and large institutional buyers, then used follow-up calls to test assumptions on certification cycles, regional mix, and supply constraints. Since this is a global market, input was balanced across APAC, EMEA, and the Americas to avoid over-weighting one issuing environment.
Distribution of primary research fieldwork respondents
| Company type | Respondent position | Region |
|---|---|---|
| Top tier: 36% | CXOs: 13% | APAC: 45% |
| Mid tier: 50% | Functional/Unit leaders: 29% | EMEA: 31% |
| Smaller Players: 14% | Managers: 58% | Americas: 24% |
Market-Sizing & Forecasting
The sizing starts with a top-down demand pool build where smartcard issuance and installed base indicators are translated into MCU consumption, and then converted to value using realistic average selling price bands by security level and card type. What keeps the model practical is that a few core levers are updated consistently, including payment and ID card issuance momentum, SIM and eSIM transition pace, contactless adoption rate, certification and compliance cycles (for example, ISO-IEC and common criteria related steps), and the mix shift toward higher memory and higher security parts. Where public numbers are reported at a higher level, we apply allocation keys that are checked through interviews and supported by observable regional programs.
Those totals are then corroborated using selective bottom-up approximations, such as rolling up a sampled set of supplier revenue disclosures, comparing implied unit volumes against trade and manufacturing signals, and running channel checks on typical MCU content per card. When there are data gaps in smaller regions or niche applications, we carry forward conservative penetration assumptions until they can be re-tested with new primary inputs.
For forecasting, we used scenario analysis supported by trend smoothing on the most stable series, then adjusted the path using expert expectations on issuance cycles, pricing erosion versus security upgrades, and macro drivers that influence card replacement rates. The output is kept traceable so that a junior analyst can explain each input back to a real demand or supply signal.
Data Validation & Update Cycle
Triangulation is done by comparing the model outputs with independent signals, such as smart card shipment momentum, regional program announcements, and the direction of semiconductor supply constraints that affect secure MCU availability. Outliers are flagged when growth or price movement deviates from what is supported by issuance cycles, trade direction, or the interview feedback, and then the assumptions are reworked before sign-off.
A second analyst review is completed to confirm that definitions, units, currency treatment, and time alignment are consistent across regions. Reports are refreshed annually, and interim updates are made when there are material events like major policy rollouts, a sudden supply shock, or a large shift in card technology mix. Before delivery, a final pass is done so the analysis reflects the latest verifiable data points.
Mordor Intelligence's Global Smartcard Mcu Market Size Versus Other Published Estimates
Published market sizes for smartcard MCUs can differ even when the product name looks the same, because the underlying scope and conversion logic are not always aligned. Differences usually come from what is counted as a smartcard MCU, whether adjacent secure-element silicon is included, and how units are converted into value through pricing assumptions.
By tracking certification-driven product mix changes and refreshing ASP bands by region and security grade, Mordor Intelligence keeps the smartcard MCU total tied to card issuance and replacement cycles, which reduces accidental double counting with secure elements or broader embedded MCUs.
Benchmark comparison
| Source | Market Size | Gaps in Research Methodology |
|---|---|---|
| Mordor Intelligence | USD 3.68 B (2026) | |
| Global Publisher A | USD 3.60 B (2024) | Uses a different base year and appears to anchor value on a 2024 snapshot, which can understate the 2026 level if issuance rebounds and higher-security parts take a larger share. The scope may also blend in some secure-element revenue that does not ship as an MCU-based smartcard part. |
| Industry Report B | USD 7.60 B (2025) | Likely applies a wider product boundary that pulls in broader smartcard silicon or embedded security controllers beyond MCU-based cards, and then prices the mix at higher average values. Faster growth assumptions over longer horizons can also lift the stated 2025 number if aggressive adoption paths are used. |
The spread across the three values is mainly explained by definition boundaries and the year used for the stated market size, followed by how pricing is treated when security requirements step up. Our approach stays repeatable because each uplift is linked back to issuance, replacement behavior, and a clearly stated ASP logic that can be rechecked as programs and standards evolve.


Key Questions Answered in the Report
What is the projected value of the Smartcard MCU market by 2031?
The market is forecast to reach USD 4.71 billion by 2031.
Which region is expanding the fastest in Smartcard MCU adoption?
The Middle East and Africa is advancing at a 6.74% CAGR through 2031, driven by smart-government ID and transit projects.
Why are 128 KB secure elements gaining traction?
Biometric templates and post-quantum keys crowd 64 KB parts, so issuers adopt 128 KB chips to future-proof credentials despite a modest cost premium.
How does mobile-wallet growth affect physical payment cards?
Mobile wallets funded 56% of global card-present transactions in 2025, suppressing new card issuance in mature markets and narrowing margins for standard contactless cards.
Which certification tier is growing the fastest?
Common Criteria EAL6+ shows the highest growth as governments and critical-infrastructure operators demand formal proofs against side-channel attacks.
Who are the leading Smartcard MCU suppliers?
NXP Semiconductors, Infineon Technologies, and STMicroelectronics collectively hold about 60% of global 32-bit secure-element shipments.
Page last updated on:






