
Servo Motor Market Size and Share
Market Overview
| Study Period | 2020 - 2031 |
|---|---|
| Market Size (2026) | USD 15.38 Billion |
| Market Size (2031) | USD 20.14 Billion |
| Growth Rate (2026 - 2031) | 5.53 % |
| Fastest Growing Market | Africa |
| Largest Market | Asia Pacific |
| Market Concentration | Medium |
Major Players *Disclaimer: Major Players sorted in no particular order Image © Mordor Intelligence. Reuse requires attribution under CC BY 4.0. | |
Servo Motor Market Analysis by Mordor Intelligence
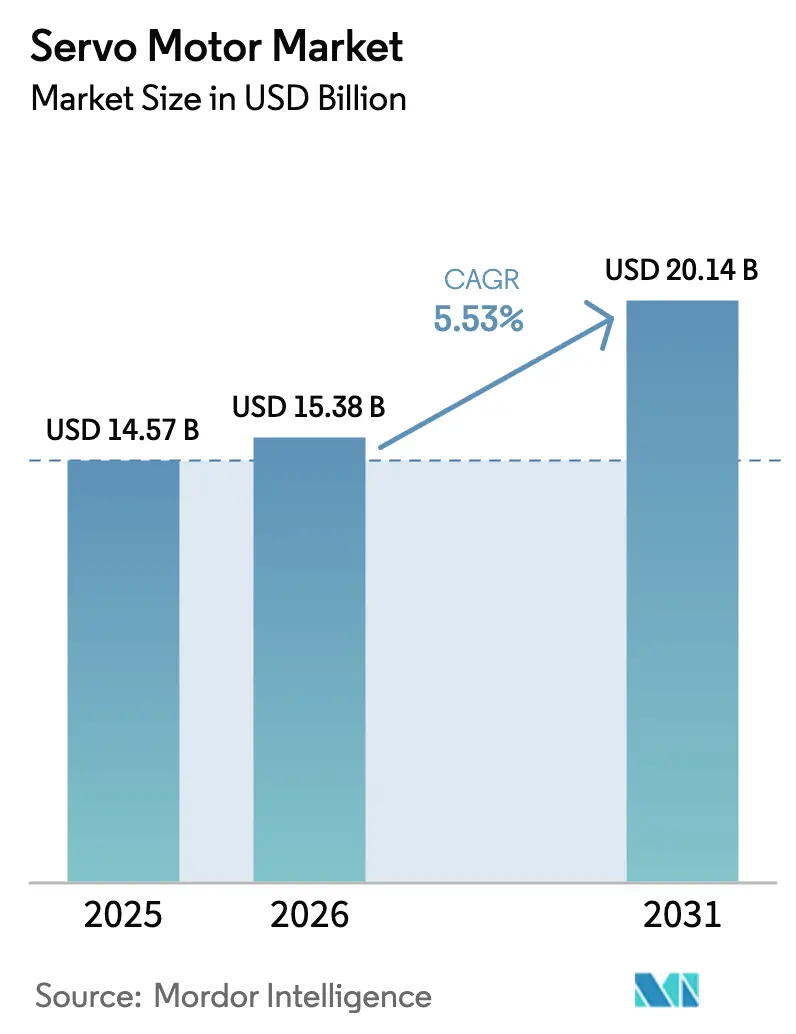
The Servo Motor Market size is expected to increase from USD 14.57 billion in 2025 to USD 15.38 billion in 2026 and reach USD 20.14 billion by 2031, growing at a CAGR of 5.53% over 2026-2031. This expansion is driven by a shift from volume-led installations to precision, digitally networked motion-control platforms, which carry higher unit prices. Tighter efficiency mandates introduced by IEC 61800-9-2:2025 are catalyzing the replacement of legacy drives with premium IE4 and IE5-rated units, while real-time diagnostics and energy compliance have overtaken upfront cost as the primary purchase criteria. High-volume electronics assembly in Asia Pacific, rising cobot deployments, and the integration of edge AI analytics are driving further reinforcement of demand, even as supply-chain risks surrounding rare-earth magnets and cybersecurity continue to shadow growth prospects.
Key Report Takeaways
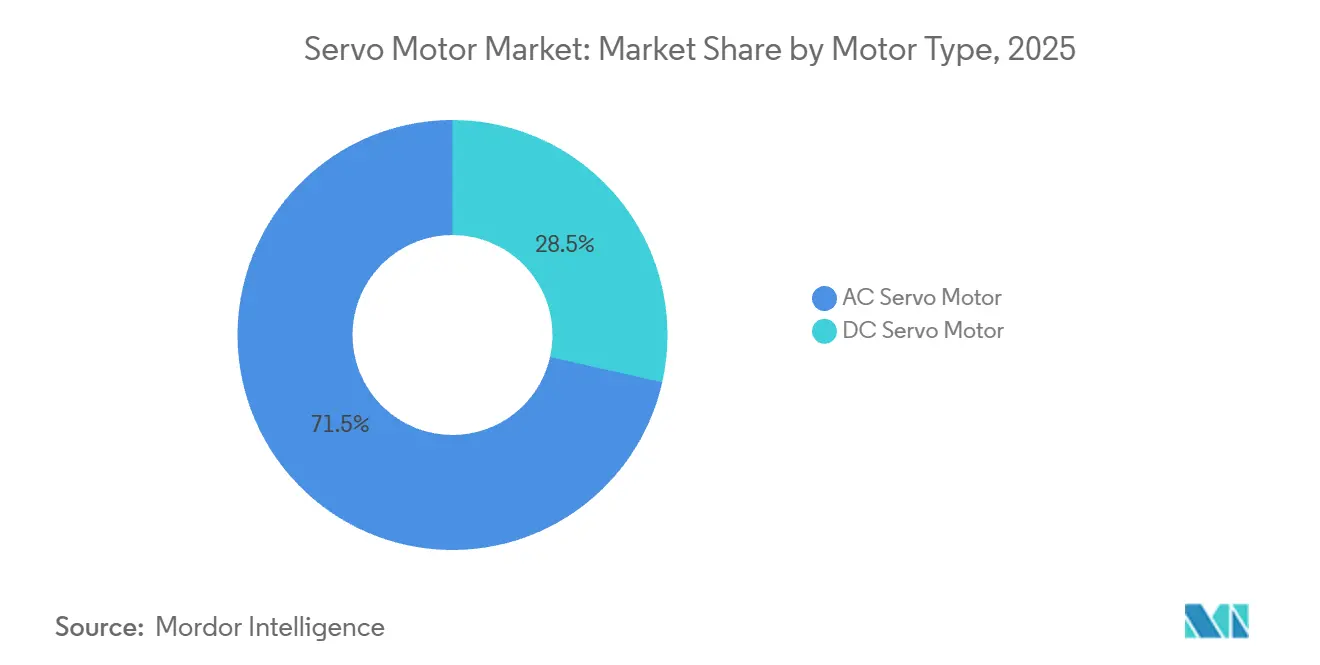
- By motor type, AC servo motors led with 71.47% revenue share in 2025; brushless DC variants are projected to expand at a 6.47% CAGR through 2031.
- By axis configuration, single-axis systems accounted for 63.41% of the servo motor market share in 2025, whereas multi-axis solutions are forecast to post a 7.32% CAGR.
- By power rating, the 750-watt to 2-kilowatt band held a 38.27% share of the servo motor market size in 2025, while units above 2 kilowatts are advancing at an 8.12% CAGR.
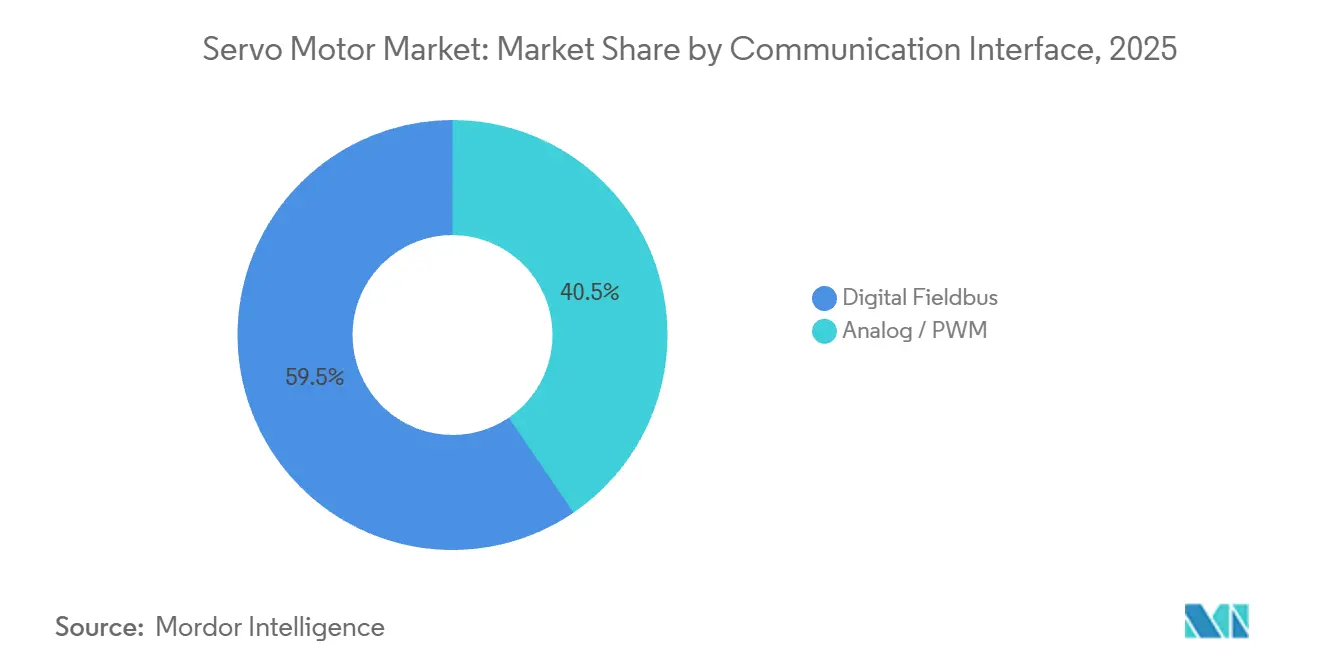
- By communication interface, digital fieldbus networks captured 59.53% of 2025 installations; at 6.32% CAGR, they remain the fastest-growing connectivity option.
- By end-user industry, automotive represented 24.63% of 2025 demand, yet electronics and semiconductor manufacturing is set to grow at an 8.13% CAGR to 2031.
- By geography, the Asia Pacific commanded 43.74% of global revenue in 2025, whereas Africa is expected to log the highest 8.13% CAGR during the forecast window.
Note: Market size and forecast figures in this report are generated using Mordor Intelligence’s proprietary estimation framework, updated with the latest available data and insights as of January 2026.
Market Trends and Insights
Drivers Impact Analysis of Servo Motor Market*
| Driver | (~) % Impact on CAGR Forecast | Geographic Relevance | Impact Timeline |
|---|---|---|---|
| Adoption of International Energy-Efficiency Standards | +0.9% | Europe, Asia Pacific, North America | Medium term (2-4 years) |
| Industry-Wide Drive Toward Smart and Flexible Automation | +1.2% | Global, with concentration in Asia Pacific and Europe | Long term (≥4 years) |
| Rising Deployment of Industrial and Collaborative Robots | +1.1% | Asia Pacific, North America, Europe | Medium term (2-4 years) |
| Integration of Servo Drives with Edge AI Chips for On-motor Analytics | +0.7% | North America, Europe, Asia Pacific (Japan, South Korea) | Long term (≥4 years) |
| Miniaturized Servo Solutions for Medical Exoskeletons | +0.3% | North America, Europe, Japan | Long term (≥4 years) |
| High-Torque Servo Use in Autonomous Agricultural Equipment | +0.5% | North America, Europe, Brazil, Australia | Medium term (2-4 years) |
| Source: Mordor Intelligence | |||
Adoption Of International Energy-Efficiency Standards
IEC 61800-9-2:2025 established IE4 and IE5 benchmarks, forcing vendors to redesign windings, magnets, and firmware to lower drivetrain losses. EU member states are expected to embed the standard in public procurement rules by mid-2025, triggering large-scale retrofits in municipal water networks. Japan and South Korea linked tax credits to compliance, accelerating adoption across automotive paint shops and semiconductor fabs. The rule also mandates the disclosure of full-load efficiency curves, shifting competition from sticker price to life-cycle operating costs. North America is lagging but is likely to catch up as the U.S. Department of Energy references the standard in its 2027 rulemaking.[1]U.S. Department of Energy, “Notice of Intent for 2027 Appliance Efficiency Rulemaking,” energy.gov
Industry-Wide Drive Toward Smart And Flexible Automation
Manufacturers are abandoning hard-tooled transfer lines for reconfigurable work-cells equipped with servo-driven gantries and cobots connected over deterministic Ethernet. Operational industrial robots reached 4.28 million units by the end of 2023. EtherCAT penetration among German machine builders reached 62% in 2024, underscoring the shift toward distributed-clock motion networks. Edge AI chips mounted on drives are predicting bearing failures up to 30 days in advance, cutting unplanned stoppages by 40% in pilot lines. The servo motor market, therefore, benefits not only from mechanical precision but from data-driven uptime improvements.
Rising Deployment Of Industrial And Collaborative Robots
Robot installations hit 541,302 units in 2023, with cobots expanding 28% year-on-year. Each cobot integrates four to six synchronized servo axes capable of sub-millisecond loop closure, driving multi-axis drive demand. Japan earmarked USD 450 million in subsidies for SME cobot adoption, provided installations use servo-driven joints. Semiconductor back-end lines now achieve 120 placements per minute thanks to high-speed servo delta robots, roughly doubling pneumatic throughput. The performance delta is locking in servos as the default actuation technology for precision assembly.
Integration Of Servo Drives With Edge AI Chips For On-Motor Analytics
Embedding inference processors directly on drives eliminates cloud latency and secures operational data on-premise, aligning with IEC 62443 cybersecurity zones. Siemens and Rockwell Automation plan to ship drives carrying NVIDIA Jetson Thor modules from 2026 onward. German supplier Synapticon already delivered 15,000 AI-enabled drives in 2025 to packaging OEMs, auto-tuning PID gains as product weight varies. Analog Devices’ mixed-signal controller integrates PWM generation and TensorFlow Lite, opening sub-1-kilowatt servos to AI features. Competitive focus is pivoting from torque density to software-defined adaptability, expanding the addressable value pool for the servo motor market.
Restraints Impact Analysis of Servo Motor Market*
| Restraint | (~) % Impact on CAGR Forecast | Geographic Relevance | Impact Timeline |
|---|---|---|---|
| Proliferation of Low-Cost Stepper and BLDC Alternatives | -0.6% | Asia Pacific, South America, Africa | Short term (≤2 years) |
| High Upfront Capital Expenditure for Multi-Axis Servo Systems | -0.5% | Global, acute in South America and Africa | Medium term (2-4 years) |
| Rare-Earth Magnet Supply Risks Amid Geopolitical Tensions | -0.7% | Global, with acute impact in North America and Europe | Long term (≥4 years) |
| Cyber-Security Concerns in Networked Motion Control | -0.3% | North America, Europe, Asia Pacific (Japan, South Korea) | Medium term (2-4 years) |
| Source: Mordor Intelligence | |||
Proliferation Of Low-Cost Stepper And BLDC Alternatives
Open-loop stepper and sensor-based BLDC motors cost 40-60% less than servo systems, a gap that appeals to price-sensitive buyers in Africa and South America. Chinese suppliers shipped over 12 million steppers in 2024, primarily for use in servicing 3D printers, CNC routers, and textile machinery. Texas Instruments’ USD 5 encoder IC blurs the line by adding closed-loop feedback to BLDC motors. As a result, servo adoption is deferred in cost-elastic markets by up to three years.
Rare-Earth Magnet Supply Risks Amid Geopolitical Tensions
China processes roughly 90% of the global neodymium and dysprosium, and the tightening of export quotas in mid-2024 led to a 35% increase in dysprosium prices. Western manufacturers responded by stockpiling magnets and financing recycling plants; however, supply security remains tenuous until domestic mines scale up after 2028.[2]U.S. Geological Survey, “Mineral Commodity Summaries – Rare Earths,” usgs.gov Torque-dense ferrite and reluctance designs are under evaluation, but they lag behind permanent-magnet servos by 15-20% in power density, hindering near-term substitution.
*Our forecasts treat driver/restraint impacts as directional, not additive. The impact forecasts reflect baseline growth, mix effects, and variable interactions.
Servo Motor Market Segment Analysis
By Motor Type:
Brushless DC Gains Momentum Amid Miniaturization NeedsBrushless DC motors accounted for the fastest-growing share within the servo motor market, advancing at a 6.47% CAGR as medical, agricultural, and mobile-robot OEMs prioritize compact form factors. AC counterparts still dominated with 71.47% revenue share in 2025, reflecting their hold on heavy industrial processes that tap three-phase grids. Battery-powered surgical robots and exoskeletons favor frameless BLDC units, while silicon-carbide inverters narrow the efficiency gap to legacy induction platforms.
AC designs nonetheless retain an advantage in regenerative energy recovery, a decisive feature in vertical-axis CNC and high-bay crane applications. Vendors such as Yaskawa integrated 23-bit encoders and silicon-carbide drives into next-gen AC platforms, extending mean time between failures to 100,000 hours and reinforcing their presence in the servo motor market.


By Axis Configuration:
Multi-Axis Solutions Ride The Cobot WaveSingle-axis systems still accounted for 63.41% of installations in 2025, primarily used for conveyor indexing and valve actuation tasks. Yet, multi-axis architectures are expanding at a 7.32% CAGR, propelled by cobots that require six coordinated joints. EtherCAT and PROFINET backbones deliver sub-microsecond synchronization across axes, enabling compliant motion without the need for cages.
Automotive welding lines are transitioning from fixed spot guns to multi-axis gantries that adapt in real-time to panel distortion. Siemens launched turnkey packages integrating vision guidance with multi-axis drives, reducing programming labor by 60% and deepening penetration of the servo motor market.
By Power Rating:
High-Power Band Accelerates On Autonomous EquipmentThe 750 W–2 kW class remained the largest slice at 38.27% of the servo motor market size in 2025, though >2 kW units are accelerating at 8.12% CAGR. Autonomous tractors employ 5 kW servos to maintain down-force in variable soil, illustrating the torque demands in precision farming. High-tonnage metal presses and injection-molding machines likewise favor liquid-cooled 10-kW drives that meet IE5 efficiency with silicon-carbide inverters.
Thermal management challenges escalate above 2 kW, prompting the adoption of water-cooled designs that carry a 15-20% price premium yet deliver lifecycle savings through lower electricity consumption. Sub-750 W motors, by contrast, thrive in exoskeletons and lab automation where inertia and footprint drive selection.
By Communication Interface:
Digital Fieldbus Becomes De-Facto StandardDigital fieldbus protocols held a 59.53% share in 2025 and are growing at a rate of 6.32% annually, reflecting the demand for deterministic multi-axis coordination. EtherCAT processes frames on the fly, synchronizing 100 axes within 1 ms, a prerequisite for semiconductor wafer handling.[3]SEMI, “Semiconductor Equipment Market Statistics,” semi.org PROFINET’s backward compatibility with legacy PROFIBUS networks eases migration.
Analog and PWM lines persist in low-complexity tasks but face obsolescence as IEC 62443 security rules require encrypted traffic that analog cannot provide. Rockwell’s 2025 launch of a drive verifying position commands via digital signatures underscores how cybersecurity accelerates fieldbus uptake.
By End-User Industry:
Electronics And Semiconductor Leapfrog AutomotiveAutomotive held 24.63% of demand in 2025; however, electronics and semiconductor plants are expanding at a segment-best 8.13% CAGR, as sub-10 nm nodes and advanced packaging push precision requirements upward. Lithography steppers utilize nanometer-level stages driven by high-torque servos, accounting for approximately 18% of wafer-fabrication equipment costs.
Surface-mount lines in China, South Korea, and Taiwan utilize servo delta robots, achieving 120 placements per minute, which far outpaces pneumatic pickers and secures higher ASPs for servo vendors. Mature verticals, such as oil and gas, remain hydraulic-centric, although pilot retrofits show 15-20% energy savings with servo drives on centrifugal pumps.
Geography Analysis
APAC Servo Motor Market
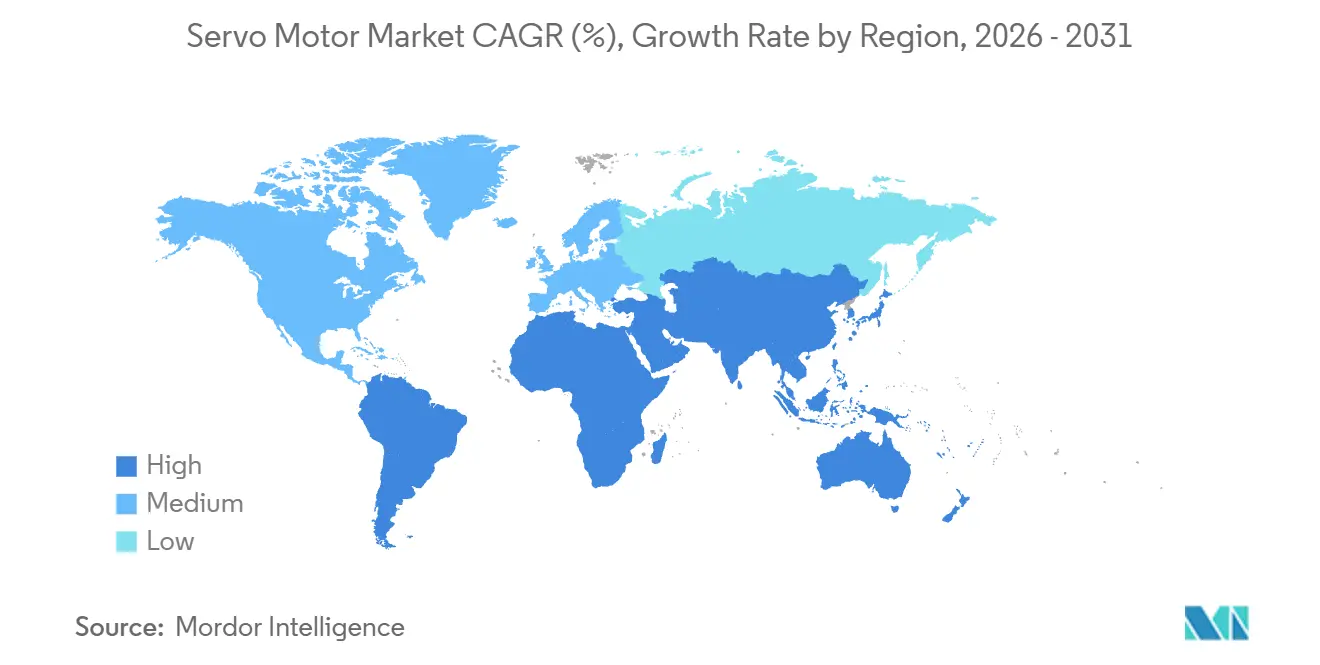
Asia Pacific generated 43.74% of 2025 revenue, anchored by China’s dominance in smartphone assembly and South Korea’s USD 44 billion semiconductor CAPEX wave. Government subsidies in India under the Production-Linked Incentive scheme reimburse 25% of automation spend, accelerating servo adoption across automotive and pharma lines.[3]
Africa Servo Motor Market
Africa, although only a small portion of the current servo motor market, is forecast to expand at an 8.13% CAGR through 2031, driven by South Africa’s EV program, Nigerian food-processing upgrades, and Kenyan textile exports. Limited grid reliability and servicing expertise, however, keep low-cost stepper alternatives in contention, tempering upside.
Europe, the Americas and Middle East Servo Motor Market
North America and Europe remain mature but show pockets of double-digit growth in medical devices and aerospace, segments willing to pay premiums for IP69K stainless motors or DO-178-certified software stacks. South America lags as macro volatility lifts imported-equipment costs, although Brazil’s automotive sector could reaccelerate once borrowing costs retreat below 10%. The Middle East, led by Saudi Arabia's Vision 2030, is selectively installing servo-driven CNC and additive manufacturing cells in new industrial zones.

Regulatory Landscape
Servo-motor deployments are increasingly shaped by drivetrain efficiency and machine-safety standards, even where servo motors sit outside broad motor MEPS definitions. IEC 61800-9-2:2025 introduced IE4 and IE5 reference classes for drive systems, which pushes OEMs and end users toward efficiency-verified servo drives and motors, alongside documented efficiency curves plus EMC and safety conformity.
For functional safety, servo systems commonly align to IEC 61800-5-2 and are engineered to support machinery safety frameworks such as IEC 61508 and ISO 13849-1, which in turn reinforces demand for safety-capable motion platforms in regulated factory environments. Compliance and trade rules still vary by region, including Mitsubishi Electric referencing China Energy Label requirements (CEL 038-2020) for certain AC servo motor configurations from January 2026 production, and India implementing a time-bound zero-tariff regime for imported electric motors under HS 8501 from June 1, 2026 through August 31, 2026, impacting landed-cost decisions and sourcing strategies for servo motor shipments tied to industrial automation projects.
Competitive Landscape
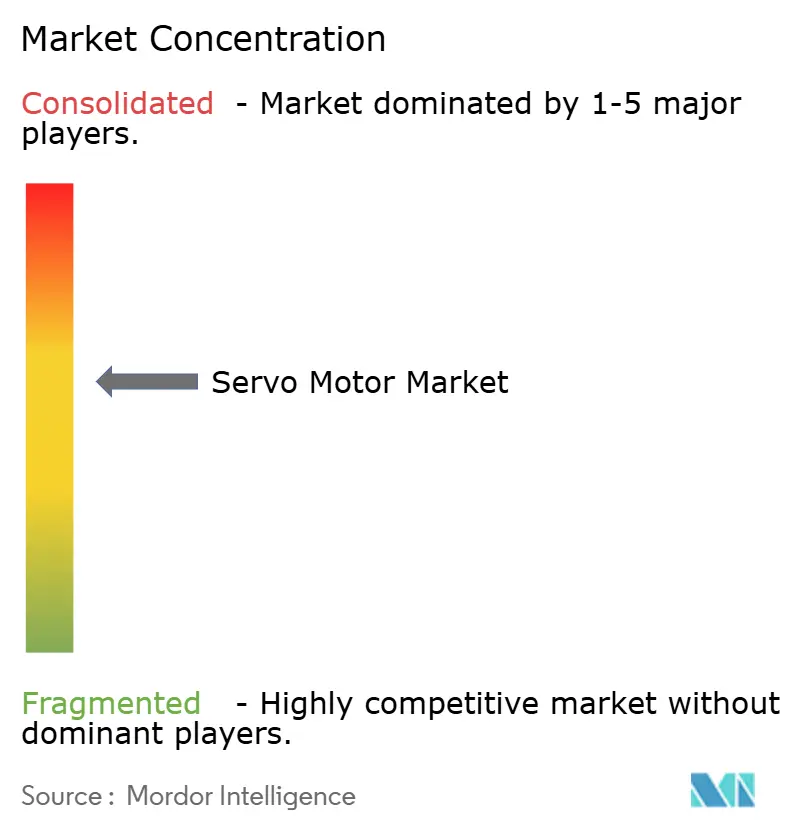
The servo motor market exhibits moderate concentration, with the top five suppliers accounting for approximately 52% of the 2025 revenue; no single firm exceeds 15%. Incumbents defend their share through the vertical integration of motor cores, encoders, and silicon-carbide drives, exemplified by Yaskawa’s Sigma-7 series, which integrates 23-bit absolute encoders and achieves a 100,000-hour MTBF.
Chinese entrants, such as Estun Automation, leverage local rare-earth supply and low labor costs to undercut prices but lag behind in encoder resolution and cybersecurity features. Siemens filed 47 motion-control patents in 2024, with 60% aimed at encrypted fieldbus communication, emphasizing alignment with IEC 62443.[4]Siemens AG, “Motion-Control Patent Filings 2024,” siemens.com
White-space opportunities center on edge AI; fewer than 5% of installed drives run on-motor inference, exposing incumbents to software-first disruptors. Nevertheless, entrenched service contracts and proprietary programming environments create switching costs that slow the erosion of market share, suggesting continued but incremental rebalancing.
Servo Motor Industry Leaders
Yaskawa Electric Corporation
Mitsubishi Electric Corp.
Siemens AG
Rockwell Automation Inc.
Delta Electronics Inc.
- *Disclaimer: Major Players sorted in no particular order
Servo Motor Market Companies Covered in this Report
- Yaskawa Electric Corporation
- Mitsubishi Electric Corp.
- Siemens AG
- Rockwell Automation Inc.
- Delta Electronics Inc.
- ABB Ltd.
- FANUC Corp.
- Schneider Electric SE
- Bosch Rexroth AG
- Kollmorgen Corporation
- Omron Corporation
- Parker Hannifin Corp.
- Nidec Corporation
- Oriental Motor Co. Ltd.
- Lenze SE
- Panasonic Industry Co.
- Toshiba Infrastructure Systems
- Estun Automation Co. Ltd.
- Maxon Group
- Sanyo Denki (SANMOTION)

Market Opportunities and Future Outlook
Energy- and data-driven modernization is widening the opportunity set for premium servos that combine high-efficiency drive trains with diagnostics and secure networking. Demand is moving beyond torque density as buyers specify deterministic Ethernet connectivity and functional safety features aligned to IEC 61800-5-2 and IEC 62443-oriented zone concepts, which creates space for suppliers packaging motors with safety-ready feedback, digital fieldbus connectivity, and embedded condition monitoring.
Asia-based capacity additions and more localized supply chains also point to quicker lead times as vendors tailor products to robotics and machine-tool demand centers. FANUC announced a USD 120 million investment in March 2026 for a third servo motor factory in Dongguan, China, targeting compact high-precision models, and Inovance started work in April 2026 on a RMB 2 billion manufacturing base in Dalian focused on permanent magnet synchronous motors. At the same time, new BLDC capacity, including Greensky Power commencing operations at a USD 120 million Thailand facility in January 2026, increases competitive pressure in compact motion segments and supports OEM decisions that balance servo performance with cost and regional availability.
Recent Industry Developments in Servo Motor Market
- July 2026: Mitsubishi Electric announced an agreement related to Factory Automation industrial products, including transferring 70% of the shares in Mitsubishi Electric FA Industrial Products to Konecranes within the fiscal year ending March 2027. The transaction supports Mitsubishi Electric's portfolio focus in factory automation and can reshape how motion-control components are commercialized and supported across regions. It also influences partner ecosystems that bundle servo motors with drives, controllers, and service contracts.
- November 2025: Mitsubishi Electric signed a definitive agreement to transfer its three-phase and Interior Permanent Magnet (IPM) motor businesses, including Shinshiro Factory production facilities, to EBARA Corporation, while excluding Mitsubishi Electric servo motor and main spindle motor production lines at the site. By ring-fencing servo production, Mitsubishi Electric reinforced its prioritization of motion-control platforms within its broader motor portfolio. The transaction also reallocates manufacturing and supply-chain resources toward segments that directly compete in servo-led automation.
- May 2025: Yaskawa Electric launched new 400V input models for its Sigma-X AC servo drive series, targeting larger equipment platforms in Europe and Asia. Expanding the addressable voltage class strengthens Yaskawa's positioning in higher-power industrial machinery where 400V infrastructure is standard. The update also supports OEM standardization across geographies by reducing the need for region-specific drive variants.


Servo Motor Market Report Scope and Research Methodology
Market Definition and Coverage
For this study, the global servo motor market covers revenue from standalone servo motors sold for closed-loop control of position, speed, and torque across industrial and commercial automation uses. We count sales at the manufacturer level and then map them to end-user demand by industry and region.
Scope exclusions: Excluded from this market are servo drives and amplifiers, integrated motor-drive units, linear motion systems, and aftermarket repair or maintenance services.
Segments Covered in This Report
- By Motor Type
- AC Servo Motor
- DC Servo Motor
- By Axis Configuration
- Single-Axis
- Multi-Axis
- By Power Rating
- <750 W
- 750 W – 2 kW
- >2 kW
- By Communication Interface
- Analog / PWM
- Digital Fieldbus (CANopen, EtherCAT, PROFINET)
- By End-User Industry
- Oil and Gas
- Chemical and Petrochemical
- Power Generation
- Water and Wastewater
- Metal and Mining
- Food and Beverage
- Discrete Industries
- Automotive
- Electronics and Semiconductor
- Packaging
- By Geography
- North America
- United States
- Canada
- Mexico
- South America
- Brazil
- Argentina
- Rest of South America
- Europe
- Germany
- United Kingdom
- France
- Italy
- Spain
- Russia
- Rest of Europe
- Asia Pacific
- China
- Japan
- South Korea
- India
- Australia
- New Zealand
- Rest of Asia Pacific
- Middle East
- United Arab Emirates
- Saudi Arabia
- Turkey
- Rest of Middle East
- Africa
- South Africa
- Nigeria
- Kenya
- Rest of Africa
- North America
Data Sources, Market Sizing, and Validation
Desk Research
Desk research was used to set the market frame and anchor key assumptions that need to stay consistent across countries and end uses. We referenced public sources such as UN Comtrade trade statistics, International Energy Agency (IEA) industry energy indicators, U.S. Census Bureau manufacturing data, Eurostat industrial production series, and IEC publications that track motor and drive efficiency standards.
We also reviewed annual reports, investor presentations, and product catalogs to understand how servo motors are positioned by power rating, axis configuration, and communication interface. Patent databases and a paid subscription for company financials and news were also used to track new product introductions and capacity moves, which helped avoid carrying forward outdated mix assumptions. This list is indicative only, and other sources were used for data collection, validation, and clarification during analysis.
Primary Interviews and Surveys
Primary interviews and surveys were used to pressure-test the desk view and fill gaps on product mix, pricing, and replacement cycles that are not visible in public datasets. We spoke with stakeholders across motor manufacturing, distribution channels, OEMs, and industrial end users across APAC, EMEA, and the Americas, and then rechecked any large deviations through follow-up discussions.
Distribution of primary research fieldwork respondents
| Company type | Respondent position | Region |
|---|---|---|
| Top tier: 32% | CXOs: 12% | APAC: 44% |
| Mid tier: 54% | Functional/Unit leaders: 37% | EMEA: 37% |
| Smaller Players: 14% | Managers: 51% | Americas: 19% |
Market-Sizing & Forecasting
Market size was first built using a top-down and bottom-up approach. We translated industrial automation demand pools and manufacturing output indicators into servo motor consumption by region and end-user industry, then verified the totals through supplier-side checks. Bottom-up approximations were applied through sampled price and volume builds across key power bands (such as 750 W to 2 kW), and through channel checks for single-axis versus multi-axis adoption, before normalizing the final totals.
In practice, we tracked a few market fingerprints closely because they shift the model the most. These include the mix shift between AC and BLDC servo motors, the penetration of digital communication interfaces in factory automation, the share of demand coming from automotive and electronics manufacturing, and the pace of upgrades tied to energy-efficiency compliance and plant modernization cycles. Where direct volume visibility was weak in smaller countries, we used proxy indicators like industrial production indices and machine tool output, and then applied region-specific adoption ranges validated by interviews.
For forecasting, we used scenario analysis with a base case aligned to expected production growth, automation intensity, and electronics capacity expansion by region. In parallel, we applied simple time-series smoothing on historical demand signals to flag unrealistic jumps, and then accepted only forecast paths consistent with the price trend and the installed base replacement logic described by respondents.
Data Validation & Update Cycle
Validation was handled in stages, so the market totals were not accepted until they matched more than one independent signal. We compared outputs against trade flows, manufacturing activity indicators, and observed pricing bands by power rating, and then flagged any region or industry mix that looked inconsistent with how servo motors are purchased.
Before sign-off, an internal analyst review checked calculations, assumptions, and year-on-year movements, followed by targeted re-contact when a key input shifted or a data point conflicted with prior inputs. Reports are refreshed annually, with interim updates when material events occur, and a final pre-delivery review so clients receive the latest updated view.
Mordor Intelligence's Global Servo Motor Market Size Measured Against Other Published Estimates
Published market estimates for servo motors often do not match because the scope is handled differently across studies, and then pricing and mix assumptions are applied on top of that. Differences commonly come from whether servo drives are included, how integrated motor-drive packages are treated, and what year and currency timing are used for conversions.
Some external numbers fold servo motors into a larger servo motors and drives total, which can push the value up even if end-use trends look similar. For Mordor Intelligence, only standalone servo motors are counted, and revenue tied to drives, amplifiers, integrated units, and aftermarket service is excluded, followed by checks using axis mix and power-band splits before finalizing totals.
Benchmark comparison
| Source | Market Size | Gaps in Research Methodology |
|---|---|---|
| Mordor Intelligence | USD 14.57 B (2025) | |
| Global Consultancy A | USD 18.62 B (2024) | Reported as a combined servo motor and drive market, which typically includes drives and amplifiers, and it can also apply a different year, currency timing, and price basis than a motors-only view. |
| Industry Report B | USD 16.20 B (2025) | Uses broader product definitions beyond standalone motors, and the pricing and mix progression by power rating is not clearly tied to demand indicators like axis configuration and end-user output trends. |
The comparison shows that most of the spread is explained by what gets counted as part of the market and how the price and mix are carried through the model. By keeping the scope limited to servo motors and then cross-checking against adoption cues like axis configuration and power-rating demand, we keep the number traceable to repeatable inputs instead of bundled categories.


Key Questions Answered in the Report
How large is the servo motor market in 2026?
The servo motor market size was USD 15.38 billion in 2026.
What CAGR is expected for servo motors to 2031?
The market is projected to register a 5.53% CAGR through 2031.
Which motor type is growing fastest?
Brushless DC servo motors are forecast to expand at 6.47% CAGR.
Which region is anticipated to grow quickest?
Africa is predicted to post the highest 8.13% CAGR through 2031.
Why are digital fieldbus interfaces gaining share?
They enable deterministic multi-axis coordination and meet IEC 62443 cybersecurity requirements, driving 6.32% CAGR adoption.
What is the main supply-chain risk for servo manufacturers?
Dependence on rare-earth magnets, with China controlling about 90% of global refining capacity, poses significant supply risk.
Page last updated on:


 Your data is secure and never sold or shared.


