
Sensors Market Size and Share
Market Overview
| Study Period | 2020 - 2031 |
|---|---|
| Market Size (2026) | USD 269.43 Billion |
| Market Size (2031) | USD 439.66 Billion |
| Growth Rate (2026 - 2031) | 10.29% CAGR |
| Fastest Growing Market | Middle East and Africa |
| Largest Market | North America |
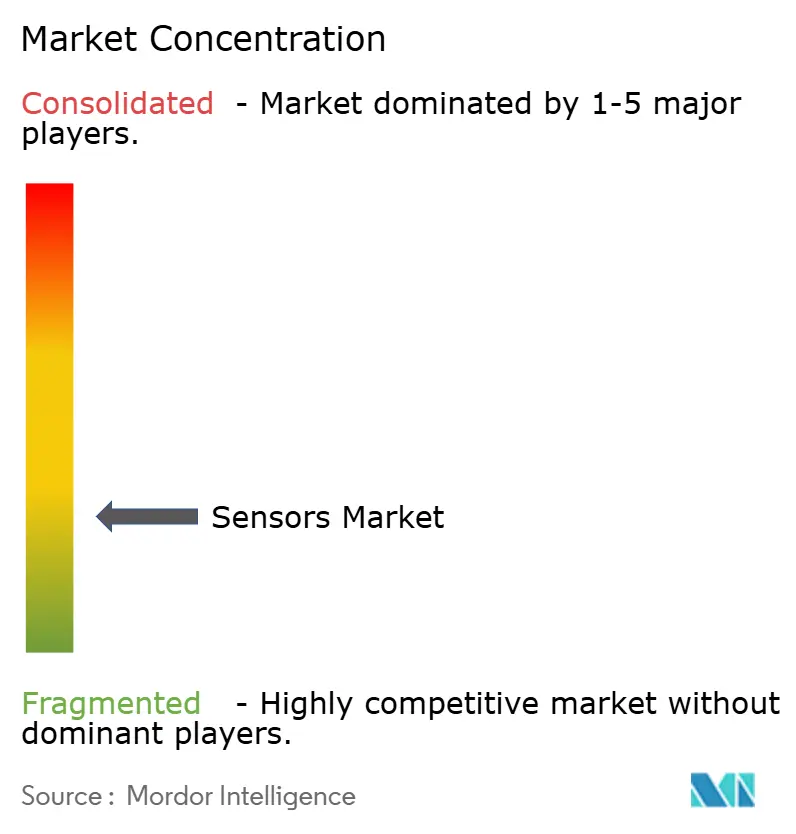
| Market Concentration | Low |
Major Players *Disclaimer: Major Players sorted in no particular order Image © Mordor Intelligence. Reuse requires attribution under CC BY 4.0. | |
Sensors Market Analysis by Mordor Intelligence
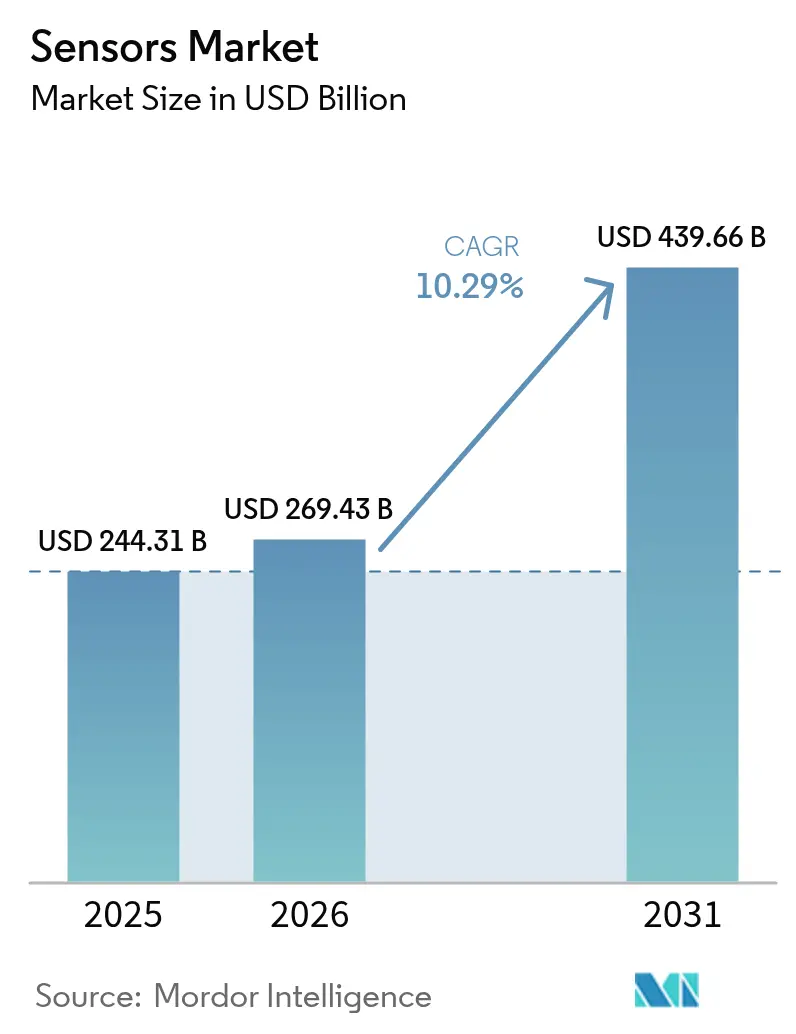
The sensors market size is expected to grow from USD 244.31 billion in 2025 to USD 269.43 billion in 2026 and is forecast to reach USD 439.66 billion by 2031 at 10.29% CAGR over 2026-2031. The growth is propelled by wider adoption of autonomous mobility platforms, rapid industrial automation, and expanding use-cases in connected healthcare. Convergence between artificial intelligence and sensor hardware is enabling predictive maintenance systems that cut unplanned factory downtime by up to 50%. Temperature devices currently dominate the sensors market with 23% share, while chemical variants are on track for the fastest expansion at a 14.8% CAGR. Asia-Pacific leads demand on the back of Chinese smart manufacturing programs, strong automotive innovation in Japan, and long-standing semiconductor supply chains. At the same time, Middle East & Africa is emerging as the quickest-growing region, supported by large-scale infrastructure digitalization and clean-energy buildouts. Competitive intensity remains high and fragmented, yet recent joint ventures and targeted acquisitions are accelerating consolidation around multimodal and AI-enabled product portfolios.[1]Bosch Press, “AI-enabled sensors deliver life-changing use cases,” us.bosch-press.com
Key Report Takeaways
- By parameter measured, temperature devices led with 22.74% sensors market share in 2025; chemical sensors are set to rise at 14.12% CAGR to 2031.
- By technology, MEMS accounted for 40.22% of the sensors market size in 2025, while quantum-tunneling composite devices are projected to surge at 16.92% CAGR over the same period.
- By end-user industry, automotive retained 24.46% sensors market share in 2025; medical and wellness applications are forecast to grow the fastest at 11.98% CAGR through 2031.
- By geography, Asia-Pacific captured 36.21% revenue share in 2025; Middle East & Africa is expected to register a 14.58% CAGR to 2031.
- Bosch, STMicroelectronics, and Texas Instruments together supplied about 29.3% of global unit shipments in 2025.
Note: Market size and forecast figures in this report are generated using Mordor Intelligence’s proprietary estimation framework, updated with the latest available data and insights as of 2026.
Global Sensors Market Trends and Insights
Drivers Impact Analysis*
| Driver | (~) % Impact on CAGR Forecast | Geographic Relevance | Impact Timeline |
|---|---|---|---|
| Increasing adoption of multi-sensor fusion in autonomous mobility | 2.80% | North America, Europe, Asia-Pacific | Medium term (2-4 years) |
| Proliferation of smart-factory retrofits in brown-field Asian plants | 2.10% | Asia-Pacific, Emerging markets | Short term (≤ 2 years) |
| Shift toward condition-based asset monitoring in offshore energy | 1.40% | Global offshore basins | Long term (≥ 4 years) |
| Mandatory inclusion of ADAS sensing suites in next-gen EU vehicles | 1.90% | Europe, Global OEM supply chains | Medium term (2-4 years) |
| Ultra-low-power environmental sensing for battery-free IoT tags | 1.20% | Developed markets | Long term (≥ 4 years) |
| Expansion of renewable-energy monitoring requirements (solar & wind) | 1.50% | Middle East & Africa, Europe, Asia-Pacific | Medium term (2-4 years) |
| Source: Mordor Intelligence | |||


Increasing adoption of multi-sensor fusion in autonomous mobility
LiDAR, radar, and camera streams are now integrated into unified perception stacks, creating redundancy that meets the EU General Safety Regulation 2019/2144 for advanced driver assistance in all new vehicles. Tesla’s full self-driving computer already processes inputs from 8 cameras, 12 ultrasonic units, and a radar at 144 TOPS, setting a performance benchmark. Tier-1 suppliers are responding with pre-calibrated perception suites that lower integration cost, compress bill-of-materials, and accelerate time-to-market. [2]Tesla, “Vehicle Autopilot Hardware,” tesla.com
Proliferation of smart-factory retrofits in brown-field Asian plants
China’s 14th Five-Year Plan earmarked USD 1.4 trillion for digital infrastructure, much of which targets sensor-rich upgrades of legacy machinery to unlock predictive maintenance and 20-30% lifecycle extensions. Vibration, temperature, and flow devices fitted to existing lines feed cloud analytics that cut downtime and lift overall equipment effectiveness without full plant reconstruction.
Shift toward condition-based asset monitoring in offshore energy
North Sea operators report that unscheduled production halts can cost USD 1–5 million per day, giving high payback on robust vibration and pressure sensor arrays able to detect bearing wear up to a year before failure. Satellite backhaul now streams data from remote platforms to onshore centers in real time, supporting model-based predictive maintenance that enhances safety and cuts intervention costs.
Mandatory inclusion of ADAS sensing suites in next-gen EU vehicles
EU regulations require automatic emergency braking, lane departure alerts, and driver monitoring on every new model by 2026. This rule establishes a floor of vision, radar, and ultrasonic hardware per vehicle, scaling the sensors market far beyond premium segments. Bosch integrates AI co-processors inside its latest MEMS devices to shrink system footprints while complying with functional-safety norms.
Restraints Impact Analysis*
| Restraint | (~) % Impact on CAGR Forecast | Geographic Relevance | Impact Timeline |
|---|---|---|---|
| Supply tightness of automotive-grade MEMS foundry capacity | -1.80% | Asia-Pacific, Europe | Short term (≤ 2 years) |
| Calibration drift challenges in long-life vibration sensors | -0.90% | Industrial, Aerospace | Medium term (2-4 years) |
| Fragmented wireless protocol standards hindering smart-sensor interoperability | -1.10% | IoT, Industrial automation | Long term (≥ 4 years) |
| Rising cybersecurity concerns across connected sensor networks | -1.00% | Global | Medium term (2-4 years) |
| Source: Mordor Intelligence | |||
Supply tightness of automotive-grade MEMS foundry capacity
AEC-Q100 qualification cycles span up to two years and only a few Asia-Pacific fabs meet the stringent criteria. STMicroelectronics is expanding clean-room footprints, yet EV proliferation adds pressure by introducing fresh battery-management and thermal-monitoring loads.
Calibration drift challenges in long-life vibration sensors
Units deployed on offshore wind turbines and oil platforms must remain accurate for 10–20 years without human access. Drift from thermal cycling and mechanical stress triggers false alarms or missed failures. Quantum-tunnelling composite designs promise higher stability but are still in early commercialization stages.
*Our forecasts treat driver/restraint impacts as directional, not additive. The impact forecasts reflect baseline growth, mix effects, and variable interactions.
Segment Analysis
By Parameter Measured: Temperature dominance drives thermal innovation
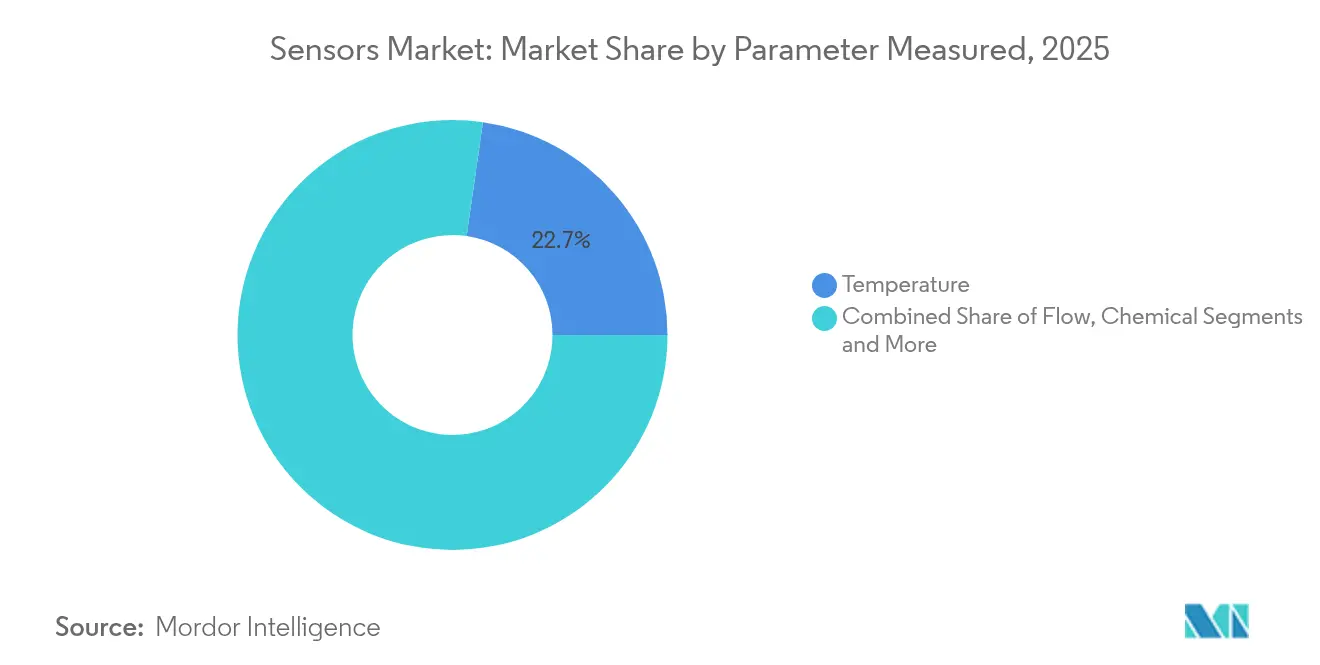
Temperature devices held 22.74% sensors market share in 2025 and remain indispensable for automotive thermal loops and industrial process control. Chemical variants are scaling fastest, on course for 14.12% CAGR through 2031 on rising emissions monitoring and workplace-safety mandates. Flow, vibration, and pressure categories together deepen the sensors market with predictive maintenance reach, while proximity units ensure machine-guarding compliance.
Continued miniaturization now allows integrated AI engines inside temperature elements, enabling local anomaly detection without cloud latency. Inertial, magnetic, optical, and humidity devices round out the portfolio, serving everything from smartphone orientation to smart-city air-quality grids.


By Mode of Operation: Electrical-resistance leadership as LiDAR accelerates
Electrical-resistance designs accounted for 19.18% of the sensors market in 2025 thanks to low cost and broad design-in across industrial and vehicle dashboards. LiDAR systems, critical for autonomous navigation, are projected to rise at 16.74% CAGR through 2031, reflecting price drops and movement to solid-state arrays that shed mechanical parts. Optical, piezoresistive, piezoelectric, capacitive, magnetic, and acoustic modes complete a diverse field addressing vision, pressure, vibration, touch, and sound requirements.
Advances such as Velodyne’s 4D LiDAR integrate velocity vectors with distance and angle, sharpening object classification for driver-assist functions. Meanwhile, piezoelectric harvesters supply micro-joule power budgets for battery-less sensor nodes in remote pipelines.
By Technology: MEMS leadership faces quantum-tunnelling disruption
MEMS devices controlled 40.22% of the sensors market size in 2025, benefitting from three decades of yield improvement and automotive qualification. Quantum-tunnelling composite alternatives are forecast to grow 16.92% annually, offering heightened sensitivity and drift-free stability. Photonic, CMOS, and emerging NEMS formats add bandwidth and integration options for machine-vision, optical comms, and biochemical detection.
Quantum-tunnelling pressure cells, exploiting electron tunnelling across polymer matrices, outperform MEMS at wide temperature swings, a key requirement in aerospace cabins and downhole energy gears. CMOS image arrays integrate on-die digital processing for AI vision tasks at the edge.
By End-User Industry: Automotive dominance meets medical innovation
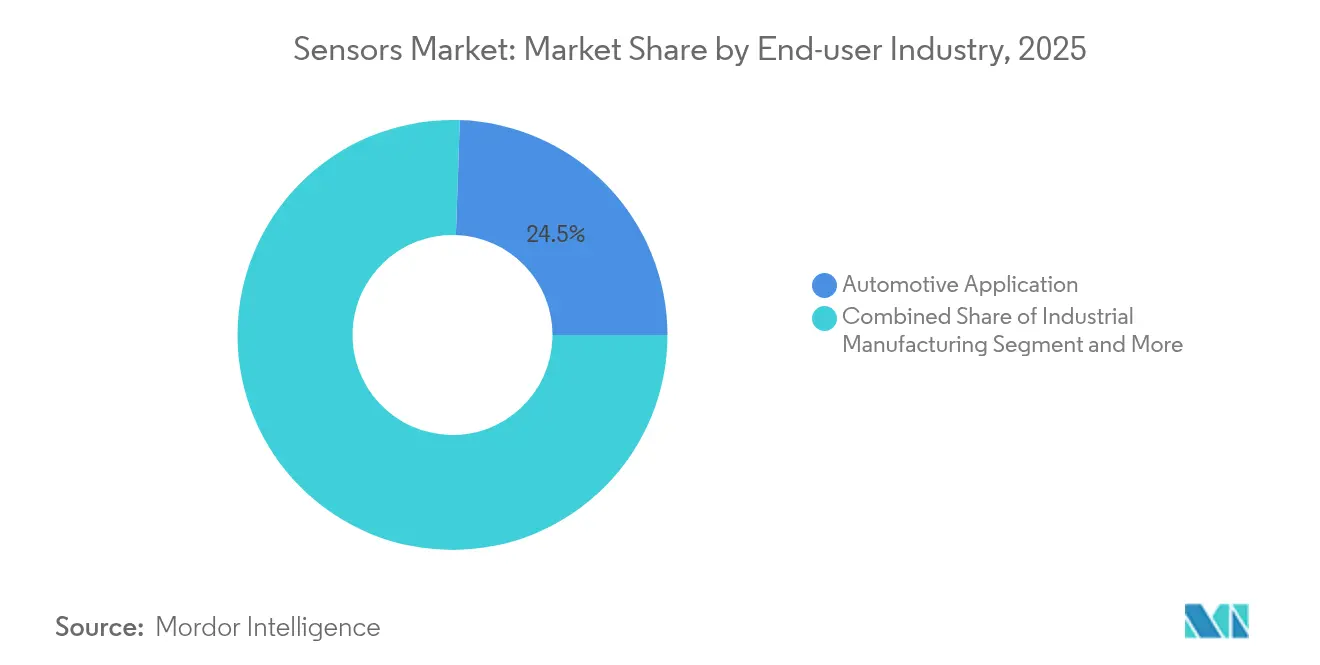
Automotive applications contributed 24.46% revenue in 2025, lifted by ADAS, EV battery management, and tighter emissions rules. Healthcare is advancing fastest at 11.98% CAGR, driven by continuous glucose monitors, wearables, and hospital tele-monitoring. Industrial manufacturing keeps strong demand for vibration, temperature, and flow sensors that enable predictive maintenance, while aerospace, consumer electronics, energy, construction, and defense each supply distinct pockets of opportunity.
Clinical trials now validate needle-free continuous glucose systems at accuracy levels equivalent to finger-stick controls, highlighting how biocompatible devices extend the sensors market into long-term patient-care settings.
By Output: Digital transformation enables smart connectivity
Analog outputs remain useful for real-time control loops demanding microsecond response and deterministic behaviour. Digital variants, however, enjoy rising penetration as they simplify calibration, cut noise, and plug straight into MCU buses like I²C, SPI, or CAN. Embedded edge intelligence adds encryption and secure boot features essential for authenticated industrial networks.
Dual-mode devices providing simultaneous analogy and digital streams cater to mixed legacy-plus-cloud environments. Growth in digital outputs aligns with the broader Industry 4.0 shift, further enlarging the sensors market.
Geography Analysis
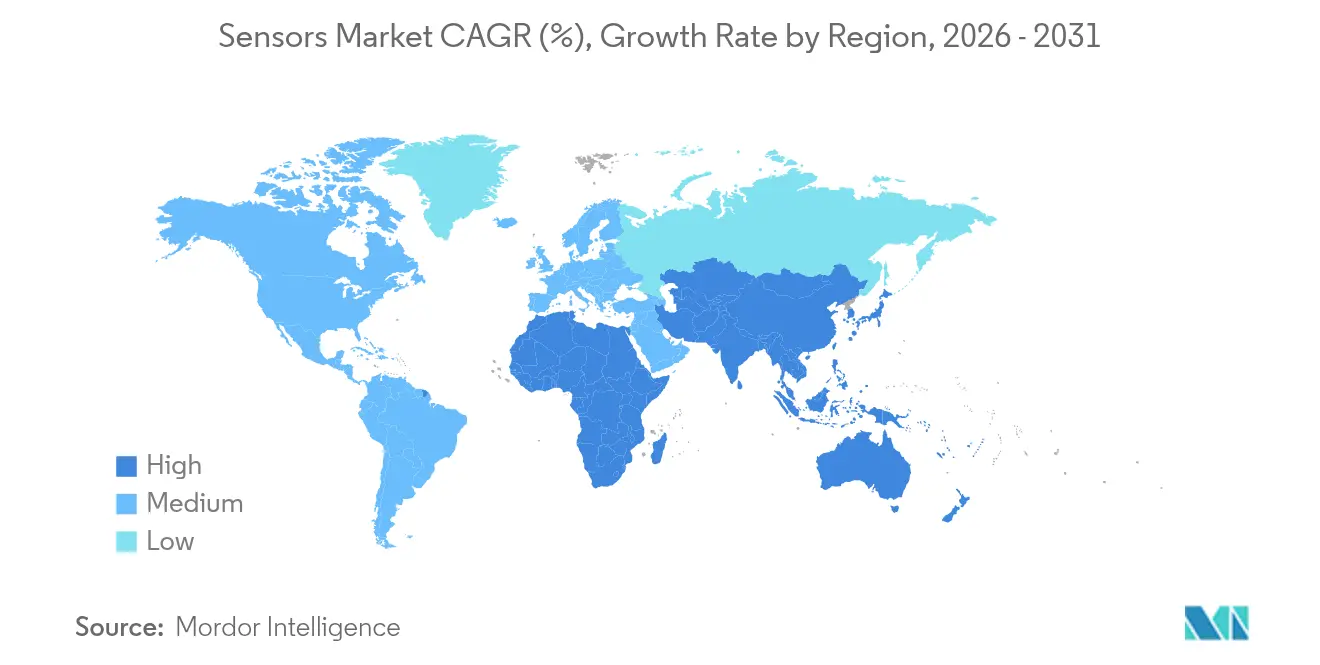
Asia-Pacific held 36.21% of global revenue in 2025, anchored by China’s USD 1.4 trillion digital-infrastructure push, Japan’s advanced automotive supply chains, and South Korea’s lithography leadership. Government incentives lower capital hurdles for fabs and embedded-sensor startups alike, translating into a dense regional cluster of design and production know-how. Suppliers enjoy proximity to the bulk of consumer-electronics assembly lines, compressing lead times and logistics costs.
Europe delivers steady high-value demand around stringent safety and environmental regulations. Mandatory ADAS fitment and industrial decarbonization targets push purchasing toward higher-performance, functionally safe products. The EU’s Chips Act grants and European Investment Bank loans such as NXP’s EUR 1 billion facilities funnel fresh capacity into on-shore automotive-grade production.
Middle East & Africa is projected to expand at 14.58% CAGR as Gulf Cooperation Council states embed smart grids, desalination monitoring, and large-scale renewables. African mining and transport corridors increasingly deploy ruggedized sensors that tolerate dust, vibration, and power instability. Latin America, though smaller, sees smart-agriculture pilots across Brazil and Mexico, adding incremental volume.
Mordor Intelligence provides coverage of the sensors market across other key regional markets, including Asia and Europe, each with their regulatory frameworks and demand patterns. Detailed country-level analysis extends to China, Japan, South Korea, United States, and Taiwan incorporating local coverage and market participation, as required.

Regulatory Landscape
Regulation for connected and AI-enabled sensors is tightening around cybersecurity, product safety, and radio approvals, particularly in Europe. The EU Cyber Resilience Act (Regulation (EU) 2024/2847) introduces vulnerability reporting duties for connected sensor products from 11 September 2026, with broader manufacturer obligations effective from 11 December 2027. That timeline pushes vendors to formalize secure-by-design, patching, and disclosure processes across industrial and IoT sensor portfolios.
For sensing systems that embed AI and wireless connectivity, compliance pathways are also being shaped by the EU AI Act (Regulation (EU) 2024/1689), which becomes fully applicable from 2 August 2026, alongside sector safety regimes (for example, machinery rules). In parallel, radio-equipment authorization processes are evolving: in 2026 the US FCC advanced administrative and spectrum updates, including a fast-track priority review concept for equipment authorizations tested in Trusted Test Labs within Mutual Recognition Agreement economies, and rules enabling geofenced variable power operation in the 6 GHz band. Thailand's NBTC also notified a draft radar standard for the 24.05-24.25 GHz band, pointing to continued global updates to short-range device and radar requirements relevant to automotive and industrial sensing.
Competitive Landscape
The market hosts a blend of diversified semiconductor majors and agile specialists. Bosch Sensortec, STMicroelectronics, Texas Instruments, and NXP command scale advantages in wafer supply, R&D budgets, and automotive qualification. Specialists such as SICK, Endress+Hauser, and Velodyne focus on lane-leader niches in industrial flow, gas analysis, and LiDAR.
Strategic collaboration is rising. In March 2025, SICK spun its gas-analysis unit into a 50-50 joint venture with Endress+Hauser, pooling 800 staff across 42 countries to accelerate decarbonization instrumentation. Acquisition activity also intensifies: Syntiant purchased Knowles’ consumer MEMS microphone line for USD 150 million to bundle always-on audio front ends with local AI inference. Capacity-driven deals, such as Viavi’s USD 150 million acquisition of Inertial Labs, widen domain exposure to aerospace and defense.
Quantum-tunnelling composite innovators seek design-ins with OEMs frustrated by MEMS drift. Likewise, ultra-low-power wireless SOC vendors court battery-free IoT deployments that mainstream chip houses have yet to prioritize. Pricing power varies commodity temperature parts face razor margins, whereas integrated AI sensor nodes command premium ASPs thanks to system-level savings on compute boards and cabling. [4]Endress+Hauser, “Strategic partnership launched,” endress.com
Sensors Industry Leaders
Honeywell International Inc.
Texas Instruments Inc.
Rockwell Automation Inc.
TE Connectivity Ltd
OMEGA Engineering inc.
- *Disclaimer: Major Players sorted in no particular order

Market Opportunities and Future Outlook
Supply-chain localization and capacity expansion in automation-grade sensing create whitespace for suppliers that can deliver qualified, ruggedized devices at scale. In February 2026, Endress+Hauser announced an expansion of US manufacturing and supply chain capabilities covering about 650,000 square feet to increase production of flowmeters, pressure transmitters, and analytical sensors, aimed at reducing lead-time and availability constraints for process industries and energy. In China, Jiangsu provincial authorities highlighted in March 2026 the ramp of second-phase MEMS pressure sensor production lines by Suzhou MEMSensing and Wuxi Huahong Grace Semiconductor, citing a 92.3% yield and monthly capacity of 1.2 million IP67-rated sensors for industrial automation, which supports demand for factory-floor-ready, high-ingress-protection sensor designs.
Product and platform opportunities are centering on sensor bundles that include edge intelligence and domain-specific detection, rather than standalone components. Sensirion disclosed in March 2026 the construction of a second production building in Stafa with a MEMS cleanroom planned to be operational by 2028, alongside pilot products for A3 coolant leakage detection in air conditioning systems, showing how targeted sensing (leak, safety, and compliance monitoring) can become a distinct design-in route. In industrial environments, the move toward AI-enabled automation is also lifting demand for integrated sensor plus software workflows for inspection, safety, and predictive maintenance, which raises the value of validated performance benchmarks and standardized test methods (including work by bodies such as NIST for sensing and perception systems in robotics and automated vehicles) that reduce qualification friction for OEM deployments.
Recent Industry Developments
- July 2026: Rockwell Automation expanded FactoryTalk Analytics VisionAI with additional AI inspection capabilities. The update adds more intelligence into inspection workflows, increasing demand for sensor-rich machine-vision deployments on production lines.
- March 2026: Texas Instruments announced a partnership with NVIDIA to combine TI mmWave radar sensing and real-time control with NVIDIA Jetson Thor for humanoid robotics. Aligning radar sensors with edge AI compute supports faster development of sensor-driven autonomy stacks and widens design-in paths beyond automotive into robotics and advanced industrial automation.
- December 2024: Viavi Solutions announced plans to acquire Inertial Labs for USD 150 million plus earn-outs over four years. The deal expands Viavi's position in inertial sensing and navigation, adding capability depth for aerospace and defense-grade sensor applications that require high precision and rugged performance.


Research Methodology Framework and Report Scope
Market Definition and Coverage
This market covers sensor component revenues where a physical, chemical, or biological input is detected and converted into a usable signal for monitoring or control across industries and regions.
Scope exclusions: We exclude downstream control systems, software-only analytics, and installation or maintenance services when they are priced separately from the sensor hardware.
Segmentation Overview
- By Parameter Measured
- Temperature
- Flow
- Chemical
- Vibration
- Pressure
- Proximity
- Inertial
- Other Parameters
- By Mode of Operation
- Optical
- Piezoresistive
- Piezoelectric
- Electrical Resistance
- Image
- LiDAR
- Other Modes
- By Technology
- MEMS
- Photonic
- CMOS
- Nano-electromechanical (NEMS)
- By Integration Level
- Discrete Sensors
- Integrated / Embedded Sensors
- By Output
- Analog
- Digital
- By End-user Industry
- Automotive
- Industrial Manufacturing
- Medical and Wellness
- Aerospace
- Consumer Electronics
- Oil and Gas
- Construction
- Defense
- By Geography
- North America
- United States
- Canada
- Mexico
- Europe
- United Kingdom
- Germany
- France
- Italy
- Rest of Europe
- Asia-Pacific
- China
- Japan
- India
- South Korea
- Rest of Asia-Pacific
- Middle East
- Israel
- Saudi Arabia
- United Arab Emirates
- Turkey
- Rest of Middle East
- Africa
- South Africa
- Egypt
- Rest of Africa
- South America
- Brazil
- Argentina
- Rest of South America
- North America
Data Sources, Market Sizing, and Validation
Desk Research
Desk research was used to set the market context and to anchor the model with repeatable reference points that can be checked each year. Public sources such as the US Census Bureau, Eurostat, UN Comtrade, World Bank indicators, and patent repositories were reviewed to understand electronics output, trade flows, and innovation direction in sensing technologies.
We also scanned company annual reports, earnings decks, product catalogs, and credible industry press to map common use cases and pricing patterns across major sensor families (for example, image, pressure, and temperature). Where helpful, we used subscription sources that provide company financials and news to validate revenue ranges and corporate actions. A paid patent database was also used to track filing momentum by sensor themes.
The sources listed above are illustrative and not exhaustive, since we used additional references for data collection, cross-checking, validation, and clarification.
Primary Interviews and Surveys
Primary work focused on expert interviews and structured surveys with manufacturers, distributors, component specialists, and end user procurement or engineering teams that specify sensors in production programs. Because the market is global, we verified inputs across APAC, EMEA, and the Americas so that pricing, demand mix, and adoption timing differences could be reflected in the assumptions used for the model.
Distribution of primary research fieldwork respondents
| Company type | Respondent position | Region |
|---|---|---|
| Top tier: 37% | CXOs: 15% | APAC: 41% |
| Mid tier: 47% | Functional/Unit leaders: 37% | EMEA: 36% |
| Smaller Players: 16% | Managers: 48% | Americas: 23% |
Market-Sizing & Forecasting
Market sizing was built using a top-down and bottom-up blend. Electronics and end use demand signals were translated into sensor value pools, then split by adoption areas that consistently drive shipments. To keep the totals practical, we corroborated them with selective bottom-up approximations such as sampled supplier revenue roll-ups, channel checks for unit volumes, and ASP by major sensor families. We then adjusted for overlaps and double counting.
In the model, a few inputs were treated as the main market fingerprints because they move the totals in a visible way. These include device production trends in automotive and consumer electronics, industrial automation investment cycles, sensor content per system (for example, rising sensing points in vehicles and factories), mix shifts toward image and radar, and realistic ASP progression tied to technology learning curves. Forecasts were taken forward using scenario analysis and multivariate regression, so that changes in vehicle output, smartphone volumes, industrial output, and trade momentum could be reflected together. When bottom-up coverage was uneven by sensor type or region, we filled gaps using ratio-based allocations that we validated with expert checks on mix and pricing.
Data Validation & Update Cycle
Validation was done through several checkpoints so that one strong assumption does not drive the full answer. Outputs were compared against independent signals such as import and export values, manufacturing activity indicators, and visible pricing ranges. Where large variances appeared, we reviewed them again before sign-off.
We also re-contact sources when results looked out of line with what is being seen in the field, such as a sudden ASP jump or an unexpected regional share change. The report is refreshed annually, and interim updates are triggered when material events occur, including policy shifts, major capacity changes, or demand shocks in high-volume end uses. Before delivery, a final analyst review is completed to ensure the latest public updates are reflected in the market model.
Mordor Intelligence's Global Sensors Market Sizing Compared With Other Published Estimates
It is normal to see different market sizes for sensors because publishers do not always count the same product scope, they pick different base years, and they apply different pricing and currency timing assumptions. Even small differences in what gets counted as a sensor and how fast ASPs are assumed to decline can create a meaningful spread.
A key driver is that some published figures use an earlier base year and then extend the curve with a single headline growth rate, which can miss mix shifts like image and radar gaining share. Another driver is scope interpretation, where adjacent items like control electronics, modules, or bundled service value may be included in some numbers. Some estimates present aggressive adoption ramps for automotive and industrial sensing without re-checking them against production, trade, and price signals, and that tends to lift the total.
Benchmark comparison
| Source | Market Size | Gaps in Research Methodology |
|---|---|---|
| Mordor Intelligence | USD 269.43 B (2026) | |
| Industry Publisher A | USD 212.50 B (2025) | Uses a 2024 base and a 2025 to 2030 curve that can compress recent mix changes across image, radar, and IoT-linked sensors, and it is not clear how bundled modules versus discrete sensors are separated in the value total. |
| Global Publisher B | USD 267.10 B (2025) | Provides a broad headline number with limited scope detail in the public summary, which makes it harder to confirm whether adjacent electronics, sensor modules, or non-hardware value are included, and how regional pricing and currency timing are handled. |
The table shows that the spread is mainly explained by year selection and what gets counted around the sensor hardware value. Some sources describe a broader sensor technologies total, and Mordor Intelligence counts sensor revenues tied to parameter and mode-of-operation categories, while excluding control systems and separately priced services when building the total.


Key Questions Answered in the Report
What is the current size of the sensors market?
The sensors market size stands at USD 269.43 billion in 2026 and is projected to reach USD 439.66 billion by 2031.
Which sensor type commands the largest revenue share?
Temperature devices lead with 22.74% sensors market share thanks to their central role in automotive thermal management and industrial process control
Which geography is growing the fastest for sensors?
Middle East & Africa is forecast to grow at 14.58% CAGR through 2031 due to heavy investment in smart infrastructure and clean-energy projects
How does multi-sensor fusion impact market growth?
Combining LiDAR, radar, and camera data for autonomous systems adds about +2.8% to the overall CAGR by driving higher sensor counts per vehicle.
What capacity challenges threaten supply?
Automotive-grade MEMS foundries face tight capacity, shaving an estimated 1.8% off potential CAGR until new qualified lines come online.
Which companies are leading consolidation?
Examples include SICK and Endress+Hauser’s joint venture in gas analysis and Syntiant’s acquisition of Knowles’ MEMS microphone business, reflecting a drive toward integrated multimodal sensor portfolio.
Page last updated on:


