
Sensors and Actuators Market Size and Share
Market Overview
| Study Period | 2020 - 2031 |
|---|---|
| Market Size (2026) | USD 21.89 Billion |
| Market Size (2031) | USD 34.24 Billion |
| Growth Rate (2026 - 2031) | 9.36 % |
| Fastest Growing Market | Asia-Pacific |
| Largest Market | Asia-Pacific |
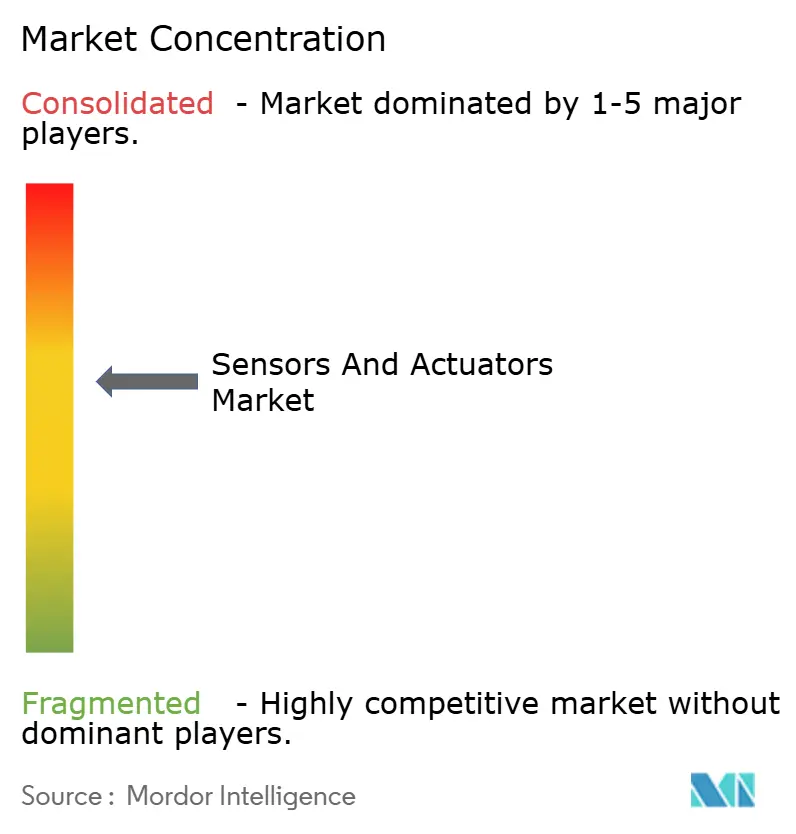
| Market Concentration | Medium |
Major Players *Disclaimer: Major Players sorted in no particular order Image © Mordor Intelligence. Reuse requires attribution under CC BY 4.0. | |
Sensors and Actuators Market Analysis by Mordor Intelligence
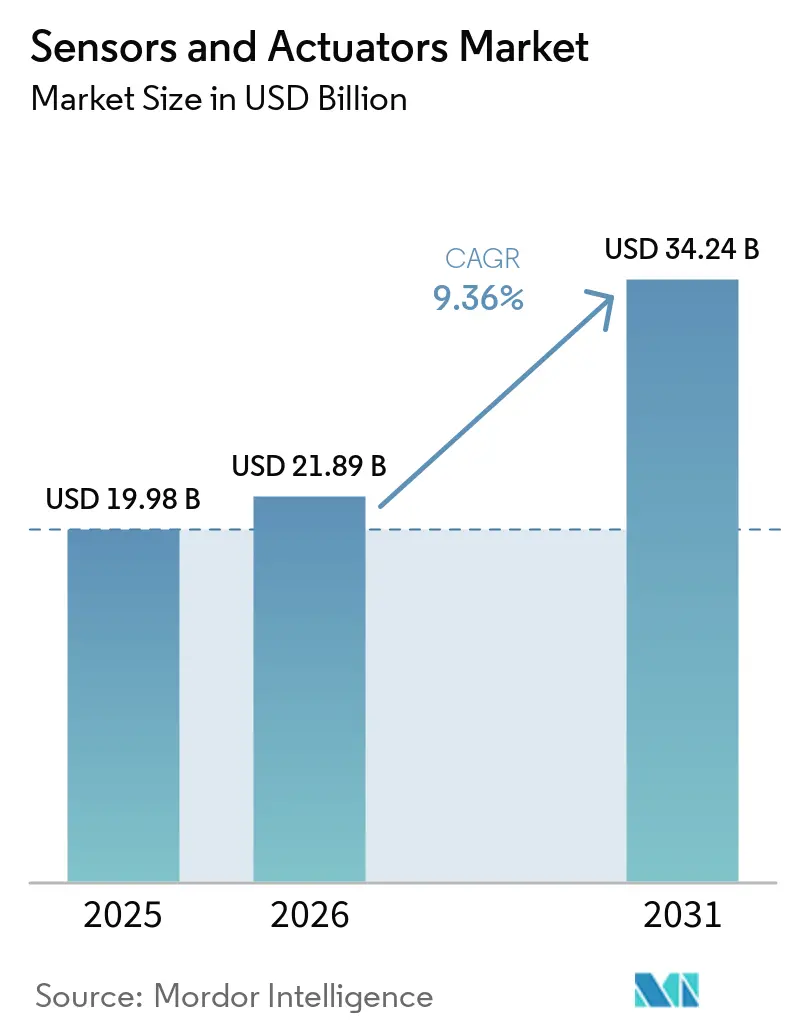
The sensors and actuators market size is projected to be USD 19.98 billion in 2025, USD 21.89 billion in 2026, and reach USD 34.24 billion by 2031, growing at a CAGR of 9.36% from 2026 to 2031. Demand is shifting toward edge-intelligent devices that both sense and perform real-time actuation at the network’s edge. Sensors held 62.45% revenue share in 2025 while chemical and bio-sensors are advancing the fastest thanks to wearable medical devices and point-of-care diagnostics. MEMS designs are eroding the cost-structure of conventional architecture, and low-power wireless links are broadening retrofit possibilities across factories, vehicles, and buildings. Healthcare providers, automotive OEMs, and discrete manufacturers are the most aggressive adopters, accelerating volume shipments of multi-axis inertial, pressure, and optical devices.
Key Report Takeaways
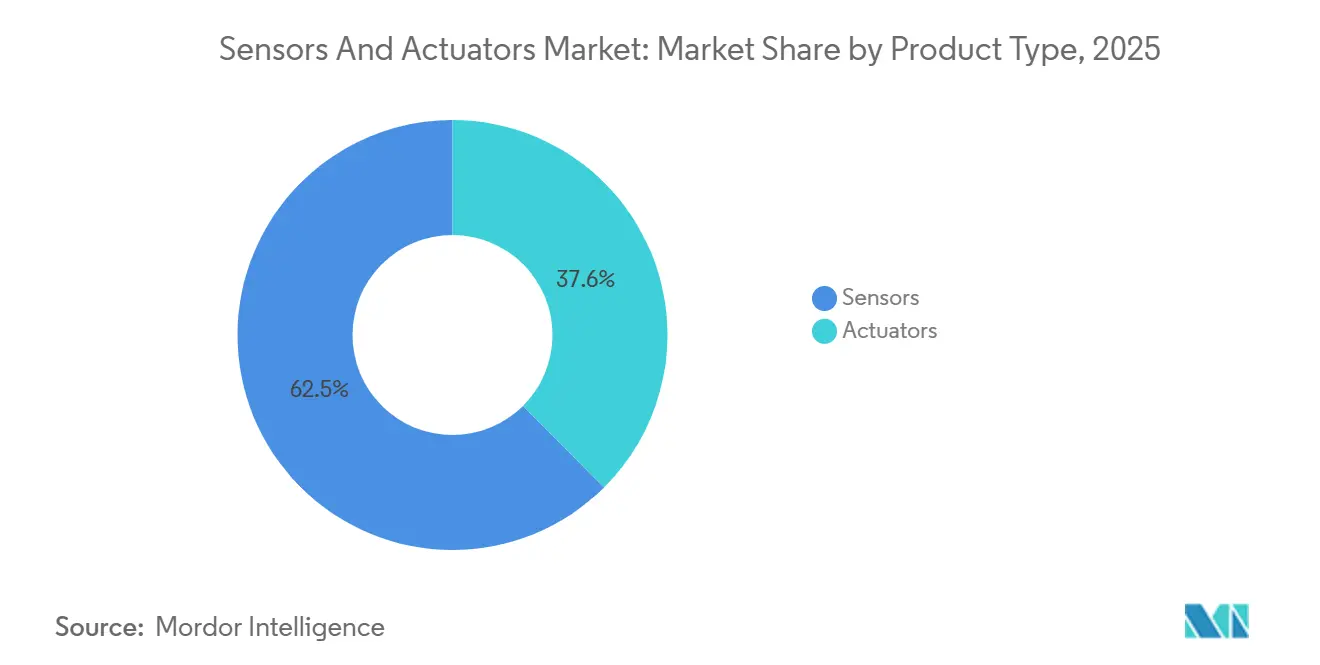
- By product type, sensors commanded 62.45% of the sensors and actuators market share in 2025, while chemical/bio-sensors are growing at a 10.40% CAGR in 2031.
- By end-user, Automotive and Mobility commanded 24.66% of the sensors and actuators market share in 2025, while healthcare recorded the steepest expansion at a 14.10% CAGR through 2031.
- By technology, MEMS architectures captured a 68.43% share of the sensors and actuators market size in 2025 and are growing at a 9.43% CAGR between 2026 and 2031.
- By connectivity, wireless networks captured a 54.29% share of the sensors and actuators market in 2025 and advanced at an 11.10% CAGR between 2026 and 2031.
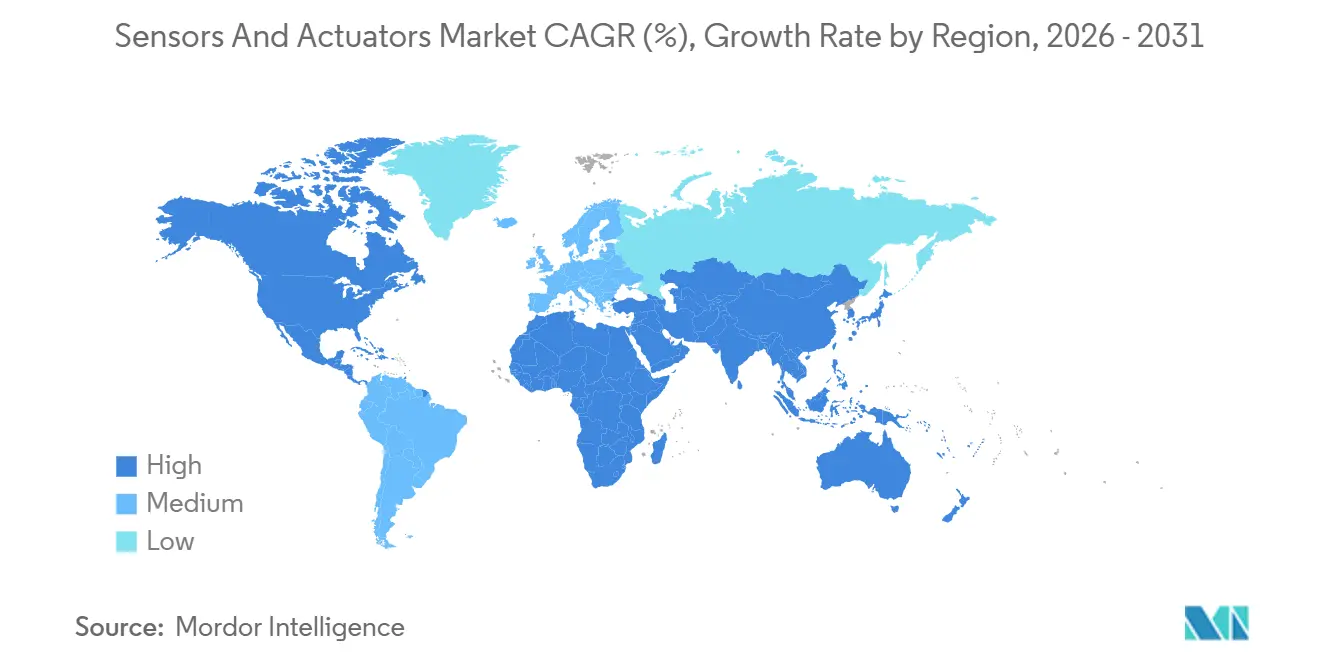
- By geography, Asia-Pacific led with 37.38% revenue share in 2025 and is growing at a 12.88% CAGR to 2031.
Note: Market size and forecast figures in this report are generated using Mordor Intelligence’s proprietary estimation framework, updated with the latest available data and insights as of January 2026.
Market Trends and Insights
Drivers Impact Analysis of Sensors and Actuators Market*
| Driver | (~) % Impact on CAGR Forecast | Geographic Relevance | Impact Timeline |
|---|---|---|---|
| Proliferation of Low-Power MEMS Sensors Unlocking New IoT Use-Cases | 1.8% | APAC core, spill-over to North America | Medium term (2-4 years) |
| Rapid Electrification and ADAS Integration in European Automotive Manufacturing | 1.5% | Europe, with early gains in Germany, France, Italy | Short term (≤ 2 years) |
| High Adoption of Predictive-Maintenance Platforms Amplifying Smart Actuator Demand | 1.3% | North America & EU | Medium term (2-4 years) |
| Hydrogen and CCUS Megaproject Investments Spurring Specialty Sensor Demand | 0.9% | Middle East, with early gains in Saudi Arabia, UAE | Long term (≥ 4 years) |
| Accelerated 5G and Edge-AI Roll-outs Elevating Industrial Sensor Uptake | 1.6% | APAC core (South Korea, Taiwan, China), spill-over to North America | Short term (≤ 2 years) |
| Source: Mordor Intelligence | |||
Proliferation Of Low-Power MEMS Sensors Unlocking New IoT Use-Cases
Battery-sipping MEMS accelerometers, gyroscopes, and environmental sensors now operate for up to a decade on primary cells, enabling smart-city air-quality grids, agricultural soil-moisture probes, and cold-chain asset trackers. China shipped more than 800 million sub-10-microampere sensors in 2025, driven by municipal deployments, while Indian cities installed over 200,000 wireless leak-detection nodes the same year.[1] New MEMS packages integrate vibration or thermal energy harvesters, lowering total cost of ownership by roughly one-third across a ten-year life cycle. These economics are shortening payback periods for public-sector and industrial buyers, sustaining double-digit unit growth.
Rapid Electrification And ADAS Integration In European Automotive Manufacturing
European vehicle platforms now contain 35–50 sensing nodes per car as OEMs migrate to Level 2-plus driver assistance and battery-electric powertrains. More than two-thirds of cars registered in Germany in 2025 featured adaptive cruise control and lane-keeping support, each requiring radar, ultrasonic, and optical image sensors.[2] Component suppliers have inked multi-year contracts exceeding EUR 2 billion (USD 2.2 billion) for 77 GHz radar modules and high-dynamic-range CMOS imagers. Battery packs add dozens of current, voltage, and temperature sensors for thermal-runaway prevention, extending the sensor content and reinforcing demand for automotive-grade MEMS foundry capacity.
High Adoption Of Predictive-Maintenance Platforms Amplifying Smart Actuator Demand
North American refiners, chemical producers, and discrete manufacturers connected more than 1.2 million sensor-actuator endpoints to digital plant platforms in 2025. Machine-learning models running at the device edge now flag bearing or seal degradation weeks in advance, trimming unplanned outages by up to one-fifth. Smart electric and pneumatic actuators embed microcontrollers, vibration sensors, and wireless transceivers, commanding a 20%–30% premium that users justify against downtime costs exceeding USD 50,000 per hour in continuous-process industries. As inference chips are added to actuator control boards, on-device anomaly detection is set to become standard.
Hydrogen And CCUS Megaproject Investments Spurring Specialty Sensor Demand
Gigawatt-scale hydrogen and carbon-capture plants under construction in Saudi Arabia and the UAE require sensors that survive temperatures above 400 °C, pressures to 100 bar, and corrosive gas streams. Fiber-optic distributed acoustic systems monitor several hundred kilometers of hydrogen piping in real time, while tunable-diode-laser analyzers verify CO₂ purity at ±0.5% for sequestration. Cumulative regional spend on specialty instrumentation is expected to top USD 800 million by 2030, though protracted qualification and safety-certification cycles temper near-term volume.
Restraints Impact Analysis of Sensors and Actuators Market*
| Restraint | (~) % Impact on CAGR Forecast | Geographic Relevance | Impact Timeline |
|---|---|---|---|
| Rare-Earth Magnet Price Volatility Inflating Precision Actuator BOM Costs | -0.7% | Global, with acute impact in North America & EU | Short term (≤ 2 years) |
| EU Data-Security Legislation Slowing Wireless Sensor-Network Adoption | -0.5% | Europe, with spill-over to UK | Medium term (2-4 years) |
| High Calibration Complexity of Multi-Axis Sensors Hindering SME Uptake | -0.4% | Global, with acute impact in APAC SME clusters | Medium term (2-4 years) |
| Semiconductor Wafer Shortages Curtailing MEMS Sensor Supply in Japan | -0.6% | Global, with acute impact in APAC automotive supply chains | Short term (≤ 2 years) |
| Source: Mordor Intelligence | |||
Rare-Earth Magnet Price Volatility Inflating Precision Actuator BOM Costs
Neodymium-iron-boron magnet prices climbed more than one-third between mid-2024 and early 2025 after export-quota cuts and mining disruptions.[3] Magnetic actuator suppliers faced 12%–18% bill-of-materials inflation and saw gross margins compress by roughly 250 basis points. Alternate ferrite magnets reduce torque density, while switched-reluctance designs introduce complex control algorithms, limiting substitution. Smaller vendors without scale procurement contracts feel the squeeze most acutely as they cede share to vertically integrated multinationals.
EU Data-Security Legislation Slowing Wireless Sensor-Network Adoption
Since October 2024, the European Union's NIS2 directive has mandated that certified gateways, secure boot mechanisms, and encrypted firmware updates be implemented for wireless nodes in critical infrastructure. This directive aims to enhance the security and resilience of critical systems against cyber threats. However, compliance with these requirements comes at an added cost of USD 15–25 per sensor, which can significantly impact project budgets. Additionally, rollout schedules may face delays of over a month due to the time required for certification and implementation processes. As a result, utilities and building-automation integrators are halting wireless upgrades, opting instead for wired fieldbus architectures that are perceived as more reliable and easier to certify under the new regulations. This shift is hindering the adoption and penetration of flexible, battery-powered sensors, which are otherwise valued for their versatility and ease of deployment. Furthermore, certification bottlenecks are anticipated to continue until 2027, as testing labs work to increase their capacity and vendors focus on completing necessary product redesigns to meet the directive's stringent requirements.
*Our forecasts treat driver/restraint impacts as directional, not additive. The impact forecasts reflect baseline growth, mix effects, and variable interactions.
Sensors and Actuators Market Segment Analysis
By Product Type:
Chemical And Bio-Sensors Lead Innovation WaveChemical and bio-sensors are forecast to grow at a 10.40% CAGR through 2031, the quickest pace among product classes. They underpin glucose, lactate, and cortisol wearables and deliver rapid infectious-disease diagnostics, driving heightened procurement from hospitals and consumer-health brands. Pressure sensors still dominate volume in automotive tire-pressure monitoring, HVAC controllers, and process instrumentation, while temperature devices serve battery-management and cold-chain use cases. Electric actuators are increasingly preferred over pneumatic units for precise motion profiles, though hydraulics remain standard in heavy construction and aerospace flight controls.
Image sensors, particularly CMOS devices, serve automotive ADAS and industrial vision, with shipments rising in line with Level 2-plus automation. Flow and torque sensors cater to specialized medical ventilators and electric-vehicle powertrains, commanding premium pricing. Together these dynamics reinforce the sensors and actuators market as a multi-speed landscape where innovation clusters around miniaturization, multi-modal integration, and lifecycle cost reduction.
By Technology:
MEMS Architectures Capture Wireless EdgeMEMS devices accounted for 68.43% of the sensors and actuators market share in 2025. Batch silicon fabrication lowers unit cost to under USD 2 while enabling co-packaged ASIC logic. Total shipments from a leading European supplier surpassed 4 billion units in 2025, buoyed by smartphone, wearable, and automotive orders. Conventional macroscale sensors still serve harsh environments such as gas turbines and subsea wells where MEMS reliability tapers, yet that niche is narrowing as hermetic wafer-level packaging broadens MEMS temperature and vibration envelopes.
Wireless networks amplify the appeal of MEMS parts because coin-cell batteries can power them for years, whereas conventional sensors often require wired feeds. Foundries in Taiwan and Japan committed more than USD 500 million to expand 8-inch MEMS lines in 2025, targeting automotive safety and industrial vibration applications. As packaging innovation advances, MEMS penetration should deepen across process-automation, aerospace, and medical devices, further enlarging the sensors and actuators market size.
By Connectivity:
Wireless Networks Unlock Retrofit EconomicsWireless connectivity represented 54.29% of 2025 revenue and is projected to rise at an 11.10% CAGR to 2031. Eliminating conduit and cable can cut installation cost by up to 60%, unlocking retrofits in brownfield plants and aging commercial real estate. Bluetooth LE, Zigbee, and LoRaWAN dominate smart-building and smart-city deployments, while WirelessHART and ISA100.11a offer deterministic latency for process industries.
Safety-critical domains such as brake-by-wire and flight controls still require deterministic wired links like CAN, EtherCAT, or PROFINET. Yet 5G private networks with ultra-reliable low-latency profiles now approach fieldbus response times, blurring boundaries and widening wireless avenues in discrete manufacturing. The result is an expanding installed base of battery-powered sensor nodes feeding cloud and edge platforms, reinforcing volume growth in the sensors and actuators market.
By Output Signal:
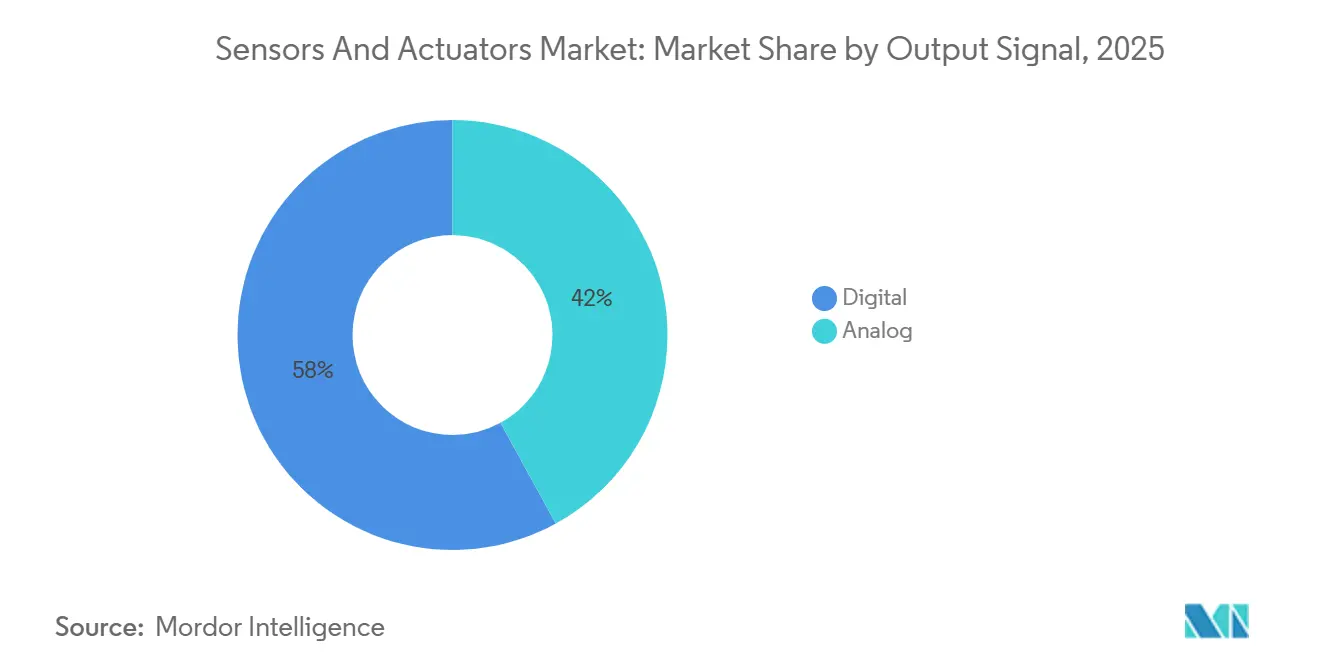
Digital Interfaces Simplify System IntegrationDigital-output devices captured 57.98% revenue in 2025 and are growing at 11.28% CAGR. Embedded ADCs shrink circuit-board area by up to half and enable multi-drop busses that slash wiring harness bulk in vehicles and machines. Automotive-grade digital pressure and temperature sensors with functional-safety certification are proliferating in electric-vehicle battery packs and brake systems.
Analog 4-20 mA loops endure in process plants where legacy PLCs expect current-loop inputs, but hybrid devices now offer concurrent analog and digital pins, smoothing migration without forklift upgrades. As new builds default to digital, and retrofit economics evolve, digital interfaces are expected to eclipse analog in most verticals before the end of the decade, further lifting the sensors and actuators market.
By End-User Industry:
Healthcare Devices Outpace Traditional VerticalsHealthcare is forecast to post a 14.10% CAGR through 2031, spurred by continuous glucose monitors, smart inhalers, and point-of-care diagnostics. Automotive remains the largest buyer at 24.66% share in 2025 owing to ADAS and electrification. Industrial automation and robotics integrate vibration, vision, and force sensors for cobots and guided vehicles, while consumer electronics pulls billions of MEMS units into phones, watches, and earbuds each year.
Oil and gas operators demand ruggedized pressure and acoustic sensors for downhole drilling and leak detection, whereas aerospace entails radiation-tolerant designs with strict certification. Building automation uses occupancy and CO₂ sensors for energy savings, and utilities modernize grids with leak-detection arrays. Collectively, these end-users sustain diversified revenue streams that stabilize the sensors and actuators market across cycles.
Geography Analysis
APAC Sensors and Actuators Market
Asia-Pacific accounted for 37.38% of global revenue in 2025 and will grow at a 12.88% CAGR to 2031, fueled by China’s 290,000 new robot installations, India’s electronics mandates, and South Korea’s industrial 5G networks. Japan’s wafer-capacity additions are easing earlier MEMS shortages, while Australian miners deploy autonomous haulage systems laden with LiDAR and radar.
North America Sensors and Actuators Market
North America ranks second as predictive-maintenance adoption climbs in refineries and discrete manufacturing. U.S. factories integrate edge-AI gateways that crunch vibration and temperature streams, while Canadian oil-sands producers retrofit high-temp sensors into SAGD wells. Mexican automotive plants add pressure and inertial sensors as near-shoring accelerates electric-vehicle production.
EMEA and South America Sensors and Actuators Market
Europe advances sensor content through electrified drivetrains and Level 2-plus ADAS, but wireless rollouts in critical infrastructure have slowed under NIS2 cyber-security rules. The Middle East prioritizes hydrogen pipelines and carbon-capture megaprojects that need specialty instrumentation. South American mines in Brazil and Chile automate fleets with ruggedized sensory suites, and African utilities gradually adopt water-quality and air-quality nodes as infrastructure spending ticks upward.
Regulatory Landscape
Regulation affecting sensors and actuators is increasingly centered on cyber security, product assurance, and trade controls for electronics sub-systems. In Europe, the Cyber Resilience Act (Regulation (EU) 2024/2847) creates product-with-digital-elements obligations, including vulnerability handling, with initial vulnerability reporting requirements starting in September 2026. This is pushing connected sensor and actuator vendors toward secure-by-design firmware, secure update mechanisms, and documented vulnerability processes.
Cyber security requirements are also tightening in other major markets, affecting connected device design choices and certification timelines. Australia applied mandatory security standards for consumer-grade smart devices manufactured on and from March 4, 2026 (Cyber Security (Security Standards for Smart Devices) Rules 2025), which shapes wireless sensor node requirements such as access control and software update provisions for in-scope devices. Separately, U.S. actions published via the Federal Register in early 2026 around Section 232 and semiconductor-related imports increase compliance and cost complexity for hardware supply chains, particularly for sensor assemblies incorporating semiconductor derivatives and metal-intensive housings. China continues to update national standards (for example, GB/T 30111-2025 implemented from September 1, 2025), which can affect qualification steps for specialized sensing products.
Competitive Landscape
The sensors and actuators market remains moderately fragmented: the top ten vendors hold 40%–45% of revenue while numerous specialists serve niches. Strategic acquisitions aim to secure MEMS IP and wafer access, exemplified by a 2025 piezoelectric-sensor takeover and a 2024 MEMS microphone purchase. Patent volumes in piezoelectric energy harvesting, neuromorphic fusion, and distributed acoustics exceed 50 filings each from multiple leaders.
Technology leadership hinges on embedding edge-AI accelerators into sensor interfaces, trimming latency and cloud fees. Analog and mixed-signal giants brought machine-learning cores into ASICs that sit next to vibration or temperature transducers, letting industrial clients shift anomaly detection from the server to the sensor. Smaller challengers differentiate via sector-specific form factors for food processing, pharma sterility, or wafer-fab cleanrooms, exploiting holes left by one-size incumbents.
Wireless and digital-first architectures are lowering barriers for software-centric entrants that monetize data analytics rather than hardware, but established manufacturers preserve scale advantages in reliability testing, global distribution, and certification. Consequently, rivalry will likely intensify around application-specific modules bundled with cloud or edge intelligence, reinforcing sustained innovation cycles in the sensors and actuators market.
Sensors and Actuators Industry Leaders
-
TE Connectivity Ltd
-
Texas Instruments Inc
-
Honeywell International Inc
-
Emerson Electric Co.
-
Bosch Sensortec
- *Disclaimer: Major Players sorted in no particular order
Sensors and Actuators Market Companies Covered in this Report
- TE Connectivity
- Honeywell International Inc.
- Bosch Sensortec GmbH
- Emerson Electric Co.
- Texas Instruments Incorporated
- Schneider Electric SE
- Siemens AG
- SMC Corporation
- Parker-Hannifin Corporation
- Renesas Electronics Corporation
- Infineon Technologies AG
- ABB Ltd.
- Rockwell Automation Inc.
- NXP Semiconductors N.V.
- Denso Corporation
- Analog Devices Inc.
- Flowserve Corporation
- Schlumberger Limited
- Balluff GmbH
- OMRON Corporation
- STMicroelectronics N.V.
- KYOCERA AVX Components
- Festo SE and Co. KG
Market Opportunities and Future Outlook
A key whitespace is higher-value sensing and actuation content per system as automation architectures shift from discrete components to integrated, decentralized modules that simplify wiring, commissioning, and diagnostics. In industrial automation and robotics, the move toward standardized communication and richer device diagnostics supports demand for sensors and actuators that incorporate condition monitoring, device identity, and parameterization, widening bill-of-material share beyond the transducer itself. Application pull is visible in precision platforms where sensor density and actuator count scale together under tight alignment and feedback requirements, such as the TMT primary mirror control approach using 1,476 precision electromechanical actuators and 2,772 capacitive edge sensors.
Energy and efficiency-driven upgrades also create room for vendors to reduce system-level resource use and maintenance burden, especially in pneumatic and hybrid actuation. In July 2026, Festo updated its VTUX valve terminal platform for end-of-arm tooling by integrating pneumatic control, vacuum generation, and I/O into a single decentralized unit, highlighting customer preference for compact actuation islands that reduce installation complexity and compressed-air usage while increasing available diagnostic signals. At the technology frontier, self-powered and battery-minimizing concepts for wireless sensors, including 2026 academic research on triboelectric wireless sensing for robotic control, reinforce retrofit-oriented deployment models where battery maintenance and wiring costs limit density, consistent with the broader shift toward wireless and edge-intelligent devices.
Recent Industry Developments in Sensors and Actuators Market
- June 2026: Texas Instruments introduced the BQ79826Z-Q1 battery monitor with an integrated electrochemical impedance spectroscopy (EIS) engine for EVs and energy storage. Adding EIS into a high-cell-count monitoring device increases the sensing content within battery management systems and supports more diagnostic-rich platforms that pair sensing with local intelligence.
- March 2026: Texas Instruments partnered with NVIDIA to advance real-time motor control, sensing, and radar technology building blocks aimed at humanoid robot safety. The collaboration lifts sensor fusion and low-latency control requirements, increasing the value of tightly integrated sensing and actuation elements in robotics stacks.
- September 2024: TE Connectivity completed its acquisition of Sense Eletronica Ltda in Brazil to expand its presence in factory and process automation sensors. The deal strengthens regional coverage and broadens the addressable installed base for industrial sensing solutions across Latin American automation projects.
Sensors and Actuators Market Report Scope and Research Methodology
Market Definition and Coverage
This market covers revenues generated from sensors that measure physical or chemical conditions and actuators that convert control signals into physical action across industrial, automotive, consumer, medical, and infrastructure end uses worldwide.
Scope exclusions: We exclude sensing and control software, stand-alone analytics, and adjacent electronic components unless they are sold as part of a sensor or actuator offering.
Segments Covered in This Report
- By Product Type
- Sensors
- Pressure Sensors
- Temperature Sensors
- Position Sensors
- Level Sensors
- Image Sensors
- Chemical/Bio-Sensors
- Torque Sensors
- Flow Sensors
- Actuators
- Hydraulic Actuators
- Pneumatic Actuators
- Electric Actuators
- Magnetic Actuators
- Mechanical Actuators
- Linear Actuators
- Rotary Actuators
- Sensors
- By Technology
- MEMS
- Non-MEMS / Conventional
- By Connectivity
- Wired
- Wireless
- By Output Signal
- Digital
- Analog
- By End-User Industry
- Automotive and Mobility
- Industrial Automation and Robotics
- Consumer Electronics and Wearables
- Healthcare and Medical Devices
- Oil, Gas and Energy
- Aerospace and Defense
- Building Automation and HVAC
- Utilities, Water and Waste-Water, Power
- Mining and Metals
- By Geography
- North America
- United States
- Canada
- Mexico
- South America
- Brazil
- Argentina
- Rest of South America
- Europe
- Germany
- United Kingdom
- France
- Italy
- Spain
- Rest of Europe
- Asia Pacific
- China
- Japan
- South Korea
- India
- Australia
- New Zealand
- Rest of Asia-Pacific
- Middle East and Africa
- Middle East
- United Arab Emirates
- Saudi Arabia
- Turkey
- Rest of Middle East
- Africa
- South Africa
- Nigeria
- Kenya
- Rest of Africa
- Middle East
- North America
Data Sources, Market Sizing, and Validation
Desk Research
We start by mapping how demand forms by end use, then we anchor the model with public indicators that can be checked year after year. Useful references include sources such as US Census Bureau manufacturing data, Eurostat industrial production series, UN Comtrade trade statistics for relevant HS categories, and OECD STAN databases for industry structure. For technology direction and adoption signals, we review non-paywalled materials such as IEEE publications and standards-related releases, plus patent databases to track filing intensity in MEMS and sensing interfaces.
To convert these signals into a realistic revenue curve, we add supplier-side context from annual reports, investor presentations, and reputable business press coverage of capacity additions and product mix changes. Where available, we also use paid subscription sources covering company financials, and a separate paid source covering patent and news intelligence, to reduce missing-data issues and keep company-level assumptions consistent. The desk research sources listed here are illustrative only, and many other public and paid references were used for data collection, cross-checks, and clarification.
Primary Interviews and Surveys
Primary interviews and structured surveys are used to stress test the desk model, especially where pricing, wireless attachment, or MEMS share is changing quickly. We speak with a mix of component manufacturers, distribution-side contacts, and engineering or procurement stakeholders from key consuming industries across APAC, EMEA, and the Americas, so assumptions can be corrected before totals are finalized.
Distribution of primary research fieldwork respondents
| Company type | Respondent position | Region |
|---|---|---|
| Top tier: 38% | CXOs: 21% | APAC: 47% |
| Mid tier: 40% | Functional/Unit leaders: 23% | EMEA: 34% |
| Smaller Players: 22% | Managers: 56% | Americas: 19% |
Market-Sizing & Forecasting
Market sizing starts with a top-down build that reconstructs the demand pool by end-use industries and technology choices, then ties it back to observable production and trade direction for electronics and industrial equipment. To keep the model practical, we focus on a limited set of repeatable drivers, such as factory automation investment trends, vehicle production and feature penetration (for safety and powertrain sensing), consumer device unit shipments, the wired versus wireless split, and the MEMS versus non-MEMS mix, which affects average selling prices.
After the demand-side view is formed, we run selective bottom-up checks to ensure the total does not drift away from reality. These checks typically use supplier roll-ups for a sampled set of relevant players, channel checks on typical ASP ranges by sensor class, and sampled volume-by-application math where shipment proxies are available. When a data gap appears for a smaller niche, we interpolate using nearby applications with similar pricing and adoption patterns, then validate the direction through expert feedback.
For forecasting, we use scenario analysis supported by variable-level expectations gathered in interviews, and we keep scenarios grounded in items respondents can explain, such as expected automation spend, electrification pace, healthcare device build plans, and wireless adoption in industrial sites. Forecast outputs are reviewed year by year so sharp step changes are accepted only when a clear trigger exists, such as regulation-driven feature rollout or a major cost-down in MEMS packaging.
Data Validation & Update Cycle
We validate the final numbers through triangulation across demand indicators, supplier commentary, and independent macro series, then we run variance checks by region, technology, and end-use to catch outliers early. Where a split looks unusual, such as an unexpected jump in wireless share or a sudden ASP change, analysts recheck the calculation trail and re-contact sources to confirm whether a one-time event is being over-counted.
Before sign-off, the model is reviewed in multiple steps, including a fresh reviewer pass that checks year-over-year continuity and consistency with known industry cycles. Reports are refreshed annually, with interim updates made when material events occur, such as large capacity expansions, regulatory shifts, or sharp currency moves. Right before delivery, we perform a final update sweep so clients receive the latest market view.
Mordor Intelligence's Global Sensors and Actuators Market Size Compared With Other Published Estimates
Published market values for sensors and actuators often do not match because the scope line is drawn differently, and because the pricing logic is not always explained consistently. Differences also show up when one study emphasizes a narrower set of end uses, or when the forecast base year and currency timing are not aligned.
Smart sensor modules that bundle control ICs, embedded software, or broader IoT platform value sit outside Mordor Intelligence's scope, which keeps the estimate tied to sensor and actuator hardware revenues across the stated end-user industries. On the other hand, some published figures lean heavily on high-level electronics totals and then apply an assumed share without testing wired versus wireless mix, MEMS penetration, or end-use adoption intensity through interviews, which can widen the spread.
Benchmark comparison
| Source | Market Size | Gaps in Research Methodology |
|---|---|---|
| Mordor Intelligence | USD 21.89 B (2026) | |
| Industry Publisher A | USD 145.60 B (2025) | Uses a much broader revenue pool for sensors and actuators, and the category descriptions suggest wider inclusion of adjacent electronics and solution elements, which inflates comparability versus a hardware-only view. |
| Industry Publisher B | USD 195.10 B (2024) | Reports sensors only and excludes actuators, and it also operates at an all-sensors level where mix and pricing differences across end-use industries are not always reconciled to the combined sensors-plus-actuators definition. |
The spread across sources mainly comes from what is counted as product value and how tightly pricing and adoption assumptions are validated. By keeping the scope limited to sensors and actuators, and then checking key splits like connectivity, output signal, and MEMS mix through interviews, our number stays traceable to clear drivers that can be revisited on the next update.
Key Questions Answered in the Report
What is the projected value of the sensors and actuators market by 2031?
The market is forecast to reach USD 34.24 billion by 2031, growing at a 9.36% CAGR from 2026.
Which region is expanding the fastest?
Asia-Pacific leads with a 12.88% CAGR through 2031, driven by robotics, automotive electronics, and private 5G rollouts.
Which product category is growing most rapidly?
Chemical and bio-sensors are advancing at a 10.40% CAGR thanks to demand in wearables and point-of-care diagnostics.
Why are MEMS devices gaining market share?
MEMS batch fabrication lowers cost, enables miniaturization, and supports long-life wireless deployments, giving them a 68.43% share in 2025.