
Sciatica Market Size and Share
Market Overview
| Study Period | 2020 - 2031 |
|---|---|
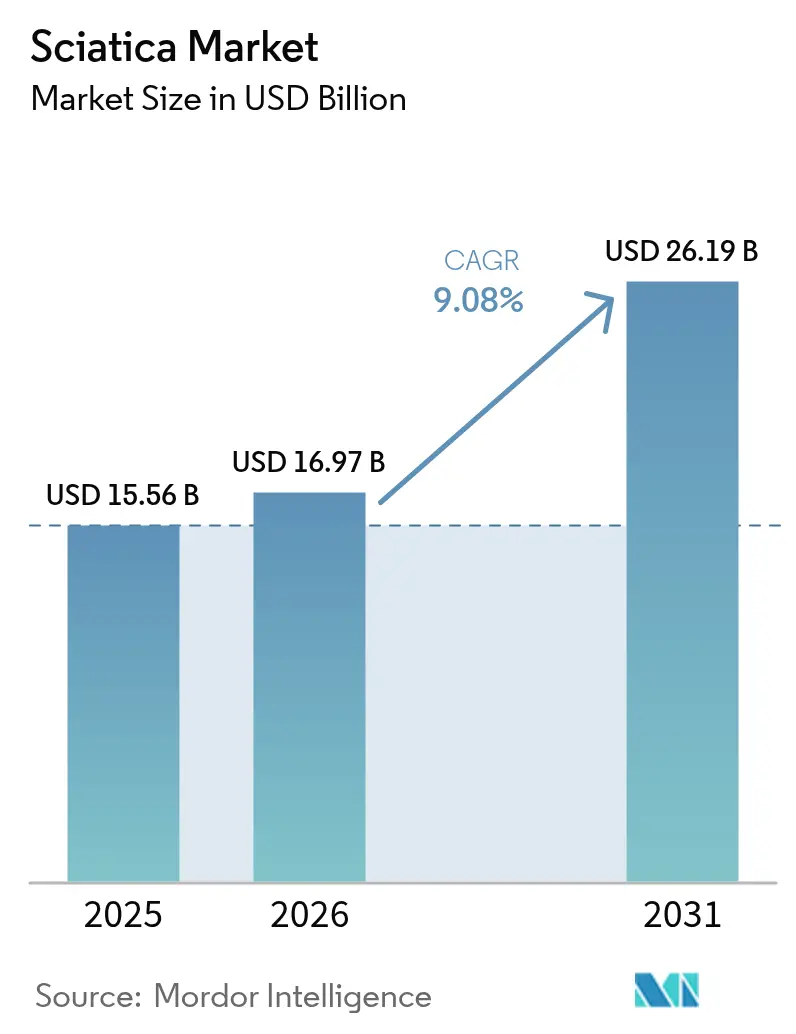
| Market Size (2026) | USD 16.97 Billion |
| Market Size (2031) | USD 26.19 Billion |
| Growth Rate (2026 - 2031) | 9.08 % |
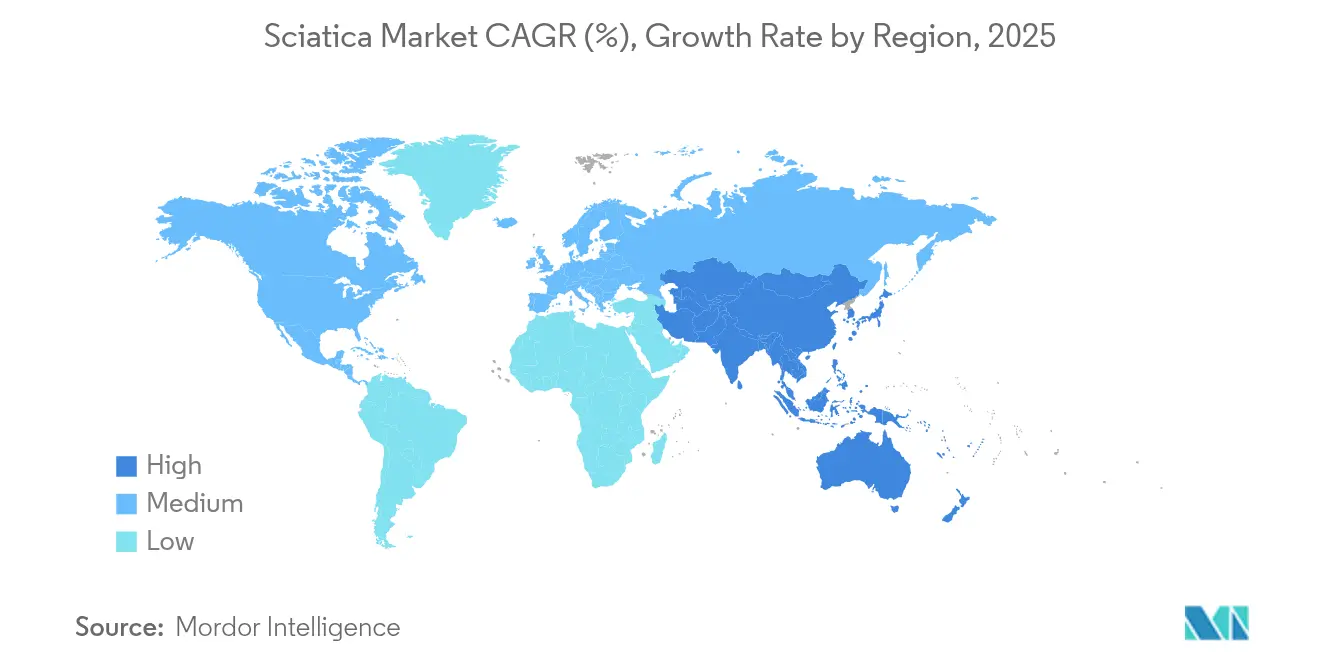
| Fastest Growing Market | Asia-Pacific |
| Largest Market | North America |
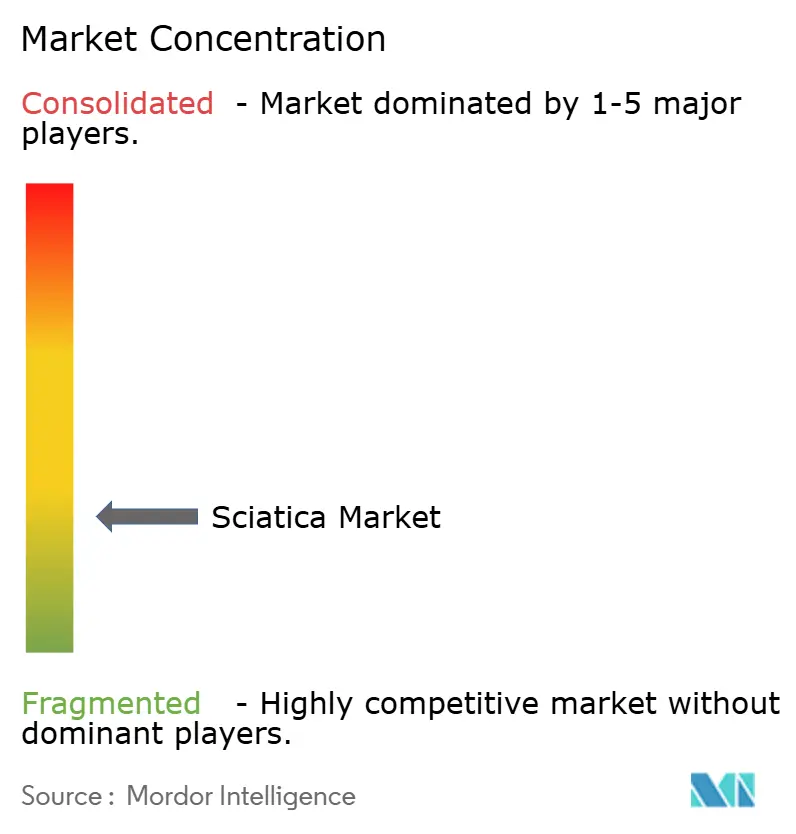
| Market Concentration | Low |
Major Players *Disclaimer: Major Players sorted in no particular order Image © Mordor Intelligence. Reuse requires attribution under CC BY 4.0. | |
Sciatica Market Analysis by Mordor Intelligence
The sciatica market size is expected to grow from USD 15.56 billion in 2025 to USD 16.97 billion in 2026 and is forecast to reach USD 26.19 billion by 2031 at 9.08% CAGR over 2026-2031. Demand rises as aging populations experience higher rates of lumbar disc degeneration, while AI-assisted imaging shortens diagnostic pathways and supports earlier therapeutic intervention. Minimally invasive outpatient procedures now compete with hospital-based surgery, and expanding payor coverage for epidural steroid injections sustains interventional volumes. North America retains market leadership on the back of advanced reimbursement frameworks, yet Asia-Pacific is the fastest-growing region owing to widening healthcare access and rising incomes. Technology-led differentiation rather than scale now defines competition as illustrated by closed-loop neuromodulation approvals and targeted acquisitions.
Key Report Takeaways
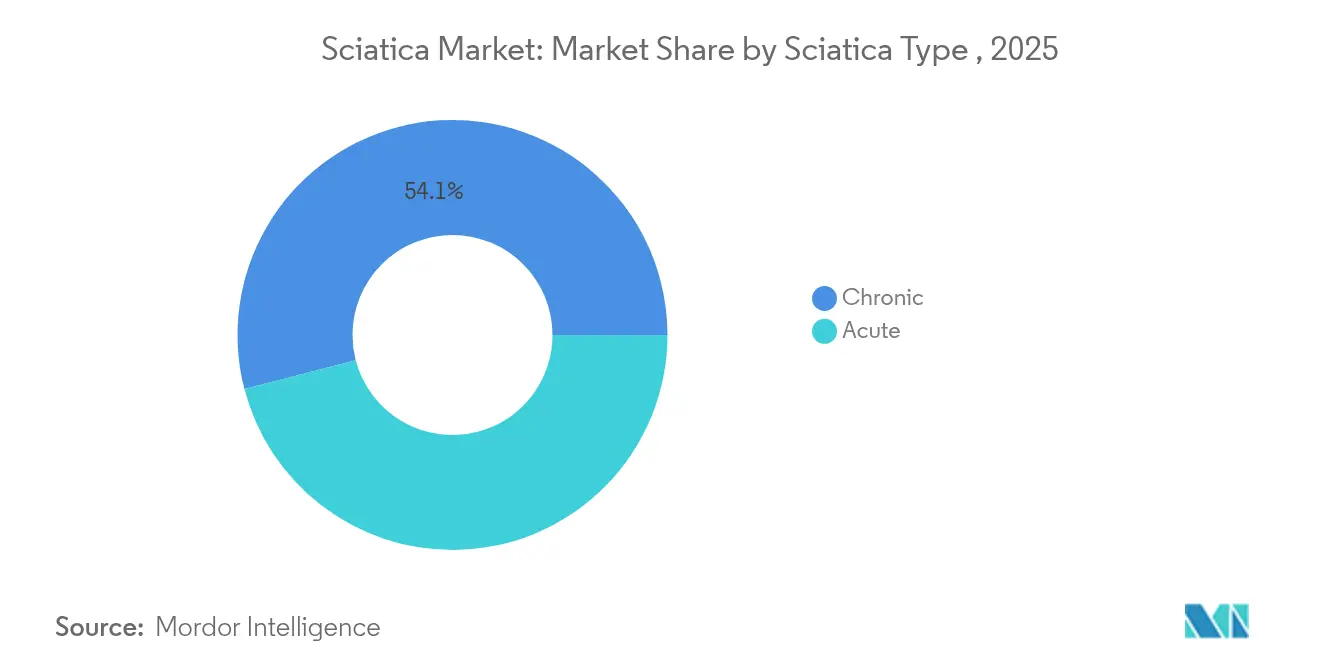
- By sciatica type, chronic cases held 54.05% of the sciatica market share in 2025, while acute cases are expanding at 9.92% CAGR to 2031.
- By pharmacological therapy, NSAIDs led with 39.05% revenue share in 2025; biologics and regenerative injectables are set to grow at 9.85% CAGR.
- By non-pharmacological modality, physical and exercise therapy accounted for 34.20% of the sciatica market size in 2025, whereas radiofrequency ablation is advancing at 10.6% CAGR.
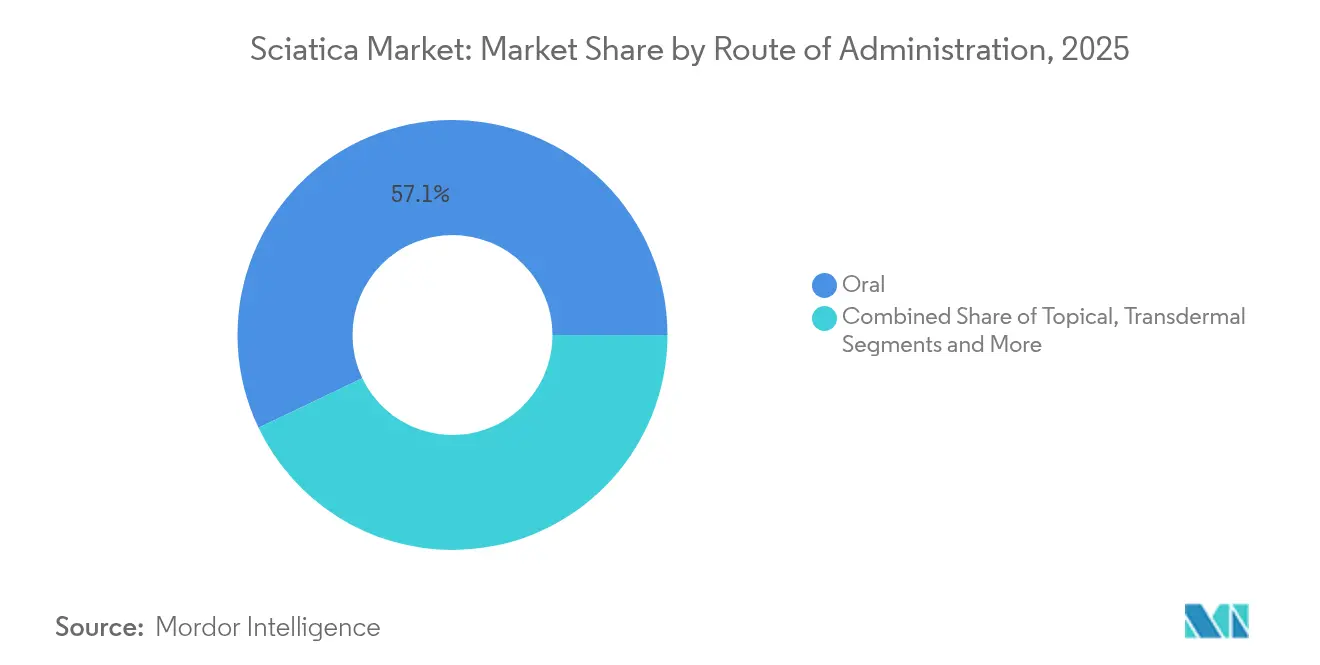
- By route of administration, oral delivery retained 57.10% share in 2025; transdermal systems are projected to rise at 9.9% CAGR.
- By end user, hospitals captured 39.10% of the market in 2025, yet home-care settings are progressing at 10.75% CAGR.
- By geography, North America commanded 39.20% share in 2025; Asia-Pacific is forecast to grow at 9.88% CAGR through 2031.
Note: Market size and forecast figures in this report are generated using Mordor Intelligence’s proprietary estimation framework, updated with the latest available data and insights as of 2026.
Market Trends and Insights
Drivers Impact Analysis of Sciatica Market*
| Driver | (~) % Impact on CAGR Forecast | Geographic Relevance | Impact Timeline |
|---|---|---|---|
| Ageing populations & rising lumbar-disc degeneration rates | +2.1% | Global, highest in North America & Europe | Long term (≥4 years) |
| High diagnostic imaging penetration in OECD economies | +1.8% | North America & EU, spill-over to APAC | Medium term (2-4 years) |
| Shift toward minimally invasive outpatient pain procedures | +1.6% | Global, led by North America & Europe | Medium term (2-4 years) |
| Expanded payor coverage for epidural steroid injections | +1.3% | North America & EU | Short term (≤2 years) |
| AI-enabled MRI triage tools slash waiting times | +0.9% | OECD economies, early adoption in North America | Short term (≤2 years) |
| Growing direct-to-consumer nutraceutical bundles for sciatica | +0.7% | Global, strongest in North America & APAC | Medium term (2-4 years) |
| Source: Mordor Intelligence | |||
Ageing Populations & Rising Lumbar-Disc Degeneration Rates
Demographic transition is raising chronic pain prevalence as the ≥65-year cohort expands and 27.5 million elderly individuals live with spinal deformities. Degenerative disc disease already affects 266 million people worldwide, translating into steady demand for conservative and interventional care. Payers are broadening coverage for minimally invasive techniques that reduce surgical risk in comorbid seniors, and device makers are tailoring implants for osteoporotic bone quality. Together these factors underpin a durable growth base for the sciatica market.
High Diagnostic Imaging Penetration in OECD Economies
AI-reconstructed lumbar MRI can cut scan time by 45% without sacrificing accuracy. Automated image analysis improves early detection of disc herniation and stenosis, steering patients toward preventive therapies rather than delayed surgery. Hospitals report MRI throughput gains that ease bottlenecks in elective care, and reimbursement policies reward evidence-based triage[1]Centers for Medicare & Medicaid Services, “Facet Joint Interventions for Pain Management (DL38803),” cms.gov. Faster diagnosis strengthens clinical outcomes and accelerates revenue cycles, reinforcing imaging as a catalyst for the sciatica market.
Shift Toward Minimally-Invasive, Outpatient Pain Procedures
Endoscopic spine surgery yields 92% patient satisfaction with shortened stays, supporting migration to ambulatory centers. Basivertebral nerve ablation delivers clinically meaningful pain reduction in 77.4% of real-world patients at 12 months. Lower facility costs and quicker recovery appeal to payers and patients alike, prompting hospitals to open dedicated outpatient suites. These shifts intensify competition yet enlarge the addressable sciatica industry.
Expanded Payor Coverage for Epidural Steroid Injections
Medicare and major U.S. insurers continue to cover transforaminal injections when conservative therapy fails, though injection frequency is capped to curb steroid exposure. Policies require imaging guidance and strict documentation, fostering uptake of integrated radiology-anesthesia workflows. Stable reimbursement ensures volumes but pressures providers to demonstrate value through outcome tracking, underpinning procedural revenues within the sciatica market.
Restraints Impact Analysis of Sciatica Market*
| Restraint | (~) % Impact on CAGR Forecast | Geographic Relevance | Impact Timeline |
|---|---|---|---|
| Lack Of Universally Accepted Diagnostic Criteria | -1.4% | Global, most pronounced in developing markets | Long term (≥ 4 years) |
| Abundant Low-Cost Off-Label NSAID Usage | -1.1% | Global, highest impact in price-sensitive markets | Medium term (2-4 years) |
| Procedure Reimbursement Cuts In Europe | -0.8% | Europe, with spill-over effects to other regions | Short term (≤ 2 years) |
| Post-Opioid-Crisis Caution Limiting Prescription Renewals | -0.6% | North America, expanding to other regions | Medium term (2-4 years) |
| Source: Mordor Intelligence | |||
Abundant Low-Cost Off-Label NSAID Usage
NSAIDs account for 39.53% of pharmacological sciatica therapies and remain inexpensive first-line options despite safety issues. High-risk prescribing consumes USD 31 million annually in the NHS and leads to 6,000 lost QALYs over 10 years. Long-term NSAID users face elevated knee-replacement risk, yet prescribers still favor these drugs where budgets are tight. As specialized biologics must prove superior value, cheap generics dampen near-term growth of the sciatica market.
Post-Opioid-Crisis Caution Limiting Prescription Renewals
Outpatient spine programs cut narcotic scripts by 37% through opioid-reduction protocols without harming outcomes. Policymakers encourage non-opioid modalities, boosting demand for neuromodulation and regenerative injections. Still, heightened oversight complicates access for appropriate candidates, tempering prescription-driven revenues in the sciatica market.
*Our forecasts treat driver/restraint impacts as directional, not additive. The impact forecasts reflect baseline growth, mix effects, and variable interactions.
Sciatica Market Segment Analysis
By Sciatica Type:
Chronic Dominance Drives InnovationChronic cases held 54.05% of the sciatica market share in 2025, underpinning steady demand for long-term management solutions. Acute presentations expand at 9.92% CAGR as prompt AI-assisted imaging redirects patients to early intervention. Emerging biologics, including NF-kappa B decoy oligonucleotides, are delivering 12-month pain relief and disc height restoration, highlighting disease-modifying potential. Acute episodes benefit from proactive epidural injections and guided exercise that prevent degeneration. Combined, these trends reinforce segmentation-specific investment across the sciatica market.
A growing body of evidence positions intradiscal stem-cell therapy as a viable option for refractory chronic pain, with trials demonstrating improved disc volume and function. Health insurers are piloting value-based payment bundles that differentiate reimbursement for acute versus chronic pathways. As clinical guidelines mature, stakeholders expect clearer coding and accelerated coverage decisions—a dynamic that enlarges overall sciatica market size at the segment level.


By Pharmacological Therapies:
NSAIDs Face Emerging CompetitionTraditional NSAIDs led revenue with 39.05% share in 2025, yet safety-driven prescribing curbs sustained use. Biologics and regenerative injectables are growing 9.85% annually, reflecting payer readiness to reimburse interventions that delay surgery. Corticosteroids remain central for flare management, while anticonvulsants treat neuropathic components.
Innovations target disc pathology directly: allogeneic disc progenitor cells have improved pain and disability scores in randomized trials, with regulators reviewing fast-track designations. Novel COX-2 inhibitors aim to mitigate GI toxicity, though cardiovascular risk surveillance persists. The segment’s shift from symptomatic relief to regenerative repair supports premium pricing and lifts the sciatica market size for advanced pharmacology.
By Non-Pharmacological Treatment Modality:
Technology Transforms Traditional ApproachesPhysical and exercise therapy captured 34.20% of 2025 revenues, underscoring its role as first-line care. Radiofrequency ablation leads growth at 10.6% CAGR thanks to refined patient selection and outcome data. Epidural steroid injections persist despite debate, while closed-loop spinal cord stimulation systems such as Medtronic’s Inceptiv adjust therapy in real time to maintain analgesia.
Complementary approaches gain legitimacy through randomized trials demonstrating phytochemical efficacy in neuropathic pain. Chemonucleolysis with condoliase is emerging as a minimally invasive disc-dissolution method, attracting surgeons seeking alternatives to open discectomy. These hybrid modalities broaden choice and reinforce technology-centric competition in the sciatica market.
By Route of Administration:
Oral Dominance Challenged by InnovationOral delivery retained 57.10% share in 2025, owing to convenience and established prescribing habits. Transdermal systems are growing 9.9% CAGR as patches reduce systemic exposure; buprenorphine patches show favorable dosing economics in chronic low-back pain. Parenteral and epidural routes serve interventional needs, while topical diclofenac matches oral NSAID efficacy with fewer systemic events.
Direct-to-consumer nutraceutical sales via e-commerce deliver convenience but challenge clinicians to integrate self-selected supplements into evidence-based care. The convergence of novel delivery technologies and patient preference continues to diversify revenue sources across the sciatica market.
By End User:
Home-Care Surge Reshapes DeliveryHospitals generated 39.10% of 2025 revenues, reflecting their dominance in acute imaging and complex interventions. Home-care settings are advancing 10.75% CAGR, powered by telemedicine follow-up that reliably monitors post-operative recovery. Portable devices such as the FDA-cleared Kizu Spine Belt enable non-pharmacological therapy at home, supporting patient autonomy.
Ambulatory surgical centers and specialized pain clinics gain share as payers incentivize site-of-service shifts that lower costs while maintaining quality. Enhanced recovery after surgery protocols shorten stays for elderly fusion patients, illustrating system-wide adoption of efficiency best practices. These distributed models underpin sustained expansion of the sciatica market.
Geography Analysis
North America Sciatica Market
North America commanded 39.20% of global revenue in 2025, underpinned by comprehensive insurance coverage and rapid adoption of closed-loop spinal cord stimulators cleared by the FDA in 2024 and 2025. Medicare continues to reimburse epidural injections and selective nerve-root blocks under strict indications, supporting procedure volumes. An aging, sedentary population and high obesity prevalence sustain long-term demand, while robust research funding accelerates translational innovation.
Europe Sciatica Market
Europe remains sizeable but faces reimbursement cuts that temper procedure growth; nonetheless, cost-effective minimally invasive techniques align with EU health-system objectives. Adoption of AI-enabled MRI triage mitigates waiting-list pressures and improves early treatment access. Germany, the United Kingdom, and France prioritize evidence-based pathways, creating a stable environment for clinically validated devices and biologics.
APAC Sciatica Market
Asia-Pacific is the fastest-growing region at 9.88% CAGR as healthcare investments rise and aging demographics resemble Western patterns. Japan and South Korea lead technological uptake, while India expands access through insurance schemes and public-private partnerships. Multinational device makers localize production to meet regulatory requirements and tap cost-sensitive segments. Collectively these dynamics enlarge regional contributions to the sciatica market size.

Competitive Landscape
The market is fragmented: Medtronic, Boston Scientific, and Abbott hold entrenched channel relationships, yet smaller innovators secure share through differentiated technology. Globus Medical’s USD 250 million acquisition of Nevro in 2025 bolstered its neuromodulation portfolio and signaled accelerating consolidation. Closed-loop stimulators such as Inceptiv and HFX redefine performance benchmarks, narrowing the gap between incumbents and upstarts.
Vertical integration emerges as a strategic theme; firms bundle imaging AI, therapy devices, and remote-monitoring software to control the full continuum of care. Biotechnology entrants develop regenerative disc therapies, targeting disease modification rather than symptom relief, and partner with device firms for combined delivery platforms.
White-space opportunities arise in personalized medicine: genetic markers and predictive analytics guide therapy choice, promising stronger outcomes and payer acceptance. Market participants that align with evidence-based reimbursement and demonstrate cost utility will likely gain share across the sciatica market.
Sciatica Industry Leaders
Scilex Holding
SpineThera
Medtronic plc
Boston Scientific Corporation
Teva Pharmaceutical Industries
- *Disclaimer: Major Players sorted in no particular order
Sciatica Market Companies Covered in this Report
- Sorrento Therapeutics
- Scilex Holding
- SpineThera
- Eliem Therapeutics
- Sollis Therapeutics
- Sinfonia Biotherapeutics
- Seikagaku
- Kolon Life Science
- Aurobindo Pharma
- Teva Pharmaceutical Industries
- Pfizer
- Johnson & Johnson
- Medtronic
- Boston Scientific
- Abbott Laboratories
- Glenmark Pharmaceuticals
- Zydus Lifesciences
- Spine BioPharma
- Teikoku Pharma
- PainTEQ
- Vertex Pharmaceuticals

Market Opportunities and Future Outlook
White-space in sciatica care is concentrated in disease-modifying and non-opioid options that can move beyond symptomatic NSAID use (which led 39.05% revenue share in 2025). Pipeline activity supports this shift: Consano Bio initiated a Phase 1 clinical trial for C-1101 in chronic lumbosacral radiculopathy and then obtained FDA IND clearance in July 2026 to expand the program into the United States, reinforcing investment interest in sciatica-labeled pharmacologic pathways rather than generic low-back-pain positioning.
Non-pharmacological adoption is also creating commercialization room for FDA-cleared, procedure-adjacent technologies and reimbursement-aligned workflows. Examples include FDA clearance of the DRX9000-SL True Non-Surgical Spinal Decompression System (June 2025) for sciatica and herniated discs, Stryker's FDA 510(k) clearance for the OptaBlate BVN basivertebral nerve ablation system (May 2025), and expanded FDA indications for Boston Scientific's WaveWriter spinal cord stimulator systems (February 2024) for non-surgical chronic low back and leg pain. Across geographies, growth in ambulatory centers and home-care settings supports integrated offerings that combine imaging-driven triage, minimally invasive pain procedures, and remote follow-up tools to document outcomes demanded by payers.
Recent Industry Developments in Sciatica Market
- July 2026: Scilex Holding Company signed a binding term sheet with iHolding Group LLP for a proposed USD 100 million strategic investment. The funding initiative supports portfolio development and broader commercialization capacity for non-opioid pain assets relevant to lumbosacral radicular pain (sciatica). It also points to continued capital formation around differentiated therapies.
- July 2025: Fziomed received FDA De Novo classification and marketing authorization for Oxiplex gel for use in spine surgery. The gel is indicated to reduce postoperative leg pain and neurological symptoms in adults undergoing lumbar spine procedures. The De Novo outcome creates a clearer regulatory and coding pathway for adhesion barrier products positioned around post-surgical radicular symptom reduction.
- February 2024: Boston Scientific received FDA approval expanding indications for its WaveWriter spinal cord stimulator systems to include treatment of non-surgical chronic low back and leg pain. The label expansion broadens the treated population for neuromodulation and increases competitive pressure on alternative interventional modalities used in chronic radiating pain pathways.


Sciatica Market Report Scope and Research Methodology
Market Definition and Coverage
For this study, the market is defined as global revenues earned from products and care services used to diagnose, manage, or treat sciatica (pain linked to sciatic nerve irritation or compression) across clinical and outpatient settings.
Scope exclusions: We exclude general low back pain spend that is not documented as sciatica care, along with broad wellness offerings that are not prescribed or delivered as sciatica treatment.
Segments Covered in This Report
- By Sciatica Type
- Acute Sciatica
- Chronic Sciatica
- By Pharmacological Therapies
- Non-steroidal Anti-inflammatory Drugs (NSAIDs)
- Corticosteroids
- Antidepressants
- Anticonvulsants
- Opioids
- Emerging Biologics & Regenerative Injectables
- By Non-Pharmacological Treatment Modality
- Physical & Exercise Therapy
- Epidural Steroid Injection
- Radio-frequency Ablation
- Spinal Cord Stimulation
- Chemonucleolysis (Condoliase etc.)
- Complementary & Alternative (Acupuncture, Herbal)
- By Route of Administration
- Oral
- Topical
- Parenteral / Epidural
- Transdermal
- By End User
- Hospitals
- Specialty Pain Clinics
- Ambulatory Surgical Centers
- Home-care
- Rehabilitation Centers
- Geography
- North America
- United States
- Canada
- Mexico
- Europe
- Germany
- United Kingdom
- France
- Italy
- Spain
- Rest of Europe
- Asia-Pacific
- China
- Japan
- India
- South Korea
- Australia
- Rest of Asia-Pacific
- Middle East and Africa
- GCC
- South Africa
- Rest of Middle East and Africa
- South America
- Brazil
- Argentina
- Rest of South America
- North America
Data Sources, Market Sizing, and Validation
Desk Research
Desk research was used to build the basic demand pool and to keep assumptions realistic across regions. We referenced public health and utilization signals from sources such as the World Health Organization (WHO), the US CDC, the US NIH, and the OECD, since these sources help explain how back pain and nerve pain are diagnosed and treated.
Alongside this, we reviewed clinical guidance and evidence summaries from sources such as the National Institute for Health and Care Excellence (NICE), PubMed-indexed journals, and relevant government health department publications. We then cross-checked the commercial side using annual reports, investor presentations, and reputable press. Where needed, company financial intelligence, news and financials, and patent databases were used to confirm product launches, therapy adoption direction, and revenue mix indications for sciatica focused portfolios. The sources listed here are illustrative and not exhaustive, and additional public and paid references were used for data collection, validation, and clarification during the study.
Primary Interviews and Surveys
Primary work helped us convert broad epidemiology into an actual treated and addressable pool, and it also helped align what gets counted as sciatica care across settings. We spoke with a mix of clinicians, pain management and rehab providers, device and pharma stakeholders, payor side experts, and distributors across major regions. This input was used to test and adjust assumptions on procedure mix, typical care pathways, and price evolution.
Distribution of primary research fieldwork respondents
| Company type | Respondent position | Region |
|---|---|---|
| Top tier: 32% | CXOs: 13% | APAC: 41% |
| Mid tier: 54% | Functional/Unit leaders: 38% | EMEA: 33% |
| Smaller Players: 14% | Managers: 49% | Americas: 26% |
Market-Sizing & Forecasting
Sizing starts with a top-down build where prevalence and diagnosis rates are converted into treated patients, then mapped to common sciatica care pathways across drugs, procedures, rehab, and devices. Once the patient pool is reconstructed, revenues are estimated by applying a practical mix of utilization and pricing inputs, and then totals are validated using selective bottom-up checks like sampled supplier revenue roll ups, channel discussions, and ASP times volume sanity tests for major therapy types.
The inputs that move the model most include the share of patients receiving conservative care versus image-guided injections, the typical number of procedure visits per patient episode, uptake of physical therapy and rehabilitation programs, use of neuromodulation or minimally invasive interventions in refractory cases, and region-level pricing or reimbursement intensity. Since clinical practice varies, gaps in country data were handled by using proxy markets with similar care pathways and then rebalancing results using interview feedback. For forecasting, scenario analysis was used so we could reflect different adoption speeds for minimally invasive care, reimbursement tightening or expansion, and the pace at which newer biologic and device options diffuse into routine practice.
Data Validation & Update Cycle
Validation is done through cross-checks that compare the model against independent signals, such as procedure volumes, therapy mix direction, and whether implied spend per treated patient stays within realistic clinical ranges. When an outlier appears, inputs are revisited, currency timing is re-checked, and follow-up calls are triggered with the most relevant experts to confirm whether the change is real or a modeling artifact.
Before sign-off, the output is reviewed in steps by another analyst so assumptions, math, and scope rules are applied consistently across regions. Reports are refreshed annually, and interim updates are made when a material event shifts the demand picture, such as a guideline change, reimbursement move, or a major product approval. Before delivery, we run a final pass to ensure the newest public information is reflected in the current-year estimates.
Mordor Intelligence's Global Sciatica Market Size Compared Against Other Published Estimates
Published market numbers for sciatica can look far apart because each publisher decides what counts as sciatica spend and what is treated as adjacent back pain care. Differences also come from the year used for currency conversion, how pricing is trended forward, and whether procedure and rehab revenues are counted or left out.
The main gap comes from scope, where Mordor Intelligence counts sciatica-related care across drugs, image-guided pain procedures, rehabilitation programs, and neuromodulation devices, instead of restricting the total to only drug and surgery revenues. Another driver is the demand build, since some studies appear to start from a narrow therapy list without reconciling it back to treated patient volumes and the typical episode-of-care pathway. Update cadence also matters, because fast-moving assumptions, including procedure mix shifts and reimbursement pull-through, can change a current-year view even when long-term growth rates look similar.
Benchmark comparison
| Source | Market Size | Gaps in Research Methodology |
|---|---|---|
| Mordor Intelligence | USD 15.56 B (2025) | |
| Global Publisher A | USD 4.09 B (2025) | This estimate appears to be limited to treatment revenues focused on medication and surgical care, which can omit procedure-based pain interventions, rehabilitation services, and device-led therapies that often sit outside a strict pharma plus surgery view. |
| Industry Publisher B | USD 3.10 B (2024) | The scope seems closer to a narrower sciatica revenue definition, and the base year differs, which can further compress the number when rehab, procedure intensity, and price progression are not modeled through an episode-of-care lens. |
Looking at the spread, the difference is mainly explained by what is included as sciatica care and how the treated pool is converted into spend across the full pathway. By keeping assumptions tied to treated patients, therapy mix, and realistic pricing, we can offer a market size that is transparent to replicate and easier to interpret for planning.


Key Questions Answered in the Report
What is the current size of the sciatica market?
The sciatica market is valued at USD 16.97 billion in 2026 and is projected to reach USD 26.19 billion by 2031.
Which region leads the global sciatica market?
North America holds 39.20% of global revenue, supported by robust reimbursement policies and rapid adoption of advanced pain technologies.
Which treatment modality is growing fastest?
Radiofrequency ablation records the highest growth at 10.6% CAGR because minimally invasive techniques are increasingly preferred for durable pain relief.
How fast is the Asia-Pacific market expanding?
The Asia-Pacific sciatica market is forecast to grow at a 9.88% CAGR through 2031 due to expanding healthcare access and rising disposable incomes.
What role do biologics play in future therapy?
Biologics and regenerative injectables are forecast to grow 9.85% annually as clinical trials demonstrate durability and payers recognize disease-modifying value.
Page last updated on:


 Your data is secure and never sold or shared.


