
RNAi Technology Market Size and Share
Market Overview
| Study Period | 2020 - 2031 |
|---|---|
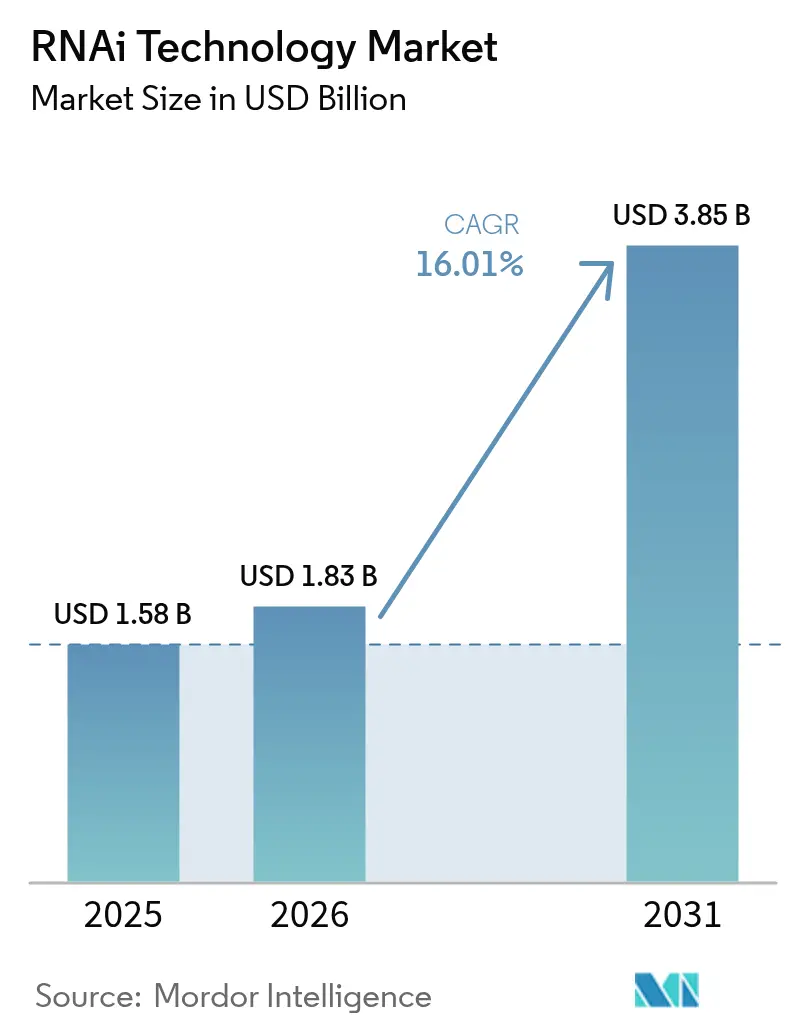
| Market Size (2026) | USD 1.83 Billion |
| Market Size (2031) | USD 3.85 Billion |
| Growth Rate (2026 - 2031) | 16.01 % |
| Fastest Growing Market | Asia Pacific |
| Largest Market | North America |
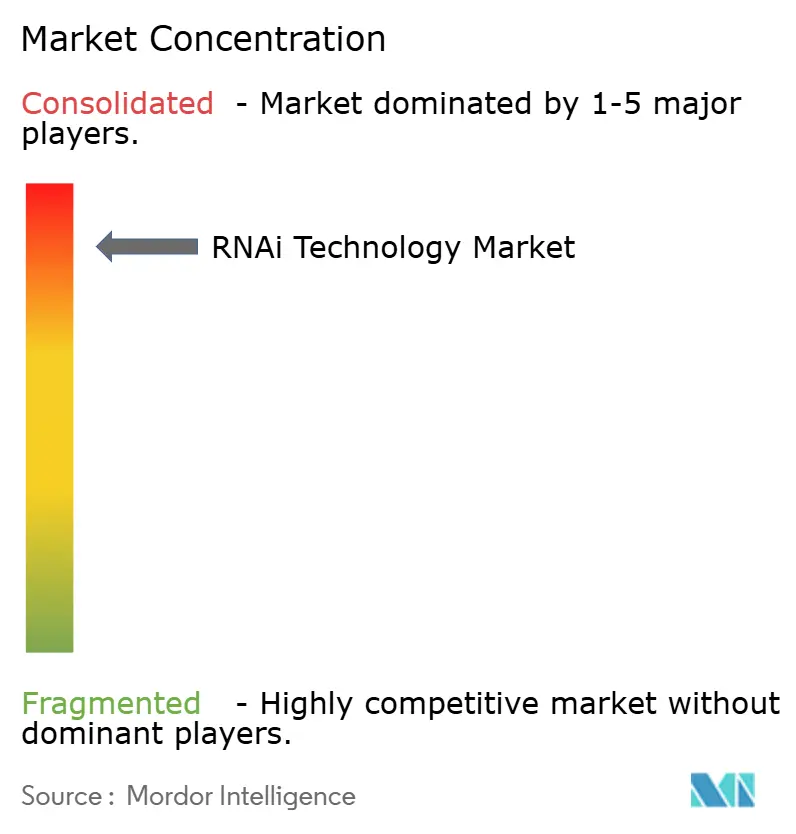
| Market Concentration | High |
Major Players *Disclaimer: Major Players sorted in no particular order Image © Mordor Intelligence. Reuse requires attribution under CC BY 4.0. | |
RNAi Technology Market Analysis by Mordor Intelligence
The RNAi technology market size is expected to grow from USD 1.58 billion in 2025 to USD 1.83 billion in 2026 and is forecast to reach USD 3.85 billion by 2031 at 16.01% CAGR over 2026-2031. This sharp climb mirrors the field’s move from exploratory gene-silencing concepts to proven therapeutic platforms after successive FDA and EMA approvals, large-scale GMP investments, and a wave of delivery breakthroughs that collectively decompress regulatory and manufacturing risk. Wider adoption in oncology, cardiometabolic disorders, and hematology is expanding the RNAi technology market beyond rare genetic diseases, while advanced lipid nanoparticles (LNPs) fine-tune tissue targeting and dampen off-target effects. Investor appetite has deepened; integrated pharmaceutical companies now dominate licensing and acquisition activity, and CDMO outsourcing is soaring as developers forgo in-house oligonucleotide plants to contain capital outlays. Regionally, North America retains leadership, but Asia-Pacific’s cost-effective production and rapid trial initiation position it as the fastest-growing arena, setting up a two-pole dynamic that will influence supply-chain choices through 2030.
Key Report Takeaways
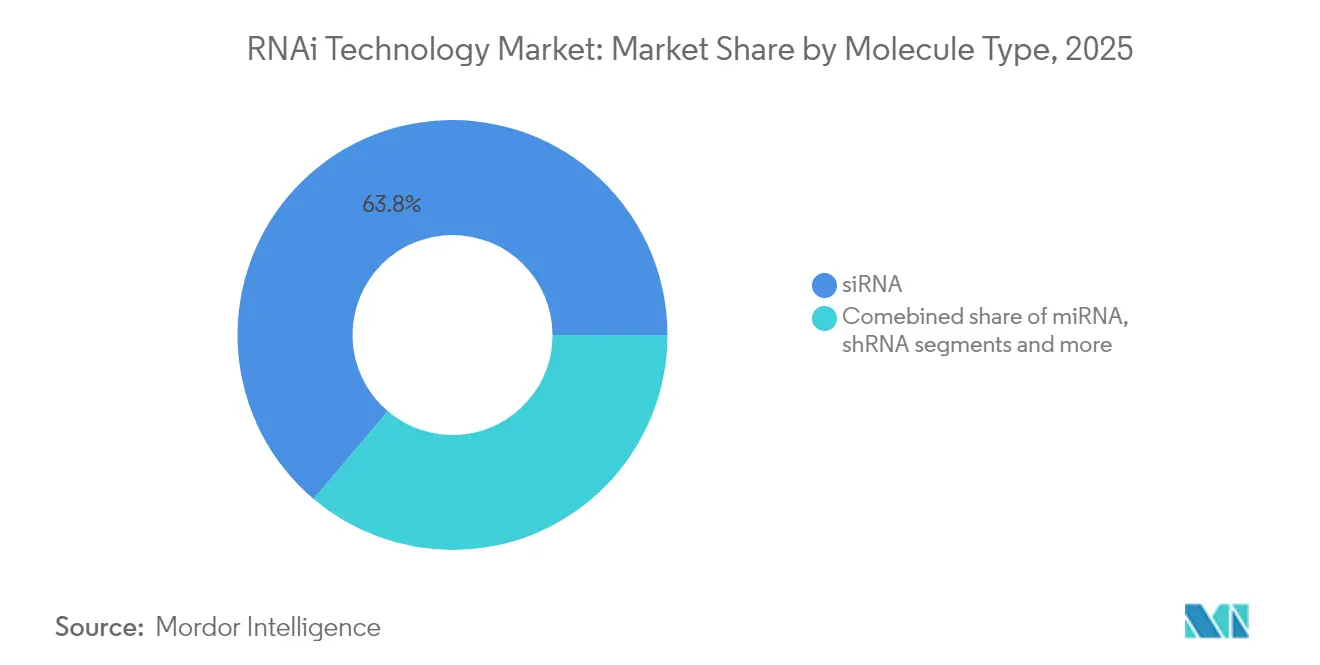
- By molecule type, siRNA captured 63.82% of the RNAi technology market share in 2025.
- By application, oncology accounted for 26.74% of the RNAi technology market size in 2025 and is expanding at a 16.38% CAGR through 2031.
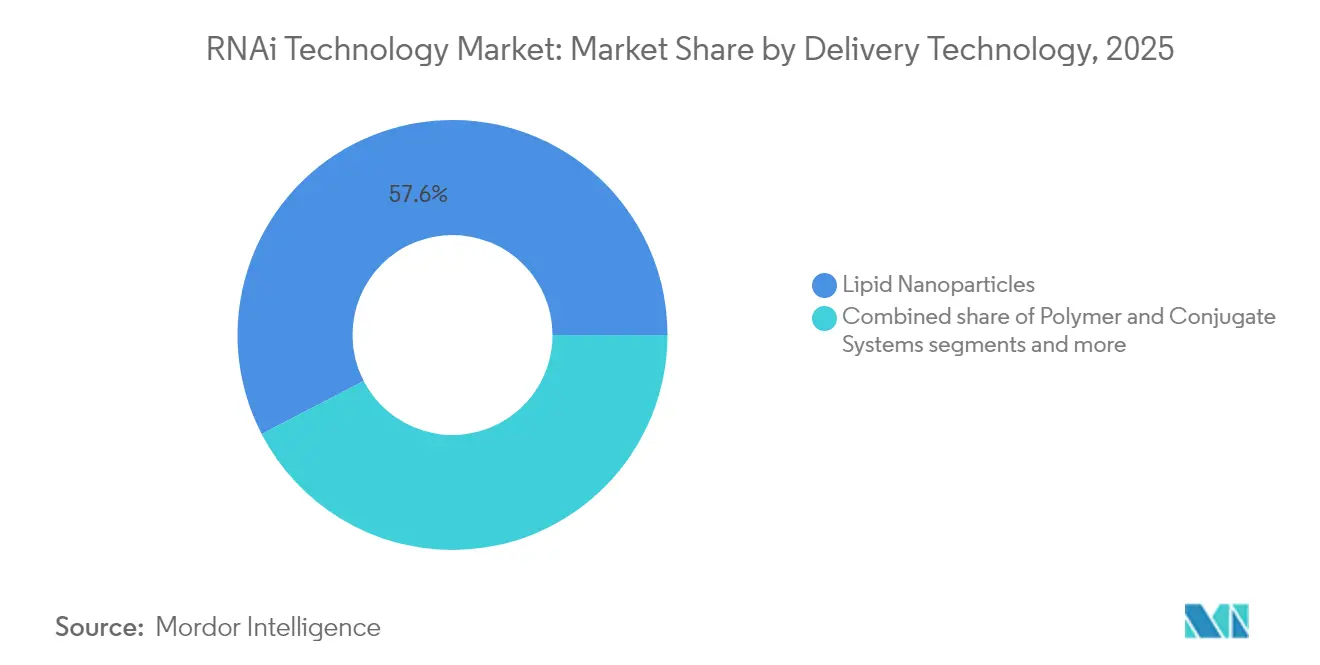
- By delivery technology, lipid nanoparticles held 57.61% revenue share in 2025; polymer-and-conjugate systems are projected to grow at 16.46% CAGR.
- By end user, pharmaceutical and biotechnology companies commanded 67.32% share of the RNAi technology market size in 2025, while CDMOs posted the highest projected CAGR at 16.95% through 2031.
- By geography, North America led with 41.02% of the RNAi technology market share in 2025; Asia-Pacific is forecast to expand at a 17.25% CAGR to 2031.
Note: Market size and forecast figures in this report are generated using Mordor Intelligence’s proprietary estimation framework, updated with the latest available data and insights as of 2026.
Market Trends and Insights
Drivers Impact Analysis of RNAi Technology Market*
| Driver | (~) % Impact on CAGR Forecast | Geographic Relevance | Impact Timeline |
|---|---|---|---|
| FDA/EMA approvals of siRNA drugs accelerating investor confidence | +4.2% | Global, with primary impact in North America & Europe | Medium term (2-4 years) |
| Advances in lipid-nanoparticle (LNP) delivery enhancing in-vivo stability | +3.8% | Global, led by North America and Asia-Pacific manufacturing hubs | Short term (≤ 2 years) |
| Government orphan-drug incentives for rare-disease RNAi assets | +2.9% | North America & EU, with emerging programs in Asia-Pacific | Long term (≥ 4 years) |
| Rising prevalence of cardiometabolic & genetic diseases addressable by gene-silencing | +2.1% | Global, with higher impact in developed markets | Long term (≥ 4 years) |
| Expansion of RNA-focused CDMO capacity enabling smaller biotechs | +1.8% | Global, concentrated in North America, Europe, and Asia-Pacific | Medium term (2-4 years) |
| AI-driven siRNA design platforms shortening discovery timelines | +1.5% | Global, concentrated in biotech clusters (Boston, San Francisco, Cambridge) | Medium term (2-4 years) |
| Source: Mordor Intelligence | |||
FDA/EMA Approvals of siRNA Drugs Accelerating Investor Confidence
Regulatory momentum has reached an inflection point, with the FDA’s approval of fitusiran for hemophilia A and B in April 2025 marking the latest milestone in a string of siRNA drug endorsements that began gaining pace in 2024. Active interventional trials now top 150, more than triple the 2021 figure, reflecting a strong late-stage pipeline that sustains the RNAi technology market. This validation has catalyzed venture funding; City Therapeutics captured USD 135 million in Series A financing led by former Alnylam executives, underscoring seasoned leadership’s conviction in next-gen RNA therapeutics. EMA’s synchronized review procedures create dual-continent launch potential, trimming commercialization latency and sharpening revenue forecasts for pipeline assets.
Government Orphan-Drug Incentives for Rare-Disease RNAi Assets
Seven-year exclusivity, up to 25% R&D tax credits, and waived FDA fees make rare disorders a capital-efficient proving ground. Silence Therapeutics secured multiple designations, slashing development costs and accelerating market access for hepatological and hematological programs. Parallel EMA incentives double addressable revenue under a single trial design, intensifying investor interest and diversifying the RNAi technology market pipeline toward ultra-rare indications with premium pricing.
Advances in Lipid-Nanoparticle Delivery Enhancing In-Vivo Stability
Second-generation ionizable LNPs combine biodegradable lipids and zwitterionic helpers to fortify serum stability, improve endosomal escape, and cut innate-immune activation. Manufacturing capacity is scaling fast; Wacker Chemie allocated EUR 100 million (USD 108 million) to modular LNP lines that can pivot across payloads, enabling the RNAi technology market to meet rising clinical-batch demand. Ligand conjugation and pH-responsive release broaden indications from liver to CNS and solid tumors, mitigating historical tissue-specific hurdles. These advances reinforce LNPs’ status as the dominant RNA carrier and spur sustained delivery-platform R&D.
AI-Driven siRNA Design Platforms Shortening Discovery Timelines
Machine-learning algorithms now predict potency and off-target effects from sequence and chemistry attributes, reducing wet-lab cycles by roughly 20 months. Integration with in-silico lipid-vehicle modeling yields preclinical candidates with delivery recipes in place, compressing time to IND. Biotech clusters in Boston, San Francisco, and Cambridge aggregate AI talent, feeding a steady stream of optimized assets into the RNAi technology market.
Restraints Impact Analysis of RNAi Technology Market*
| Restraint | (~) % Impact on CAGR Forecast | Geographic Relevance | Impact Timeline |
|---|---|---|---|
| Off-target toxicity & innate-immune activation concerns | -2.8% | Global, with heightened regulatory scrutiny in North America & EU | Medium term (2-4 years) |
| High cost of GMP-grade lipids/oligonucleotide manufacturing | -3.1% | Global, with acute impact in emerging markets | Short term (≤ 2 years) |
| Patent thickets around proprietary ionizable-lipid chemistries | -2.3% | North America & Europe primarily, affecting global market access | Long term (≥ 4 years) |
| Public opposition to gene-silencing in agriculture | -1.9% | Europe and select Asia-Pacific markets, limited impact on therapeutics | Medium term (2-4 years) |
| Source: Mordor Intelligence | |||
Off-Target Toxicity & Innate-Immune Activation Concerns
Toll-like receptor engagement can trigger cytokine release, imposing dose ceilings and lengthier toxicology studies that extend timelines by 12–18 months. Regulators now demand exhaustive genome-wide screens, adding analytical cost and slowing the RNAi technology market’s systemic-delivery programs.
High Cost of GMP-Grade Lipids/Oligonucleotide Manufacturing
GMP oligonucleotide synthesis costs run 10–15 times higher than small-molecule production, reflecting solvent-intensive steps and scarce high-purity reagents. Agilent invested USD 150 million to double nucleic-acid capacity, yet demand still exceeds output, creating procurement delays that restrict the RNAi technology market’s clinical-batch availability.
*Our forecasts treat driver/restraint impacts as directional, not additive. The impact forecasts reflect baseline growth, mix effects, and variable interactions.
RNAi Technology Market Segment Analysis
By Molecule Type:
siRNA Dominance Drives Market LeadershipsiRNA held 63.82% of the RNAi technology market share in 2025, supported by well-established regulatory precedents from patisiran, givosiran, and fitusiran. The segment’s 16.1% CAGR ensures it remains the prime revenue engine even as newer modalities gain traction. miRNA therapeutics explore bidirectional regulation in cardiovascular and oncology settings, although undefined pathways slow approvals. shRNA vectors enable long-term silencing for chronic diseases, while ribozymes and antisense hybrids occupy niche mechanistic gaps, collectively diversifying the RNAi technology market.
siRNA’s proven delivery compatibility with LNPs and GalNAc conjugates underpins its commercial momentum, attracting Big-Pharma alliances eager to layer platform efficiency across wider disease franchises. Investor capital, however, is incrementally shifting toward miRNA and gene-editing hybrids to hedge technological concentration risk, suggesting a gradual broadening of the RNAi technology market beyond siRNA over the next decade.


By Application:
Therapeutics Lead While Diagnostics EmergeTherapeutics generated the bulk of 2025 revenue, with oncology commanding 26.74% of the RNAi technology market size thanks to its ability to silence undruggable drivers such as KRAS G12D. Cardiometabolic programs aiming at PCSK9 and ANGPTL3 build chronic-dosing annuity streams, enhancing lifetime value per asset. Infectious-disease candidates benefit from rapid sequence redesign to tackle mutating pathogens.
Outside therapeutics, high-content screening libraries and companion diagnostics supply recurring platform revenue. The EPA’s approval of ledprona for Colorado potato beetle control signposted agricultural potential, hinting at a peripheral but strategic extension of the RNAi technology market.
By Delivery Technology:
LNPs Dominate as Polymers AccelerateLNPs contributed 57.61% of 2025 revenue and maintain primacy due to large-scale GMP success during vaccine rollouts. pH-responsive ionizable systems drive sub-mg/kg potency, trimming safety margins and easing regulatory passage. Polymer-and-conjugate carriers, powered by GalNAc ligands, are the fastest risers at 16.46% CAGR, especially for liver-targeted conditions. Viral vectors serve niche durable-silencing use cases, while exosome and metal-oxide nanocarriers sit in preclinical stages, promising later-cycle upside for the RNAi technology market.
By End User:
Pharma Dominance Meets CDMO ExpansionPharmaceutical and biotech firms held 67.32% of 2025 revenue, reflecting integrated R&D and commercialization capabilities. CDMOs registered the fastest expansion at 16.95% CAGR as sponsors outsource oligonucleotide and LNP manufacture to avoid capital-intensive plant builds. Academic institutes and diagnostic labs collectively nurture discovery and biomarker validation, whereas agricultural biotech forms a small but emerging slice as RNA formulations gain regulatory traction.
Geography Analysis
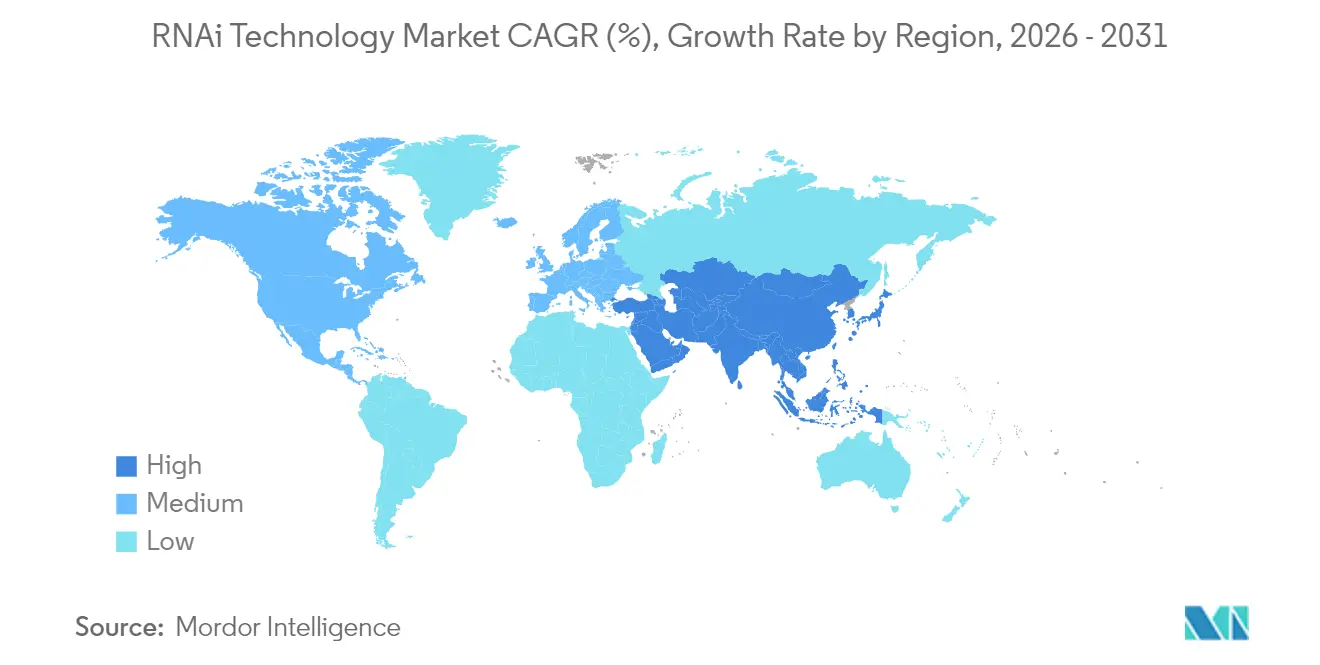
North America RNAi Technology Market
North America retained 41.02% of the RNAi technology market share in 2025 on the back of FDA clarity, venture-capital liquidity, and mature CDMO clusters that compress development timelines. Agilent’s USD 150 million nucleic-acid expansion and MilliporeSigma’s viral-vector facility secure regional supply, further anchoring dominance.
APAC RNAi Technology Market
Asia-Pacific is projected to grow at a 17.25% CAGR through 2031 as governments fund biotech parks and streamline approvals. South Korea’s ST Pharm invested USD 126 million to reach 14 mole/year oligo output, positioning the region as a global supply hub. China’s Sanegene Bio drew USD 130 million in funding, illustrating domestic momentum in the RNAi technology market.
EMEA and LATAM RNAi Technology Market
Europe sustains steady growth under EMA’s centralized review and robust pharma infrastructure. Wacker Chemie’s EUR 100 million RNA site strengthens continental manufacturing resilience despite Brexit-related dual-filing requirements. Latin America, Middle East, and Africa remain nascent opportunities pending infrastructure upgrades and pricing-model refinements.

Regulatory Landscape
Regulatory Landscape: Regulation of RNAi therapeutics largely follows the broader oligonucleotide-therapeutics framework, with the US FDA (CDER) evaluating products through the NDA pathway and placing heightened emphasis on class-specific safety risks such as off-target effects and innate-immune activation. In July 2024, the FDA issued final guidance on Clinical Pharmacology Considerations for the Development of Oligonucleotide Therapeutics, and on November 15, 2024, it released draft guidance on Nonclinical Safety Assessment of Oligonucleotide-Based Therapeutics, clarifying expectations for PK/PD characterization and nonclinical packages that influence program design and timelines.
In Europe, the EMA regulates RNA-derived medicines under centralized procedures, with classification depending on product characteristics and sometimes intersecting with biologics frameworks. In parallel, the International Council for Harmonisation (ICH) is advancing the S13 topic proposal for nonclinical safety evaluation of oligonucleotide-based therapeutics, which supports cross-region alignment of safety requirements and reduces duplication risk for global development plans as sponsors progress multi-region trials and dual filings.
Value Chain Analysis
The RNAi technology value chain starts with target identification and sequence design (increasingly supported by AI-enabled platforms), followed by oligonucleotide synthesis, purification, formulation into delivery systems (notably LNPs and conjugates), analytical characterization, and clinical and commercial fill-finish under cGMP. Solid-phase oligonucleotide synthesis remains the core production method, but scale-up depends heavily on specialized reagents and high-purity inputs, while downstream purification (such as HPLC and lyophilization) is a recurring bottleneck due to the need to resolve closely related impurities at commercial specifications, as of 2024.
Manufacturing and supply are increasingly concentrated among specialized CDMOs and a small set of advanced developers with strong process and analytical capabilities, making capacity access and quality systems central to execution. The dependence on high-purity synthetic lipids for LNP-based delivery creates additional supply-chain coupling between lipid suppliers, formulators, and drug-product manufacturers, reinforcing the strategic value of long-term sourcing agreements and platform-standardized processes that can move from clinical batches to commercial supply with fewer tech-transfer cycles.
Competitive Landscape
Alnylam’s layered patents and first-mover approvals keep it at the forefront, but large pharmaceutical entrants are closing gaps through high-value alliances. Novartis’ USD 4.165 billion cardiovascular RNAi pact with Shanghai Argo illustrates Big-Pharma’s strategic embrace of RNA platforms. Platform differentiation centers on delivery scalability and intellectual-property coverage; City Therapeutics’ USD 135 million funding underscores investor confidence in AI-optimized discovery engines that de-risk off-target profiles. CDMOs compete on turnaround and quality, driving consolidation as capacity becomes a strategic asset in the RNAi technology market.
RNAi Technology Industry Leaders
Alnylam Pharmaceuticals
Silence Therapeutics PLC
Arrowhead Pharmaceuticals, Inc.
Thermo Fisher Scientific Inc
Dicerna Pharmaceuticals (Novo Nordisk A/S)
- *Disclaimer: Major Players sorted in no particular order
RNAi Technology Market Companies Covered in this Report
- Alnylam Pharmaceuticals
- Ionis Pharmaceuticals
- Arrowhead Pharmaceuticals
- Novo Nordisk
- Silence Therapeutics
- Sanofi
- Arbutus Biopharma Corp.
- Sirnaomics Ltd.
- Benitec Biopharma Ltd.
- Phio Pharmaceuticals
- Olix Pharmaceuticals Co. Ltd.
- ST Pharm Co. Ltd.

Market Opportunities and Future Outlook
Recent licensing activity and platform access moves broaden RNAi applicability beyond the liver-targeted GalNAc paradigm, with several high-profile collaborations in early 2026. In February 2026, SanegeneBio announced a global RNAi licensing collaboration with Genentech, including a USD 200 million upfront payment and up to USD 1.5 billion in milestones, underscoring demand for scalable RNAi discovery and delivery know-how.
In May 2026, Suzhou Ribo Life Science signed an exclusive worldwide licensing agreement with Madrigal Pharmaceuticals covering six preclinical siRNA programs targeting MASH (with cumulative payments potentially reaching USD 4.4 billion) and followed with a May 2026 AI collaboration with Insilico Medicine, reinforcing opportunity for AI-assisted design services, CDMO capacity, and delivery-component supply tied to expanding RNAi pipelines. In addition, regulatory and trial-activation milestones in APAC, such as SGB-9768 development initiated in 2026, illustrate ongoing execution activity across regions.
Recent Industry Developments in RNAi Technology Market
- June 2026: Arrowhead Pharmaceuticals received marketing authorization from the European Commission for REDEMPLO (plozasiran), an siRNA medicine for adults with familial chylomicronemia syndrome (FCS). This approval adds a new marketed RNAi therapy in a major jurisdiction and expands the set of regulatory precedents for siRNA medicines. The approval supports broader confidence in RNAi clinical-to-commercial translation in rare disease settings.
- June 2026: Alnylam Pharmaceuticals entered a strategic collaboration with Inceptive Nucleics, Inc. valued at up to USD 2 billion, including an upfront payment, to apply generative AI models to the design and discovery of novel RNAi therapeutic candidates. The deal tightens the link between computational design and RNAi development, prioritizing faster lead optimization and earlier de-risking of potency and off-target profiles.
- November 2024: The US FDA released a draft guidance for industry titled Nonclinical Safety Assessment of Oligonucleotide-Based Therapeutics, outlining recommendations for nonclinical safety evaluation relevant to RNAi and other oligonucleotide modalities. The guidance elevates expectations around class-specific toxicology and risk characterization, directly influencing study design and analytical plans.


RNAi Technology Market Report Scope and Research Methodology
Market Definition and Coverage
For this study, the RNAi technology market is counted as revenues linked to RNA interference based solutions used in research and therapeutic development, including RNAi molecules and the delivery approaches needed to make them work in real settings.
Scope exclusions: We do not count unrelated RNA modalities that do not rely on RNA interference, and we also exclude general lab consumables that are not specific to RNAi workflows.
Segments Covered in This Report
- By Molecule Type (Value)
- siRNA
- miRNA
- shRNA
- Other RNA molecules
- By Application (Value)
- Therapeutics
- Oncology
- Cardiometabolic Disorders
- Infectious Diseases
- Neurological Disorders
- Rare Genetic Disorders
- Drug Discovery & Screening
- Diagnostics
- Agriculture
- Other Applications
- Therapeutics
- By Delivery Technology (Value)
- Lipid Nanoparticles
- Ionizable LNPs
- Liposomes
- Polymer & Conjugate Systems
- GalNAc Conjugates
- PEGylated Carriers
- Viral Vectors
- Adeno-associated Virus
- Lentiviral Vectors
- Physical Delivery Methods
- Emerging Nanomaterials (Exosomes, Metal-oxide, etc.)
- Lipid Nanoparticles
- By End User (Value)
- Pharmaceutical & Biotechnology Companies
- Contract Development & Manufacturing Organizations (CDMOs)
- Academic & Research Institutes
- Diagnostic Laboratories
- Agricultural Biotechnology Firms
- By Geography (Value)
- North America
- United States
- Canada
- Mexico
- Europe
- Germany
- United Kingdom
- France
- Italy
- Spain
- Rest of Europe
- Asia-Pacific
- China
- India
- Japan
- South Korea
- Australia
- Rest of Asia-Pacific
- South America
- Brazil
- Argentina
- Rest of South America
- Middle East and Africa
- GCC
- South Africa
- Rest of Middle East and Africa
- North America
Data Sources, Market Sizing, and Validation
Desk Research
Desk research was used to set the foundation for the model, mainly by mapping the RNAi pipeline, the active therapeutic areas, and the basic rules around approvals and clinical progress. We referred to public sources such as the US FDA, the European Medicines Agency, ClinicalTrials.gov, and peer reviewed journals to track program volumes, trial phases, and typical timelines.
To keep the assumptions anchored, we also used annual reports and investor presentations, plus reputable science news coverage and selected association or academic lab publications, to understand where spending is happening and how delivery platforms are evolving. In areas where public financial detail was limited, we cross checked company level signals using paid subscriptions for company financials and intelligence, along with patent databases, to verify technology activity. The desk sources listed here are illustrative only, and many other public references were also used for collection, validation, and clarification.
Primary Interviews and Surveys
Primary work was used to pressure test what we saw in public data, especially around which RNAi programs are truly advancing, which delivery options are being adopted, and how pricing typically shifts between research use and therapeutic development. We spoke with biopharma teams, CRO or CDMO managers, and researchers across APAC, EMEA, and the Americas, so gaps in the desk model could be filled with grounded inputs.
Distribution of primary research fieldwork respondents
| Company type | Respondent position | Region |
|---|---|---|
| Top tier: 39% | CXOs: 14% | APAC: 45% |
| Mid tier: 41% | Functional/Unit leaders: 33% | EMEA: 33% |
| Smaller Players: 20% | Managers: 53% | Americas: 22% |
Market-Sizing & Forecasting
Sizing started with a top down build that ties the demand pool to observable signals, where clinical pipeline counts by phase, therapy area mix, and expected progression rates are translated into expected RNAi related spending by year. Because RNAi is sensitive to delivery success, we also tracked indicators like the mix of delivery approaches (for example, lipid based and conjugate approaches), regional trial intensity, and the share of programs moving into later stage development, and these were used to shape the growth curve.
The totals were then checked using selective bottom up approximations, such as sampled revenue ranges for relevant solution suppliers, ASP x volume logic for common research and development use cases, and channel checks on what is typically outsourced to service providers. When a bottom up view had gaps, we kept the partial roll up and scaled it using interview guided coverage factors, so the model stayed transparent and repeatable.
For the forecast, we relied on scenario analysis supported by a light multivariate regression layer, where adoption of RNAi in priority indications, trial starts, and approval cadence were the main drivers. Expert feedback was used to choose realistic ranges instead of one aggressive path.
Data Validation & Update Cycle
Several checks were run before sign off, including year over year variance testing, region share sanity checks, and comparisons against independent signals like clinical stage mix and approval activity. If the model output moved too far from these signals, we revisited the inputs, and then contacted sources again to confirm whether the change was real or an assumption error.
Each study is refreshed annually, and interim adjustments are made when major events occur, such as an approval, a clinical setback that changes pipeline expectations, or a policy change that affects development. Right before delivery, a final analyst pass is done so the numbers reflect the latest publicly visible and interview validated information.
Mordor Intelligence's Global Rnai Technology Market Market Size Compared With Other Published Estimates
Published estimates for RNAi technology often differ because the boundaries are not always the same, and the year chosen for the headline number can shift the result by a lot in a fast growing market. We also see differences coming from how firms treat delivery platforms, what they count as technology revenue versus therapeutics revenue, and how quickly they update base assumptions.
Clinical trial phase progression checks and delivery platform adoption signals are the evidence points that keep Mordor Intelligence's 2026 estimate tied to the RNAi demand pool that is actively moving through development, instead of including adjacent RNA categories by default. Some published figures appear to roll in broader RNA therapeutic revenue, or they anchor on earlier base years and then apply a steady CAGR without re testing phase wise attrition and timing. Currency timing and regional weighting can also widen the spread when the same global market is reconstructed from different local inputs.
Benchmark comparison
| Source | Market Size | Gaps in Research Methodology |
|---|---|---|
| Mordor Intelligence | USD 1.83 B (2026) | |
| Global Consultancy A | USD 3.28 B (2025) | Uses a broader definition that appears to include a wider set of RNA related products and services, and the headline year is earlier, which can inflate comparability when RNAi specific revenues are not separated cleanly from adjacent modalities. |
| Industry Publisher B | USD 3.43 B (2025) | Anchors the base in 2025 and may apply a smoother growth path across applications, which can underweight phase progression timing and the practical adoption constraints that come from delivery platform readiness. |
Looking across the three figures, most of the gap comes from scope boundaries and the choice of base year, followed by how pipeline conversion and delivery adoption are treated in the growth math. Our approach stays traceable because the inputs are tied to observable development activity, and the adjustment steps are documented so the same logic can be replayed when new approvals or trial shifts occur.


Key Questions Answered in the Report
How large is the RNAi technology market in 2026?
The RNAi technology market size stands at USD 1.83 billion in 2026.
What CAGR is forecast for RNAi therapeutics through 2031?
Overall revenue is projected to climb at a 16.01% CAGR over 2026-2031.
Which delivery technology leads current adoption?
Lipid nanoparticles hold 57.61% revenue share and remain the dominant delivery vehicle.
Which region is growing fastest?
Asia-Pacific is advancing at a 17.25% CAGR due to expanding clinical infrastructure and cost-efficient manufacturing.
Why are CDMOs gaining importance?
CDMOs post a 16.95% growth rate as pharma companies outsource GMP-grade oligonucleotide production to avoid high capex.
What recent FDA approval boosted market confidence?
In April 2025, the FDA approved fitusiran for hemophilia A and B, marking a milestone for siRNA therapies.
Page last updated on:


 Your data is secure and never sold or shared.


