
Rice Snacks Market Size and Share
Market Overview
| Study Period | 2021 - 2031 |
|---|---|
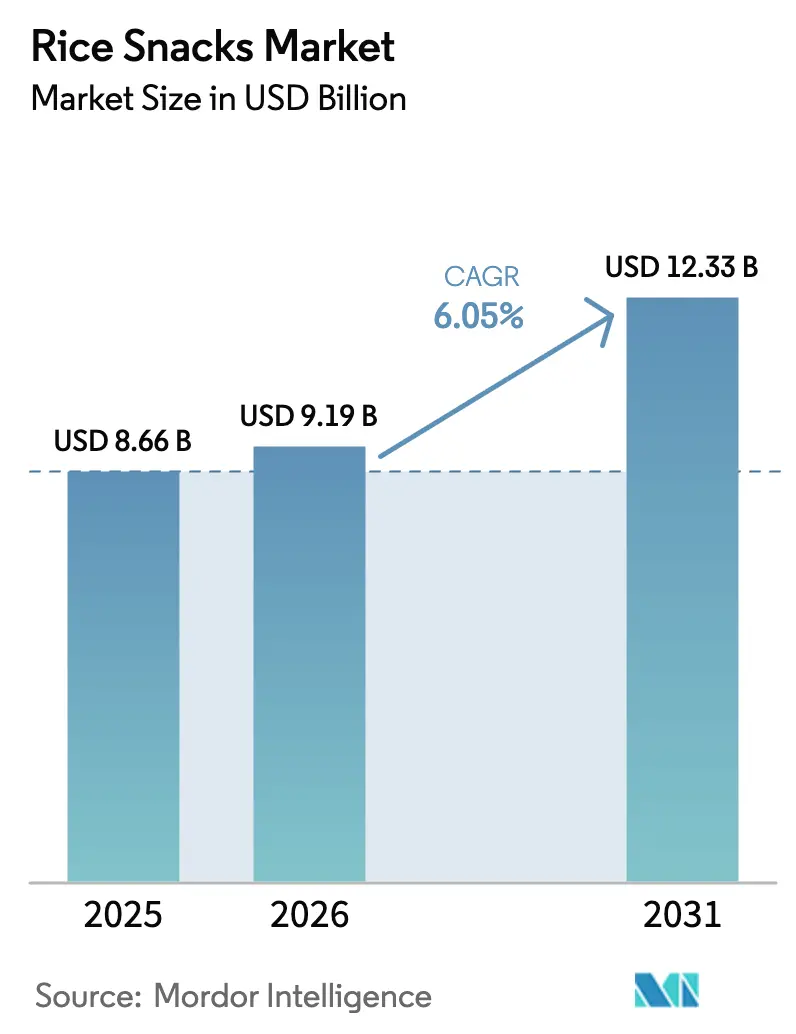
| Market Size (2026) | USD 9.19 Billion |
| Market Size (2031) | USD 12.33 Billion |
| Growth Rate (2026 - 2031) | 6.05 % |
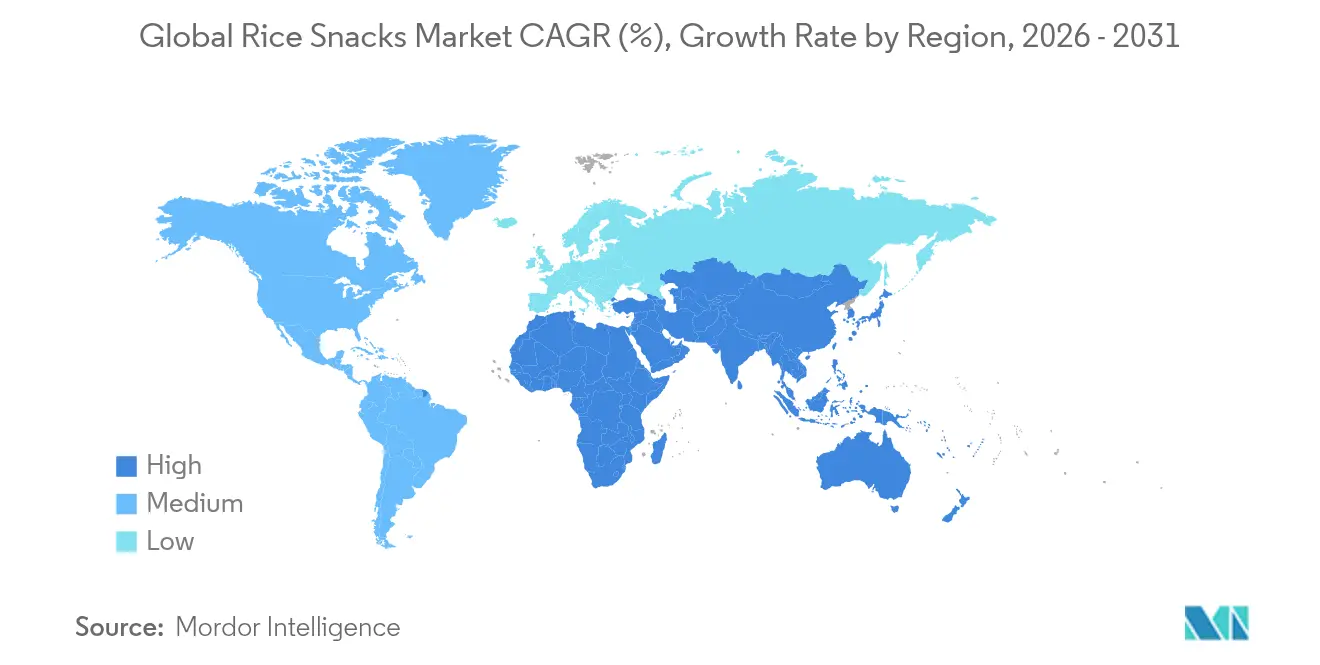
| Fastest Growing Market | North America |
| Largest Market | Asia-Pacific |
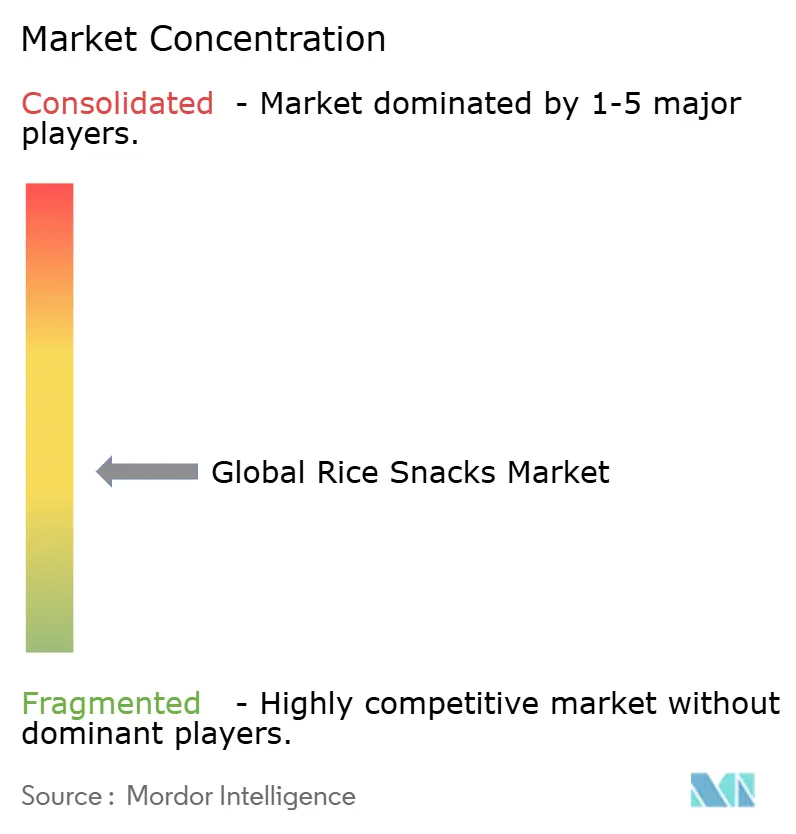
| Market Concentration | Medium |
Major Players *Disclaimer: Major Players sorted in no particular order Image © Mordor Intelligence. Reuse requires attribution under CC BY 4.0. | |
Rice Snacks Market Analysis by Mordor Intelligence
The rice snacks market size is projected to expand from USD 8.66 billion in 2025 and USD 9.19 billion in 2026 to USD 12.33 billion by 2031, registering a CAGR of 6.05% between 2026 and 2031. As health consciousness rises and front-of-pack labeling rules tighten, consumers are increasingly prioritizing portion control and ingredient transparency. Mainstream SKUs are seeing a boost in perceived nutritional value as clean-label reformulations swap out refined rice flour for whole-grain or rice-bran ingredients. Meanwhile, premiumization tactics, like the introduction of umami-rich seasonings, are expanding price ranges without stifling demand. In the Asia-Pacific region, deep-rooted rice-cracker traditions maintain the area's dominance. However, North America is swiftly catching up, with supermarkets allocating more shelf space to "better-for-you" salty snacks. On the supply front, fluctuations in rice prices, driven by climate factors, are pushing publicly listed manufacturers to adopt vertically integrated sourcing strategies and hedging programs, especially as they navigate quarterly margin evaluations. Additionally, manufacturers are investing in research and development to develop innovative product offerings that align with evolving consumer preferences.
Key Report Takeaways
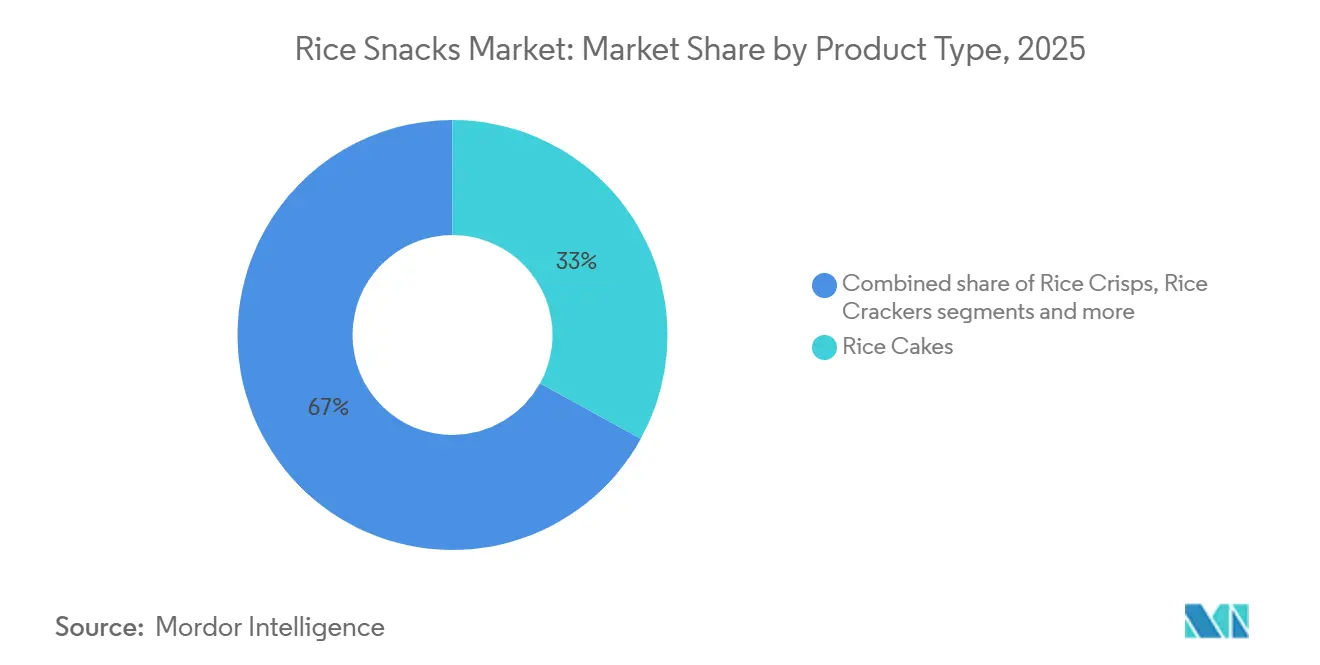
- By product type, rice cakes secured 33.02% of 2025 global revenue, while rice crackers are forecast to expand at an 8.23% CAGR through 2031.
- By flavor, salty variants controlled 47.58% of the 2025 share; spicy profiles are advancing at a 6.52% CAGR to 2031.
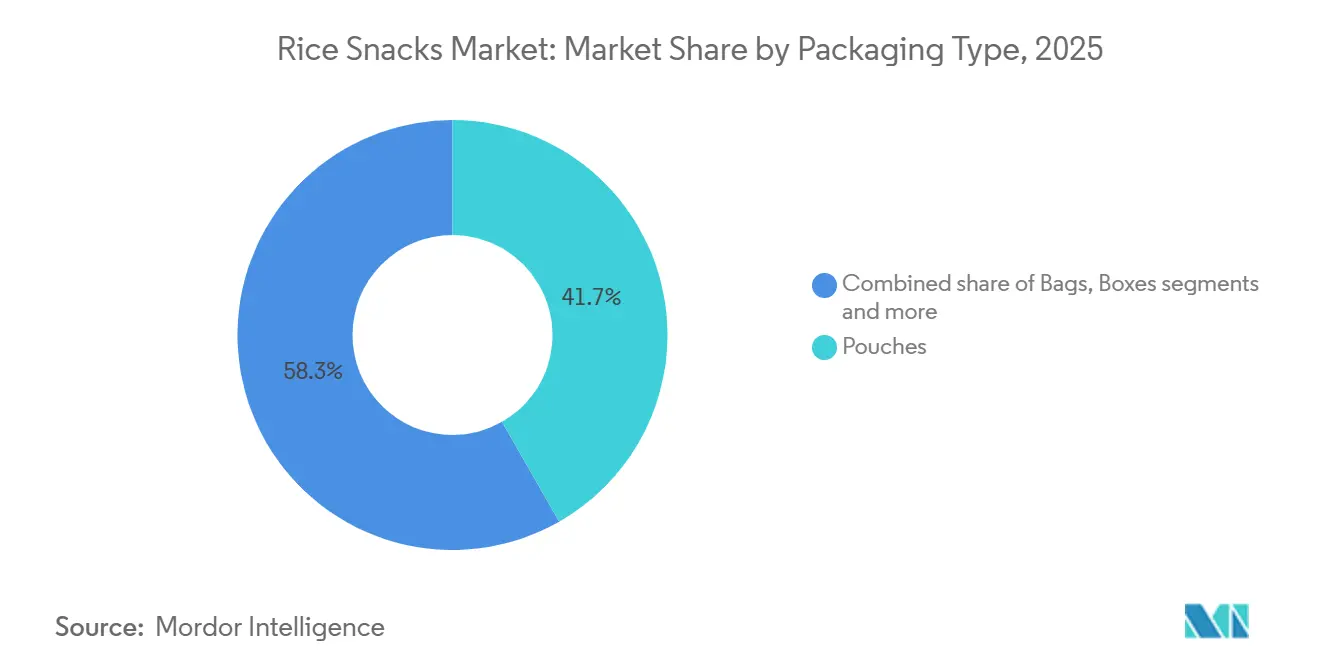
- By packaging, pouches commanded 41.58% of 2025 sales and are rising at a 7.05% CAGR through 2031.
- By distribution, supermarkets and hypermarkets represented 52.48% of 2025 turnover, whereas online retail is accelerating at a 9.11% CAGR through 2031.
- By geography, Asia-Pacific contributed 46.22% of 2025 revenue, but North America is projected to log a 7.43% CAGR through 2031.
Note: Market size and forecast figures in this report are generated using Mordor Intelligence’s proprietary estimation framework, updated with the latest available data and insights as of 2026.
Market Trends and Insights
Drivers Impact Analysis of Rice Snacks Market*
| Driver | ( ~ ) % Impact on CAGR Forecast | Geographic Relevance | Impact Timeline |
|---|---|---|---|
| Health awareness and demand for healthier snacks | +1.2% | Global, peak in North America and Western Europe | Medium term (2-4 years) |
| Convenience and on-the-go snacking | +0.9% | Global, urban Asia-Pacific and North America | Short term (≤ 2 years) |
| Innovation in flavours and formats | +1.0% | Global, earliest in Asia-Pacific and North America | Medium term (2-4 years) |
| Eco-friendly packaging mandates and circular-economy pilots | +0.6% | Europe and North America, spillover to Asia-Pacific | Long term (≥ 4 years) |
| Increasing investment in marketing and promotional activities | +0.7% | Global, digitally mature markets | Short term (≤ 2 years) |
| Rice-bran valorisation opens premium functional niches | +0.5% | North America and Europe, emerging urban Asia-Pacific | Long term (≥ 4 years) |
| Source: Mordor Intelligence | |||
Health awareness and demand for healthier snacks
In 2024, the FDA updated its definition of "healthy," permitting whole-grain rice snacks with minimal added sugar to make health claims. This shift has prompted major brands to urgently reformulate their products. As consumers increasingly turn to GLP-1 drugs, there's a noticeable shift towards lower-calorie, nutrient-rich products that not only prevent nausea but also ensure a feeling of fullness. Retailers are becoming stricter about third-party certifications, elevating the importance of clean-label status from a unique selling point to a standard requirement. Brands that delay obtaining these certifications face the risk of being removed from premium channels, which are crucial for maintaining category profit margins. As a result, growth in the premium tier is now influencing mainstream offerings, broadening the market for healthier rice snacks. This trend underscores the growing consumer preference for transparency and health-focused innovations in the food industry.
Convenience and on-the-go snacking
In 2024, the International Food Information Council (IFIC) reported that 73% of U.S respondents snacked at least once daily[1]. As hybrid work patterns disrupt traditional eating schedules, there's a growing preference for single-serve snacks. These snacks, ideal for desk consumption, minimize mess and don't require refrigeration. Rice-based items have emerged as a solution, as their low water activity not only extends shelf life but also ensures a satisfying crunch and quiet bite. The rise of convenience-store formats in countries like Indonesia, India, and Brazil has bolstered grab-and-go sales. Additionally, novel resealable pouches are enhancing freshness across multiple snacking moments, curbing household waste, and elevating perceived value. Consequently, urban centers in developing regions are witnessing a shift in impulse-driven sales from traditional potato chips to portable rice snacks. This trend highlights the growing demand for convenient, portable, and sustainable snacking options.
Innovation in flavours and formats
In 2024, Kameda Seika reported a notable 12% rise in export revenue, a trend driven by manufacturers blending traditional soy and seaweed with modern seasonings like truffle and smoked paprika. By optimizing extrusion parameters, hybrid bases such as rice-quinoa crackers effectively bridge perceived protein gaps while maintaining a light puffiness. Mini rice-cake clusters, now tailored for yogurt or salad, are transforming rice snacks from mere indulgences to integral meal components. These successful SKUs, adhering to a 150-calorie portion norm, resonate with the "guilt-free" trend popular among millennials. The sensory novelty of specialty seasonings justifies their premium pricing, allowing manufacturers to achieve higher price points. Additionally, the increasing focus on health-conscious eating habits is further boosting the demand for innovative rice snack products.
Eco-friendly packaging mandates and circular-economy pilots
By 2030, all packaging in the EU must be recyclable or reusable, prompting a shift from multi-layer laminates to mono-material polyethylene films[2]. In 2024, PepsiCo invested USD 75 million to retrofit Quaker rice-cake lines, positioning itself for cost advantages as regulations tighten. Yet, while mono-films are a step forward, they permit more oxygen ingress, potentially shortening shelf life. This challenge necessitates the adoption of natural oxygen scavengers, inflating research and development costs. In select Chinese provinces, deposit-return pilots saw a 30% consumer participation rate, especially when paired with loyalty incentives, highlighting their feasibility even in fragmented retail environments. Brands that highlight verifiable life-cycle-assessment reductions are gaining traction, appealing to eco-conscious shoppers willing to pay a premium in the rice snacks market. Companies that fail to adapt to these regulatory and consumer shifts risk losing market share to more agile competitors.
Restraints Impact Analysis of Rice Snacks Market*
| Restraint | ( ~ ) % Impact on CAGR Forecast | Geographic Relevance | Impact Timeline |
|---|---|---|---|
| High competition from alternative protein and granola snacks | -0.8% | Global, especially North America and Europe | Short term (≤ 2 years) |
| Volatile rice prices linked to climate-related supply shocks | -0.5% | Global, sharper in import-dependent regions | Medium term (2-4 years) |
| Stricter HFSS front-of-pack labels in OECD markets | -0.4% | OECD countries, led by UK and EU | Medium term (2-4 years) |
| Limited shelf-life for clean-label products without additives | -0.3% | Global, most acute in humid tropics | Long term (≥ 4 years) |
| Source: Mordor Intelligence | |||
High competition from alternative protein and granola snacks
Protein bars, consistently offering 15–20 g of protein, have outshone unfortified rice snacks, securing prime shelf visibility. Meanwhile, keto-friendly granola clusters are capturing market share from carb-conscious consumers, casting rice in a high-glycemic light. In a bid to regain functional significance, rice-cracker brands are toying with almond-butter toppings and chia inclusions. However, they grapple with capital expenditure challenges in co-manufacturing. The shelves in North America and Europe are fiercely competitive, leading to tighter promotional schedules and heightened trade-spend inflation. Lacking distinct functional differentiation, products in the rice snacks market risk commoditization, especially among the younger fitness demographic. As consumer preferences continue to evolve, innovation remains critical for brands to maintain relevance in this competitive landscape.
Volatile rice prices linked to climate-related supply shocks
Despite a record global supply, the USDA highlighted that regional droughts and floods in 2025 led to 25% swings in spot prices[3]. In the EU and MENA, processors reliant on imports faced unexpected cost surges, particularly where contracts didn't include escalation clauses, thereby squeezing their gross margins. While diversifying sourcing origins and forming long-term alliances with farmers can buffer against such shocks, they also tie up working capital, making it challenging for smaller firms. Anticipating more frequent El Niño episodes, many multinationals are gravitating towards partial backward integration. This uneven ability to hedge risks is driving consolidation, shifting power dynamics in favor of established players in the rice snacks market.
*Our forecasts treat driver/restraint impacts as directional, not additive. The impact forecasts reflect baseline growth, mix effects, and variable interactions.
Rice Snacks Market Segment Analysis
By Product Type:
Rice Crackers Lead Innovation VelocityIn 2025, rice cakes commanded a dominant 33.02% share of the rice snacks market revenue, particularly thriving in North America's health-centric aisles. Their strong shelf presence is bolstered by whole-grain certifications. These cakes, a go-to for calorie-conscious consumers, have introduced multigrain and bran-enriched variants. These not only double the protein content but also maintain servings at around 90 calories, countering the allure of indulgent alternatives. Yet, their perceived uniformity poses a challenge, limiting their trade-up potential and leaving them susceptible to competitors with bolder flavors. Despite facing incremental shelf space erosion from a surge of cracker SKUs in Asian specialty outlets, rice cakes firmly anchor wellness and diet channels. Meanwhile, emerging extruded puff formats in the "others" category hint at a potential breakfast disruption, especially if fortified options can deliver a superior mouthfeel.
Forecasted to grow at an 8.23% CAGR through 2031, rice crackers are set to outpace rice cakes. Their thin, crunchy texture lends itself well to intense seasonings, enabling swift adaptation to culinary trends. This adaptability allows them to command a 30% price premium over plain variants. With this flavor depth, rice crackers are poised to eclipse rice cakes in premium grocery channels by 2029, as taste innovation takes precedence over calorie control. On the other hand, rice crisps, which combine puff lightness with crunch, face challenges due to their vague positioning, hindering sales momentum. The competitive landscape has shifted focus from commodity costs to textural research and development, underscoring the importance of innovation for market leadership.

By Flavor:
Spicy Variants Capture Millennial PalatesIn 2025, salty variants captured 47.58% of the rice snacks market, solidifying their status as pantry staples in many households. Their broad appeal is rooted in familiarity, yet they grapple with stagnant sales growth, especially under scrutiny from health-conscious consumers advocating for sodium reduction. Sweet variants, while secondary, play a pivotal role in appealing to children and seniors, ensuring a balanced portfolio that shields against demographic shifts. Regional flavors, such as seaweed and kimchi, carve out strong geographic niches, infusing cultural authenticity and enhancing export potential. This diverse foundation positions salty variants as the steadfast anchor amidst changing taste trends. Manufacturers are increasingly exploring sodium-reduction technologies to address health concerns while maintaining flavor integrity.
Spicy rice snacks are on a rapid ascent, forecasting a 6.52% CAGR through 2031. The benefits of capsaicin, particularly its satiety effects, resonate with today's weight-management focus, allowing brands to market them as health-centric rather than just spicy. Convenience stores in U.S. college towns are leading the charge in adoption, and innovative flavor encapsulation techniques are extending shelf life by 3–4 weeks by moderating capsaicin reactions. Brands are adeptly adjusting spice levels to cater to diverse palates, all while navigating stricter sodium regulations. Nutritional claims spotlighting metabolic advantages further validate their premium pricing. As a result, flavor research and development has transitioned into a pivotal, data-driven strength, fueling the spicy segment's growth.
By Packaging Type:
Pouches Dominate Sustainability NarrativesIn the rice snacks market, pouches maintain market leadership with a 41.74% share in 2025. This market position is attributed to increasing consumer demand for packaging solutions that offer convenience, portability, and resealable functionality while maintaining product integrity. The structural advantages of pouches, including their minimal weight, storage efficiency, and product preservation capabilities, position them as the optimal choice for contemporary consumption patterns. Technological advancements in flexible packaging manufacturing have facilitated the integration of environmentally sustainable materials, addressing ecological considerations. Furthermore, the design characteristics of pouches facilitate effective brand communication and product presentation in retail environments.
Bags retain a substantial market presence due to their economic efficiency and established distribution infrastructure. The reduced production costs associated with bag packaging enable manufacturers to implement competitive pricing strategies, particularly appealing to price-conscious market segments. The configuration of bags facilitates optimal retail space utilization, rendering them suitable for large-scale retail operations. Boxes occupy the premium market segment, specifically catering to specialized rice snack products and multiple-serving configurations. Their structural integrity accommodates substantial product volumes and assortment variations, positioning them effectively for gift presentations and premium retail distribution channels. The format of boxes enhances product presentation parameters, fulfilling consumer requirements for bulk purchasing options and specialized product selections.
By Distribution Channel:
Online Retail Disrupts Traditional Slotting EconomicsIn 2025, supermarkets and hypermarkets, leveraging their scale and bulk-volume leadership, dominated the rice snacks distribution landscape, seizing 52.48% of the total market share. They fortified their position with click-and-collect options, effectively countering basket fragmentation. Meanwhile, convenience outlets within this network capitalized on immediate access and premium single-serve displays, bolstering brand visibility. The "others" category, encompassing vending, foodservice, and corporate pantries, serves as a captive outlet but emphasizes the need for precise portioning and pricing to enhance uptake. Even as growth slows, these traditional channels ensure consistent household penetration, standing firm against the encroachment of digital alternatives. Their well-established infrastructure continues to bolster core volume, even in the face of margin erosion from e-commerce.
Online retail stores are emerging as the fastest-growing segment, boasting a 9.11% CAGR. Their growth is driven by a wider assortment of products, the convenience of home delivery, and direct-to-consumer models that avoid slotting fees, allowing for nimble flavor testing. These DTC strategies not only facilitate agile flavor testing but also amass first-party data, leveraging it for algorithmic promotions and tailored offers, which in turn elevate conversion rates by 12–15%. To counterbalance high last-mile delivery costs, bundled subscriptions at five-pack levels have been introduced, ensuring profitability even for single-bag orders. In response, brick-and-mortar establishments are rolling out omnichannel loyalty programs and retail media networks, trading digital visibility for a more efficient advertising spend. This evolution is reshaping the rice snacks market, placing emphasis on data expertise and the speed of fulfillment.
Geography Analysis
APAC Rice Snacks Market
In 2025, the Asia-Pacific region commanded a dominant 46.22% share of the revenue pie, buoyed by Japan's deep-rooted senbei tradition, the burgeoning middle class in China's suburbs, and the expansion of organized retail in India. To counter a plateauing domestic snack expenditure, Japanese giants Kameda Seika and Calbee are turning their gaze outward, tapping into the urban millennial market across Southeast Asia. Meanwhile, China's Want Want is capitalizing on its distribution strength, introducing premium seaweed and mala flavors to tier-2 cities, and enjoying a surge with double-digit unit growth. In India, despite a fragmented market, heightened health consciousness and the rise of e-commerce are paving the way for premium rice-cake segments, commanding prices 20% above traditional namkeen. Countries like Indonesia, Thailand, and Vietnam are becoming hotspots for global players, keen on establishing local production to combat humidity-related shelf-life challenges.
North America Rice Snacks Market
North America, while smaller in size, is on track to achieve the fastest growth rate globally, with a projected CAGR of 7.43%. This surge is largely attributed to the FDA's clear nutrition labeling, which not only simplifies product reformulation but also bolsters retailer trust. The U.S. stands at the forefront of this growth, with supermarkets strategically placing rice crackers alongside gluten-free items, tapping into the celiac and keto consumer base. In Canada, a diverse culinary landscape is fueling the popularity of kimchi and sriracha products. Simultaneously, Mexico's economic progress is ushering rice-cake snacks into mainstream grocery outlets. In a strategic move, PepsiCo is channeling its 2026 investment in Kazakhstan to ensure a steady, cost-effective supply stream to U.S. coastal ports, safeguarding against potential trade tensions in East Asia. As a result, North America's trend towards premiumization is expanding the appeal of rice snacks, reaching audiences beyond traditional health-focused consumers.
Europe Rice Snacks Market
Europe experiences a more tempered growth, shaped by regulations like HFSS and evolving packaging laws. Leading the charge in volume are Germany, France, and the UK, capitalizing on their dense retail networks to prioritize compliant and recyclable products. Southern European nations, rooted in a snacking culture centered around nuts and olives, are slower to embrace these changes. However, health-conscious consumers are increasingly gravitating towards rice crackers, especially those touting gluten-free benefits. In Eastern Europe, countries like Poland are emerging as potential hotspots, driven by a surge in modern retail and growing disposable incomes. While import restrictions in Turkey and Russia pose challenges, the burgeoning e-commerce landscape offers a glimmer of hope for bridging these access hurdles. On a broader scale, Europe's stringent standards are not just reshaping its own market but are also setting global benchmarks, influencing rice snack formulations worldwide.
Regulatory Landscape
Rice snacks are governed by broad packaged-food frameworks that cover ingredient safety, allergen declarations, and nutrition and marketing claims. In the United States, the FDAs 2024 update to the definition of "healthy" increased the compliance relevance of whole-grain formulations and added-sugar thresholds for rice cakes, rice crackers, and popped rice snacks that use on-pack claims. In Europe, food safety and labeling oversight through EFSA-linked standards and tightening front-of-pack and HFSS-style policies in OECD markets continue to pressure sodium and seasoning systems, reinforcing reformulation, portion guidance, and substantiation of clean-label positioning.
Across origins and trade, rice snack supply chains are shaped by Codex Alimentarius (FAO/WHO) guidance and by engagement from commodity and snack-category trade bodies that work alongside regulators and trade policy. Organizations such as USA Rice, SNAC International, Indias AIREA, and the Thai Rice Exporters Association support members on market access, food safety practices, and labeling alignment. This is especially relevant for export-oriented Asia-Pacific manufacturers and for import-dependent processors in the EU and MENA that face scrutiny on traceability and compliance documentation.
Competitive Landscape
The rice snacks market showcases a moderate fragmentation with a balanced mix of global giants and nimble regional players. Companies like PepsiCo, General Mills, and Nestlé leverage their scale in procurement, research and development, and distribution. This breadth allows them to navigate commodity price fluctuations. Meanwhile, regional leaders such as Kameda Seika, Want Want, and Calbee dominate their home markets. They do this through localized flavors, robust distribution networks, and branding that resonates culturally. There's a clear strategic split: while multinationals, like PepsiCo, enhance their demand forecasting accuracy by 18% in 2024 using AI, local firms capitalize on unique textures and festival-themed editions to boost seasonal sales.
Digital changes are challenging traditional gatekeeping. Direct-to-consumer brands, like Lundberg Family Farms, are harnessing rice-bran health claims and compelling narratives to attract early adopters. However, many of these brands grapple with unit economics, prompting them to forge partnerships with co-packers or license their intellectual property to more established entities. The trend of mergers and acquisitions is on the rise, with global firms often taking minority stakes to foster innovation. A case in point is General Mills’ 2025 investment in a California rice-bran startup, signaling a potential full buyout in the future.
Sustainability is becoming a key differentiator. Companies aligning their packaging with EU's circular economy targets are gaining faster shelf space and consumer trust than those lagging behind. As market capabilities evolve, the reallocation of market share will depend on expertise in data-driven personalization, cohesive supply chains, and innovative cycles that adhere to regulations. Additionally, brands that integrate sustainable practices across their value chains are likely to see long-term cost efficiencies. This shift is expected to influence consumer loyalty and drive competitive advantages in the forecast period.
Rice Snacks Industry Leaders
-
PepsiCo Inc.
-
General Mills Inc.
-
Element Snacks Inc.
-
Nestlé S.A. (Osem)
-
Hunter Foods LLC
- *Disclaimer: Major Players sorted in no particular order
Rice Snacks Market Companies Covered in this Report
- PepsiCo Inc.
- General Mills Inc.
- Element Snacks Inc.
- Nestle S.A. (Osem)
- Lundberg Family Farms
- Kameda Seika Co. Ltd
- Hunter Foods LLC
- DeZhou Harvest Foods Co. Ltd
- Bourbon Corporation
- SanoRice Holding BV
- Want Want Holdings Ltd
- Calbee Inc.
- Lotte Corporation
- Lotus Foods, Inc.
- Blue Diamond Growers
- Tastemorr Snacks
- Umeya Co., Ltd
- Ricegrowers Ltd (SunRice)
- Riso Gallo
- Sanritsu Seika Co. Ltd
Market Opportunities and Future Outlook
Product whitespace is widening where manufacturers can combine permissible health-claim positioning with tangible functional upgrades, particularly around protein and whole-grain cues that still preserve the texture and portability of rice snacks. PepsiCo used 2026 launches under Quaker and PopCorners to introduce protein-forward, rice-based formats into mainstream retail, indicating room for further fortified rice crisps and crackers that target satiety-driven snacking and portion norms while remaining compatible with gluten-free and cleaner-label messaging. The seasoning and inclusion angle also creates practical sourcing opportunities for suppliers that can support bold flavors with sodium-reduction tools, which helps brands stay aligned in markets with tighter HFSS-style labeling pressure.
On the operating model side, supply-chain redesign and regional manufacturing footprints offer a concrete lever for category participation as rice price volatility and packaging shifts raise cost-to-serve. General Mills ongoing supply-chain network overhaul and PepsiCos North American integration push reflect an emphasis on simplification, productivity, and service levels, which can broaden distribution for fast-rotating rice snack SKUs across supermarkets and e-commerce. At the same time, PepsiCos Mexico capacity investment program, including the Celaya Sabritas plant, supports nearshoring and faster replenishment into North America, which can expand whitespace for co-manufacturing partnerships, private label, and quicker innovation cycles in pouches and other flexible formats that fit circular-economy packaging programs.
Recent Industry Developments in Rice Snacks Market
- May 2026: PepsiCo began rollout of PopCorners Protein, a popped, never-fried rice-based snack containing 9g of protein per 1 ounce serving made from a blend of pea protein isolate, rice protein isolate, and rice flour. The rollout expands PepsiCo's protein-focused snacking lineup and extends its reach into protein enriched rice snacks across mainstream channels.
- April 2026: PepsiCo under the Quaker brand launched Quaker Protein Rice Crisps, a popped rice snack containing 6g of pea protein and 9g of whole grains per serving. The launch broadens the protein and whole grain rice snack segment in key retail outlets and strengthens PepsiCo's ability to compete in clean label and protein enriched snacks.
- September 2024: PepsiCo China launched a Clean Label Rice Cracker, a 0-additive product following market testing and recipe simplification. The product introduction supports demand for simple ingredient profiles and expands PepsiCos footprint in the rice cracker segment within China.
Rice Snacks Market Report Scope and Research Methodology
Market Definition and Coverage
For this study, the market covers the value of packaged rice-based snack products sold for human consumption, across retail and foodservice channels, and counted at the point of sale into each geography.
Scope exclusions: We exclude plain cooked rice, rice as a raw ingredient, and complete meal kits where rice is not the primary snack format.
Segments Covered in This Report
- By Product Type
- Rice Cakes
- Rice Crisps
- Rice Crackers
- Others
- By Flavor
- Salty
- Sweet
- Spicy
- Others
- By Packaging Type
- Pouches
- Bags
- Boxes
- Others
- By Distribution Channel
- Supermarkets/Hypermarkets
- Convenience Stores
- Online Retail Stores
- Other Distribution Channels
- By Geography
- North America
- United States
- Canada
- Mexico
- Rest of North America
- Europe
- Germany
- United Kingdom
- Italy
- France
- Spain
- Netherlands
- Poland
- Belgium
- Sweden
- Rest of Europe
- Asia-Pacific
- China
- India
- Japan
- Australia
- Indonesia
- South Korea
- Thailand
- Singapore
- Rest of Asia-Pacific
- South America
- Brazil
- Argentina
- Colombia
- Chile
- Peru
- Rest of South America
- Middle East and Africa
- South Africa
- Saudi Arabia
- United Arab Emirates
- Nigeria
- Egypt
- Morocco
- Turkey
- Rest of Middle East and Africa
- North America
Data Sources, Market Sizing, and Validation
Desk Research
Desk research was used to map the category boundaries and the demand context before we sized anything. We reviewed public nutrition and ingredient labeling rules, staple and processed food supply signals, and trade flows that indicate where rice-based snack formats are more common.
Common inputs came from reputable, non-paywalled sources such as FAOSTAT for rice production and availability, UN Comtrade for relevant trade movement patterns, USDA and other national agriculture and food statistics portals for category context, and Codex Alimentarius and selected food safety agencies for labeling and product definitions. We also referenced company annual reports, investor presentations, and credible trade press to understand brand priorities, route-to-market shifts, and pricing narratives. For extra cross-checks, we used paid subscriptions for company financials and intelligence, news and financials, patent databases, and where helpful, shipment-level import and export data. These examples are illustrative only, and we also reviewed many other public documents and datasets for data collection, validation, and research clarification.
Primary Interviews and Surveys
Primary work focused on the gaps that desk research does not answer cleanly, especially what counts as a rice snack in different markets and how pricing moves by channel. We spoke with participants across manufacturing, distribution, and retail, then ran follow-up checks to validate regional demand patterns and the mix and price assumptions used in the model.
Distribution of primary research fieldwork respondents
| Company type | Respondent position | Region |
|---|---|---|
| Top tier: 27% | CXOs: 14% | APAC: 49% |
| Mid tier: 58% | Functional/Unit leaders: 31% | EMEA: 30% |
| Smaller Players: 15% | Managers: 55% | Americas: 21% |
Market-Sizing & Forecasting
We built the estimate using a top-down demand pool approach, where packaged snack consumption patterns and category presence by geography are reconstructed, then filtered to what is realistically attributable to rice-based snack formats. After that structure was set, we ran selective bottom-up checks to keep the totals practical, such as sampled price per pack by channel, a mix-led average selling price build, and distributor and retailer feedback on volume direction.
Key model inputs included rice availability signals (production and trade), urban snacking and convenience food adoption patterns, and flavor and format preferences that change pack size and price. We also incorporated distribution channel mix shifts, including modern retail and e-commerce, and inflation-driven pricing behavior for packaged foods. Where country splits were thin, we bridged assumptions using peer-market analogs and interview-led sanity checks, before rolling totals to the global view.
For forecasting, we applied scenario analysis to reflect different paths for pricing and consumption, then anchored the mid-case to what respondents described as the most likely channel and product-mix trajectory. To keep projections stable, the model was cross-checked against expected changes in rice input costs and packaged snack price indices that influence shelf prices.
Data Validation & Update Cycle
Results were validated through triangulation across independent indicators, then checked for abnormal jumps at the country, region, and global roll-up levels. When outliers appeared, we traced the drivers back to mix, pricing, or channel assumptions, then re-tested using additional desk checks and short re-contacts.
Before sign-off, a second analyst review is completed so that logic, math, and scope rules are applied consistently. The report is refreshed annually, and interim updates are triggered when material events affect the category, such as major pricing shocks or meaningful channel disruptions. Right before delivery, a final pass is done so clients receive the most up-to-date view available.
Mordor Intelligence's Global Rice Snacks Market Size Versus Other Published Estimates
Published rice snacks market sizes can look far apart because the category boundary is not universal, and because the price and channel mix assumptions vary by publisher. In practice, the biggest splits usually come from whether adjacent snack types are counted, how the base year is set, and whether values are modeled at retail prices or closer to manufacturer revenue.
By checking channel-level price ladders and refreshing inclusion rules for rice crackers and puffed rice snacks, Mordor Intelligence keeps the total tied to packaged rice snack sell-through instead of letting broader snack baskets inflate the value.
Benchmark comparison
| Source | Market Size | Gaps in Research Methodology |
|---|---|---|
| Mordor Intelligence | USD 9.19 B (2026) | |
| Industry Publisher A | USD 12.25 B (2024) | Uses an earlier base year and a wider inclusion set, which likely pulls in more packaged snack products beyond rice-led formats and applies a different price level assumption across channels. |
| Press Release B | USD 197.90 B (2022) | Appears to apply a much broader snack or staple-food revenue scope, and the implied totals do not align with category-level consumption and pricing checks typically used for packaged rice snack sizing. |
The spread in the table is mainly explained by scope and pricing boundaries, not by small changes in growth rates. Our approach stays repeatable because each step is traceable to clear demand signals, channel mix logic, and a controlled definition of what counts as a rice snack in each market.
Key Questions Answered in the Report
How large is the rice snacks market in 2026?
The rice snacks market size is USD 9.19 billion in 2026, with a 6.05% CAGR outlook to 2031.
Which product type leads sales?
Rice cakes generated the highest 2025 revenue share at 33.02%, benefiting from diet-friendly positioning.
What region is growing fastest?
North America posts the highest regional CAGR at 7.43% due to gluten-free adoption and e-commerce reach.
Why are flexible pouches so popular?
Pouches deliver reseal ability, lower material usage, and recyclable options that meet retailer sustainability mandates.