
RF And Microwave Transistors Market Size and Share
Market Overview
| Study Period | 2020 - 2031 |
|---|---|
| Market Size (2026) | USD 9.61 Billion |
| Market Size (2031) | USD 14.66 Billion |
| Growth Rate (2026 - 2031) | 8.82 % |
| Fastest Growing Market | Middle East |
| Largest Market | Asia-Pacific |
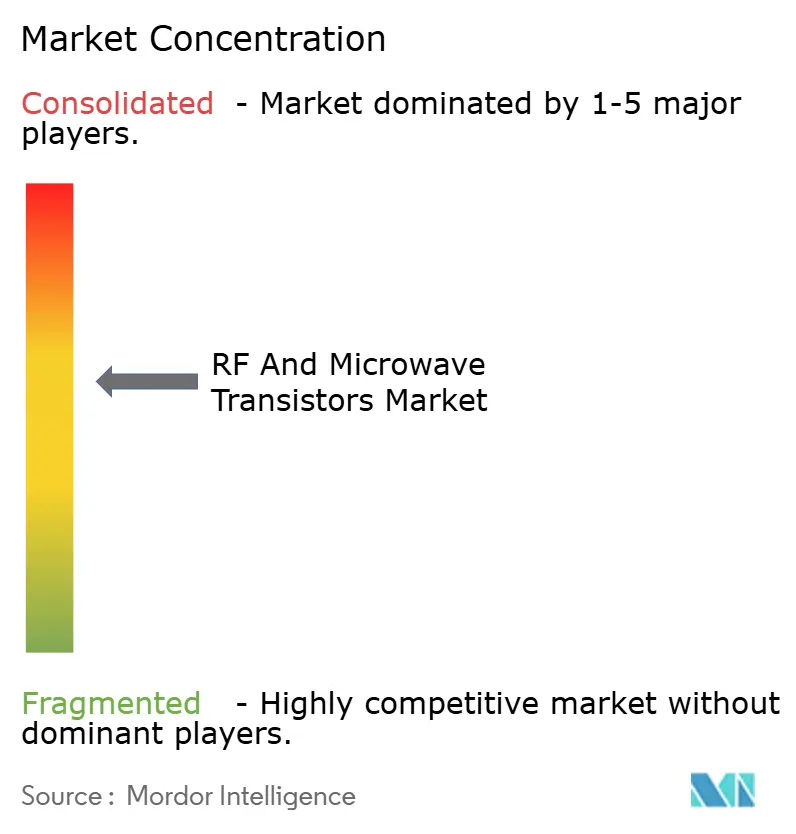
| Market Concentration | Medium |
Major Players *Disclaimer: Major Players sorted in no particular order Image © Mordor Intelligence. Reuse requires attribution under CC BY 4.0. | |
RF And Microwave Transistors Market Analysis by Mordor Intelligence
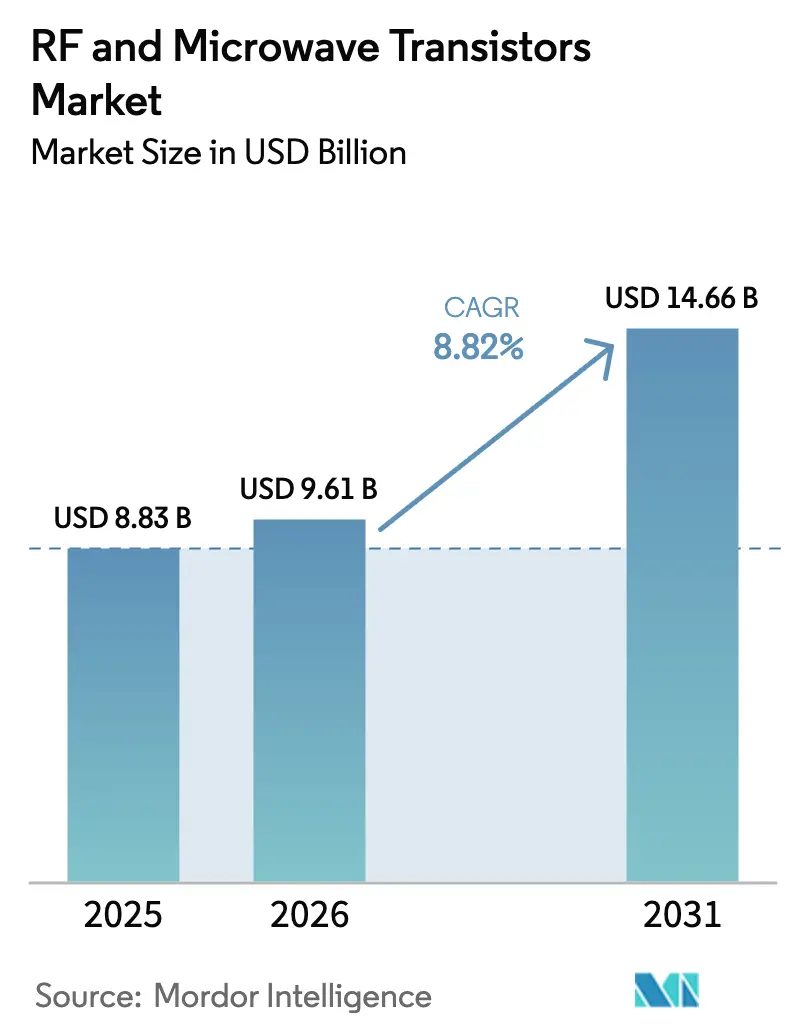
The RF and microwave transistors market size is expected to grow from USD 8.83 billion in 2025 to USD 9.61 billion in 2026 and is forecast to reach USD 14.66 billion by 2031 at 8.82% CAGR over 2026-2031. This growth path anchors the current RF and microwave transistors market size and underlines a steady cadence built on three forces: sustained 5G macro and small-cell rollouts, rising adoption of gallium nitride (GaN) power devices in next-generation military radars, and the ramp-up of low-Earth-orbit (LEO) satellite constellations. Telecommunications operators lean on silicon laterally diffused MOS (LDMOS) for sub-6 GHz coverage, while millimeter-wave gear increasingly specifies GaN to solve thermal and efficiency pain points. Simultaneously, defense programs accelerate demand for high-power GaN modules as active electronically scanned array (AESA) systems replace traveling-wave tubes. Regional momentum is led by Asia Pacific, where China and India maintain aggressive deployment targets, and by the Middle East, which channels sovereign digitization budgets toward standalone 5G cores and smart-city platforms.
Key Report Takeaways
- By frequency band, L-Band captured 35.96% of RF and microwave transistors market share in 2025, whereas X-Band and above devices are forecast to expand at a 9.79% CAGR through 2031.
- By material type, silicon LDMOS held 54.57% of the RF and microwave transistors market size in 2025, while GaN devices are slated to grow at a 10.31% CAGR to 2031.
- By power output, the 10-50 W class accounted for 31.74% of 2025 shipments; devices above 150 W lead projected growth at 10.55% CAGR.
- By end-user vertical, communication infrastructure delivered 40.93% of revenue in 2025, yet aerospace and defense is advancing at 11.02% CAGR through 2031.
- By geography, Asia Pacific retained 43.92% share in 2025, whereas the Middle East is on track for an 11.53% CAGR to 2031.
- By application, 4G and 5G macro base stations provided 37.98% of 2025 revenue, while radar systems are rising at an 10.78% CAGR through 2031.
Note: Market size and forecast figures in this report are generated using Mordor Intelligence’s proprietary estimation framework, updated with the latest available data and insights as of 2026.
Market Trends and Insights
Drivers Impact Analysis of RF And Microwave Transistors Market*
| Driver | (~) % Impact on CAGR Forecast | Geographic Relevance | Impact Timeline |
|---|---|---|---|
| Surge in 5G Infrastructure Deployment | +2.80% | Global, with APAC core accounting for 60% of new base stations | Short term (≤ 2 years) |
| Rising Adoption of GaN Technology for High-Power Applications | +2.10% | North America and Europe defense, APAC telecom infrastructure | Medium term (2-4 years) |
| Growth of Satellite Broadband Constellations | +1.50% | Global, led by North America operators and Middle East ground-segment deployments | Medium term (2-4 years) |
| Proliferation of Connected Consumer Electronics | +0.90% | APAC manufacturing hubs, North America and Europe end markets | Short term (≤ 2 years) |
| Emergence of LEO-Based IoT Networks | +0.70% | Global, with early commercial traction in agriculture and logistics verticals | Long term (≥ 4 years) |
| Defense Modernization Programs Prioritizing AESA Radars | +1.60% | North America, Europe, Middle East, and Asia Pacific defense budgets | Long term (≥ 4 years) |
| Source: Mordor Intelligence | |||
Surge in 5G Infrastructure Deployment
About 1.2 million new 5G base stations went live in 2024, two-thirds of which were installed in China following a nationwide coverage mandate for 2025. Operators continue to pair L-Band and S-Band LDMOS transistors inside legacy macro sites with GaN-based modules inside millimeter-wave small cells, meeting both coverage and capacity needs. Open radio-access-network blueprints, demonstrated by AT&T across 70% of its United States footprint, shorten design cycles for multiband radios and broaden the vendor pool. In India, Reliance Jio and Bharti Airtel added 300,000 5G sites during 2024, focusing on sub-6 GHz spectrum to balance spectral efficiency and rural penetration. Release 18 of 3GPP introduces advanced antenna configurations and wider carrier aggregation, which force power amplifiers to operate over broader instantaneous bandwidths. GaN’s superior linearity at high output power helps engineers comply with ETSI EN 301 908 adjacent-channel leakage standards.
Rising Adoption of GaN Technology for High-Power Applications
The 2024 CHIPS and Science Act award of USD 6.5 billion to Wolfspeed finances 200 mm GaN-on-SiC wafer capacity that targets infrastructure and defense customers needing devices beyond 100 W.[1] GaN transistors deliver power-added efficiency above 70% at X-Band, lowering cooling overhead and shrinking phased-array enclosures. Qorvo’s infrastructure revenue climbed 12% year over year in fiscal 2Q 2025, reflecting demand for GaN power amplifiers in massive MIMO radios. U.S. Department of Defense Trusted Foundry guidelines oblige radar suppliers to source GaN domestically, cementing a competitive edge for vertically integrated firms. The silicon-carbide substrates that underpin GaN boast thermal conductivity near 490 W m-1 K-1, supporting junction temperatures above 200 °C for airborne radar platforms.
Growth of Satellite Broadband Constellations
Starlink surpassed 6,000 active satellites in 2024 and initiated direct-to-cell service with T-Mobile, using Ka-Band phased arrays powered by GaN and gallium arsenide (GaAs) devices. Amazon’s Project Kuiper began flight demonstrations and plans 3,200 spacecraft by 2029, reinforcing demand for radiation-hardened RF front ends. AST SpaceMobile’s BlueBird satellites showcased direct smartphone links from orbit, relying on S-Band high-power amplifiers that employ GaN for efficient 20 W uplinks. The International Telecommunication Union freed 17.7–18.6 GHz spectrum for fixed-satellite service at WRC-23, which raises throughput ceilings for ground terminals. Radiation tolerance and mean-time-between-failure standards continue to steer satellite programs toward GaN-on-SiC solutions that outlast GaAs in harsh orbits.[2]
Defense Modernization Programs Prioritizing AESA Radars
Lockheed Martin’s AN/APG-85 radar for the F-35 Block 4 entered low-rate production in 2024, integrating more than 1,600 GaN transmit-receive modules that double detection range versus the legacy platform. Raytheon’s USD 1.2 billion Patriot upgrade swaps traveling-wave tubes for solid-state GaN units delivering 200 W each, cutting maintenance costs 40%. The United States Navy’s AN/SPY-6 S-Band radar employs modular GaN blocks to track ballistic and hypersonic threats concurrently. Israel’s ELM-2084 radar, integral to Iron Dome, leverages GaN to execute 360-degree surveillance with low latency. Export licenses covering GaN amplifiers above 100 W add procurement complexity, spurring allied nations to localize production capacity.
Restraints Impact Analysis of RF And Microwave Transistors Market*
| Restraint | (~) % Impact on CAGR Forecast | Geographic Relevance | Impact Timeline |
|---|---|---|---|
| Supply Chain Disruptions for GaN Wafers | -1.30% | Global, with acute shortages in North America and Europe defense supply chains | Short term (≤ 2 years) |
| Thermal Management Challenges at mmWave Frequencies | -0.80% | Global, particularly affecting small-cell and automotive radar deployments | Medium term (2-4 years) |
| Export Control Tightening on Advanced RF Devices | -0.60% | North America, Europe, and Asia Pacific cross-border trade | Medium term (2-4 years) |
| Growing Viability of Photonic Integrated Circuits as Substitutes | -0.40% | North America and Europe data-center and telecom backbone applications | Long term (≥ 4 years) |
| Source: Mordor Intelligence | |||
Supply Chain Disruptions for GaN Wafers
Three suppliers Wolfspeed, II-VI Coherent, and Sumitomo Electric dominate GaN-on-SiC wafer output, and lead times for 150 mm substrates stretched past 26 weeks in late 2024. Wolfspeed’s Mohawk Valley 200 mm line faced commissioning delays, compressing allocations for defense customers on fixed-price contracts. Although the CHIPS and Science Act set aside USD 39 billion for semiconductor incentives, only a minority funds compound semiconductors, leaving GaN capacity tied to private capital. Qorvo locked long-term wafer supply pacts after citing substrate scarcity as a drag on infrastructure revenue. China’s 2024 export curbs on gallium and germanium inflated epitaxial wafer cost by 8-12%, squeezing fabless gross margins. MACOM’s USD 180 million purchase of a 6-inch GaN line helps shield it from these spot shortages.
Thermal Management Challenges at mmWave Frequencies
Power densities above 10 W mm-2 plague transistors operating beyond 24 GHz, compelling designers to adopt copper-tungsten heat spreaders and liquid or phase-change cooling that swell bill of materials 15-20%. Urban small cells fight volume constraints that limit heat-sink mass, while automotive radar modules must survive −40 °C to 125 °C, mandating packages with matched thermal expansion. NXP flagged thermal bottlenecks in next-generation 77 GHz radar chipsets, prompting joint development of embedded cooling channels. IEC 60068-2-14 requires 1,000 temperature cycles for automotive-grade parts, a stress that GaN-on-silicon variants often fail because of substrate mismatch. Laboratory microfluidic coolers demonstrate 500 W cm-2 removal capacity but remain too costly for high-volume commercial radios.
*Our forecasts treat driver/restraint impacts as directional, not additive. The impact forecasts reflect baseline growth, mix effects, and variable interactions.
RF And Microwave Transistors Market Segment Analysis
By Frequency Band:
L-Band Underpins Legacy ConnectivityL-Band transistors covering 1-2 GHz commanded 35.96% of 2025 revenue as operators keep LTE macro layers alive for voice fallback and rural reach, cementing their primacy in the RF and microwave transistors market share. The segment benefits from entrenched deployment footprints and mature LDMOS supply chains that still offer the lowest cost per watt. Momentum is nevertheless tilting toward higher bands as C-Band and X-Band shipments rise in concert with mid-band 5G and defense radar retrofits. Federal Communications Commission spectrum clearing delivered 280 MHz of contiguous C-Band bandwidth to United States carriers in 2024, pushing demand for power amplifiers with 40 W output across 3.7-3.98 GHz.
X-Band, Ku-Band, and Ka-Band devices are projected to clock a 9.79% CAGR through 2031, outpacing the broader RF and microwave transistors market. Defense programs such as Lockheed Martin’s AN/TPY-4 radar rely on GaN’s efficiency for long-range tracking. Satellite operators replacing C-Band earth stations with Ka-Band terminals favour GaN for compact, low-weight builds, improving installation economics. The International Telecommunication Union allocation of 71-76 GHz for fixed wireless access positions E-Band as a future growth vector, although packaging hurdles persist.


By Material Type:
GaN Cuts into LDMOS StrongholdSilicon LDMOS retained 54.57% share in 2025, bolstered by its cost edge in sub-6 GHz macro radios and decades-deep production learning curves, leaving the RF and microwave transistors market size for LDMOS comfortably ahead of rivals. Yet GaN shipments will grow 10.31% annually as millimeter-wave small cells, AESA radars, and Ka-Band ground terminals demand better power density and thermal headroom. Wolfspeed’s CHIPS Act-backed 200 mm expansion trims die cost roughly 30%, narrowing the price gap with LDMOS.
Gallium arsenide remains the low-noise amplifier king under 20 GHz, while indium phosphide and diamond substrates address niche terahertz imaging and quantum computing plays, together accounting for under 2% of revenue. Silicon carbide’s thermal conductivity of 490 W m-1 K-1 underpins GaN’s high-temperature advantage, a critical trait for airborne radars and naval arrays. The U.S. Trusted Foundry mandate obliges classified radar programs to buy domestic GaN devices, creating structural barriers for non-United States suppliers.
By Power Output:
High-Power Brackets Lead GrowthTransistors delivering 10-50 W made up 31.74% of 2025 shipments, serving dense macro sites and rooftop small cells essential to 5G coverage. Yet devices above 150 W will see the quickest lift, growing at 10.55% through 2031 as surveillance radars, electronic-warfare jammers, and satcom gateways seek peak power above 500 W. Raytheon’s Patriot radar modernization replaces vacuum tubes with 200 W GaN modules, underscoring the high-power pull.
The mid-power 50-150 W tier serves indoor distributed antenna systems, while sub-10 W parts populate IoT gateways and Wi-Fi routers where integration and bill-of-materials savings rule. Ka-Band ground terminals need 50-100 W amplifiers to close the link budget for maritime broadband, pushing designers toward GaN for battery efficiency in mobility segments. Small cells working in 26-39 GHz demand 5-20 W amplifiers with 400 MHz instantaneous bandwidth, another weak spot for LDMOS.
By End-User Vertical:
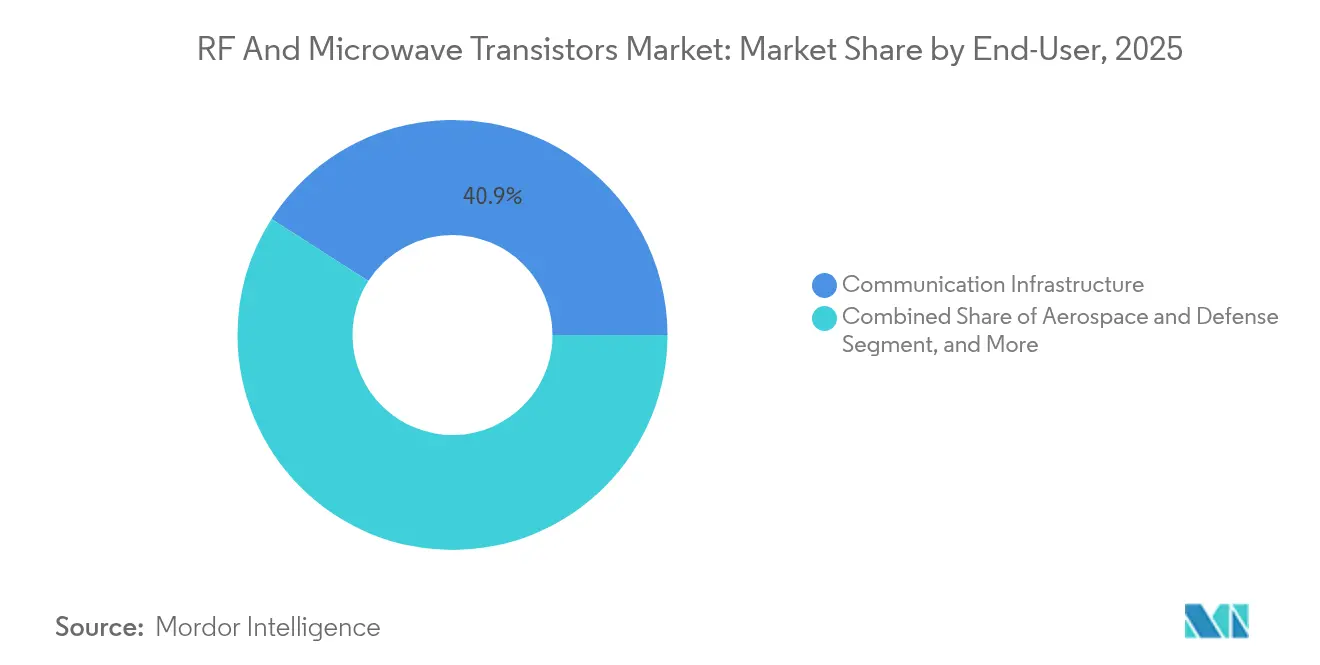
Defense Rising Faster Than TelecomCommunication infrastructure provided 40.93% of 2025 revenue, upheld by continuous 5G densification and LTE life support, locking in the largest slice of the RF and microwave transistors market. Aerospace and defense, however, are pacing faster at 11.02% CAGR as global radar upgrades and electronic-warfare programs unlock budgets. The United States fiscal-2025 missile defense allotment of USD 33.5 billion underlines the spending baseline.
Consumer electronics softened 8% in 2024 on smartphone saturation and slower Wi-Fi 7 adoption. Automotive radar, propelled by Euro NCAP’s 2025 safety mandates, spurs 77 GHz transistor demand while industrial IoT opts for low-power RF modules below 1 W. Operators in China and India continue to bulk out 5G base stations, but defense shifts in procurement share are set to rebalance the mix by 2030.
By Application:
Radar Systems Overtake Base-Station GrowthMacro base stations owned 37.98% of 2025 revenue, yet radar systems will climb at 10.78% CAGR as militaries swap vacuum tubes for GaN modules across air, land, and sea platforms. Lockheed Martin’s AN/TPY-4 and the United States Navy’s AN/SPY-6 show how GaN translates to longer detection ranges and lower life-cycle costs.
Small cells and distributed antenna systems address indoor coverage gaps, while satellite communications span both LEO and GEO domains that require radiation-hardened parts. IoT devices, powered by NB-IoT and LoRaWAN, stay cost-sensitive and below 1 W, limiting GaN uptake. Automotive radar modules now ship in the millions, integrating GaAs low-noise and SiGe power stages for 300-meter pedestrian detection.
Geography Analysis
APAC RF and Microwave Transistors Market
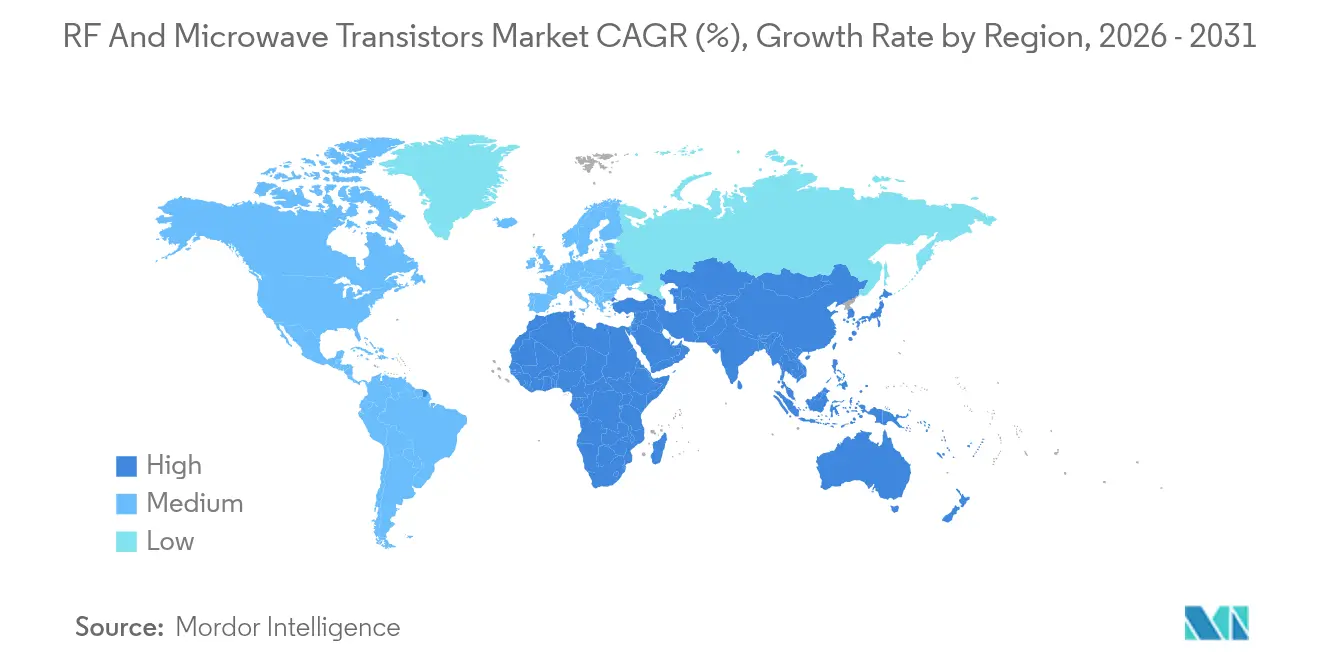
Asia Pacific generated 43.92% of 2025 revenue, propelled by China’s 4.15 million 5G base stations and India’s 300,000 new sites, solidifying its leadership in the RF and microwave transistors market. China’s Ministry of Industry and Information Technology compels full 5G coverage by 2025, sustaining demand despite handset headwinds. India’s Department of Telecommunications issued spectrum in the 3.3-3.6 GHz band, enabling Reliance Jio and Bharti Airtel to launch standalone architectures that require sub-6 GHz and millimeter-wave components. Japan’s NTT Docomo and South Korea’s SK Telecom experiment with millimeter-wave small cells in Tokyo and Seoul, working GaN devices hard to satisfy urban thermal constraints.
The Americas and EMEA RF and Microwave Transistors Market
The Middle East, forecast to grow 11.53% through 2031, rides Saudi Arabia’s Vision 2030 and the United Arab Emirates’ early standalone 5G core upgrades. Saudi Arabia’s Public Investment Fund earmarked USD 20 billion for digital infrastructure, including high-power RF amplifiers for macro and fixed-wireless sites. The United Arab Emirates auctioned 26 GHz spectrum in 2024 to seed millimeter-wave applications for smart-city pilots. Turkey’s operators commissioned 15,000 5G sites by 2024 year-end, focusing on sub-6 GHz bands. North America held 27.84% share in 2025, buoyed by AT&T’s Open RAN push and a robust defense supply chain that secures domestic GaN sourcing. Europe accounted for 17.62%, led by Germany’s automotive radar rollouts and United Kingdom spectrum auctions. Brazil’s 2024 3.5 GHz auction stipulates 5G deployment across all capitals by 2026, invigorating LDMOS demand in South America. Africa’s low penetration keeps revenue modest, though South Africa’s recent spectrum awards enable rural LTE coverage that leans on low-band transistors. Argentina lags as macroeconomic strains curtail operator capital expenditure.
Regulatory Landscape
In the United States, FCC actions linked to equipment authorization are tightening national-security related compliance expectations for radio equipment supply chains. The FCC released a Small Entity Compliance Guide in January 2026 covering equipment authorization rules intended to mitigate national security risks, followed by publication of the Second EA Integrity Order in the Federal Register in May 2026, with an effective date of June 15, 2026. These steps increase scrutiny around documentation, component provenance, and authorization pathways for RF hardware that incorporates RF and microwave transistors.
In Europe, the Radio Equipment Directive (Directive 2014/53/EU) remains the primary conformity framework for radio equipment placed on the EU market, and its consolidated text was updated with a version date of May 30, 2026. This reinforces ongoing requirements around compliance assessment and technical documentation. In China, GB 4824-2025 was issued for radio frequency disturbance characteristics for industrial, scientific, and medical equipment, with implementation on March 1, 2026. The update raises the importance of EMC-aligned design and test coverage across wide frequency ranges for RF component suppliers supporting system integrators.
Value Chain Analysis
The value chain spans substrate and raw material supply, notably SiC substrates for GaN-on-SiC, followed by epitaxy and wafer processing, device fabrication (discrete transistors and MMICs), advanced packaging and reliability screening, and distribution into system OEMs serving communications infrastructure, aerospace and defense, automotive radar, and satellite communications. Concentration in GaN-on-SiC substrate supply remains a key structural dependency, while downstream bottlenecks are increasingly tied to qualified high-frequency packaging steps (die attach, wire bonding, hermetic sealing) and specialized RF test and burn-in capacity that governs shipment ramps for high-reliability and mmWave parts.
On the manufacturing side, the chain is diversifying through additional technology platforms and suppliers alongside incumbent integrated players. In June 2026, GlobalFoundries stated production readiness of its 130 nm RFGaN1 technology qualified for volume production targeting aerospace, defense, and satellite communication markets, expanding foundry options for GaN RF devices. In July 2026, Infineon introduced a radiation-hardened GaN HEMT driver (RIC70115) for space-grade use cases, underscoring the demand for tightly controlled reliability flows. System-level delivery continues to depend on co-development between device suppliers, module makers, and OEMs for fast-refresh commercial SKUs (5G-Advanced radios and LEO terminals), while defense and aerospace programs continue to use build-to-print models with long qualification cycles and traceability requirements.
Competitive Landscape
The RF and microwave transistors market shows moderate concentration: Qorvo, Wolfspeed, MACOM, Skyworks, and NXP control around 60% combined share, yet none dominates every frequency or material niche. Vertical integration is the strategic differentiator. MACOM’s 2024 acquisition of a 6-inch GaN line shortens substrate led times to 16 weeks and enhances margin capture from epitaxy to packaged modules.[4] Wolfspeed’s CHIPS Act subsidy anchors domestic GaN wafer capacity that defense primes consider indispensable. Qorvo’s exit from the mobile handset RF front-end diverts engineering toward infrastructure and defense amplifiers, illustrating portfolio focus.
Ampleon and MACOM both embrace end-to-end models from crystal growth through module assembly, catering to radar primes that value secure supply. In contrast, fabless challengers such as Tagore Technology release application-specific GaN modules with built-in digital predistortion and envelope tracking aimed at satellite IoT and small cells. Export control updates from the United States Bureau of Industry and Security limiting GaN amplifiers above 27 GHz fragment global value chains and prod Chinese foundries to accelerate indigenous GaN processes.
White-space opportunities reside in LEO ground terminals demanding compact, thermally efficient RF front ends and in automotive radar modules scaling under Euro NCAP 5-star safety mandates. Photonic integrated circuits threaten long-haul data-center links by offering higher bandwidth density at lower power. 3GPP Release 18’s wider instantaneous bandwidth requirements elevate GaN’s competitive positioning over LDMOS for next-generation radios.
RF And Microwave Transistors Industry Leaders
-
Qorvo Inc.
-
Infineon Technologies AG
-
Wolfspeed Inc.
-
NXP Semiconductors N.V.
-
Skyworks Solutions Inc.
- *Disclaimer: Major Players sorted in no particular order
RF And Microwave Transistors Market Companies Covered in this Report
- Toshiba Electronic Devices and Storage Corporation
- STMicroelectronics N.V.
- ON Semiconductor Corporation
- NXP Semiconductors N.V.
- Infineon Technologies AG
- Microchip Technology Inc.
- Nexperia B.V.
- Wolfspeed Inc.
- Qorvo Inc.
- Skyworks Solutions Inc.
- MACOM Technology Solutions Holdings Inc.
- Broadcom Inc.
- Tagore Technology Inc.
- Ampleon Netherlands B.V.
- Mitsubishi Electric Corporation
- Analog Devices Inc.
- Renesas Electronics Corporation
Market Opportunities and Future Outlook
The clearest opportunity is the widening operating bandwidth and higher-frequency progression of radio front ends, which increases demand for higher-efficiency RF power devices and supporting drivers across telecom, satellite, and defense. In March 2026, Fujitsu reported GaN HEMT technology achieving 74.3% power conversion efficiency at 8 GHz, aligned with FR3-oriented research for 6G candidate bands. IEEE Electron Device Letters publications in 2026 also reported mmWave GaN-on-Si HEMT performance around 30 GHz, and G-band (about 170 GHz) results from N-polar GaN HEMTs. Together, these demonstrations point to active engineering headroom that device makers and module suppliers can translate into manufacturable RF power transistors and MMIC building blocks for higher bands used in radar, backhaul, and satellite terminals.
Product and platform activity across both GaN and LDMOS supports whitespace in optimized architectures rather than a single-material transition. For example, in May 2026 Ampleon released a two-stage LDMOS Doherty MMIC for 1800 to 2200 MHz macro base stations, aligned with continued sub-6 GHz coverage layers that prioritize cost per watt and linearity. In parallel, space and high-reliability satellite payloads and terminals create a pathway for rad-hard support components around GaN RF power chains, evidenced by Infineon introducing a radiation-hardened GaN HEMT driver in July 2026. This broadens addressable content beyond the transistor die into adjacent high-reliability RF power ecosystems, where qualification, packaging, and traceability are decisive purchasing criteria.
Recent Industry Developments in RF And Microwave Transistors Market
- July 2026: Infineon introduced the RIC70115 radiation-hardened GaN HEMT driver aimed at high-reliability space applications. The launch expands space-qualified building blocks that support GaN-based RF power stages and improves sourcing options for satellite terminal and payload designers that need rad-hard supporting components around RF power amplifiers.
- June 2026: Qorvo introduced the QPF5012 X-band radar front-end module, specifying 10 W transmit power and 42% power-added efficiency in a 7x5 mm package. The compact, higher-efficiency module format supports tighter SWaP targets in radar subsystems and accelerates adoption of integrated front-end solutions over more discrete RF lineups.
- June 2024: Qorvo released three compact, high-power Ku-band satcom MMIC amplifiers aimed at satellite communications terminals. The additions broaden the catalog for Ku-band ground and airborne terminals, where integration level and thermal performance influence OEM design choices and time-to-qualification.
RF And Microwave Transistors Market Report Scope and Research Methodology
Market Definition and Coverage
For this study, the market covers revenue earned from RF and microwave transistors sold for amplifying or switching signals in wireless, radar, satellite, industrial RF systems, and related high frequency electronics, counted at the manufacturer level and mapped by end use and geography.
Scope exclusions: We exclude full RF front end modules, complete power amplifier modules, passive components, and system level equipment revenue even when a transistor is embedded.
Segments Covered in This Report
- By Frequency Band
- LF (More than 1 GHz)
- L-Band (1-2 GHz)
- S-Band (2-4 GHz)
- C-Band (4-8 GHz)
- X-Band and Above (Less than 8 GHz)
- By Material Type
- Silicon LDMOS
- Gallium Nitride (GaN)
- Gallium Arsenide (GaAs)
- Silicon Carbide (SiC)
- Other Material Types
- By Power Output
- Below 10 W
- 10-50 W
- 50-150 W
- Above 150 W
- By End-User Vertical
- Communication Infrastructure
- Consumer Electronics
- Automotive
- Industrial and IoT
- Aerospace and Defense
- Other End-User Verticals
- By Application
- 4G/5G Macro Base Stations
- Small Cells and DAS
- Radar Systems
- Satellite Communications
- IoT Devices
- Other Applications
- By Geography
- North America
- United States
- Canada
- Mexico
- Europe
- United Kingdom
- Germany
- France
- Italy
- Rest of Europe
- Asia-Pacific
- China
- Japan
- India
- South Korea
- Rest of Asia
- Middle East
- Israel
- Saudi Arabia
- United Arab Emirates
- Turkey
- Rest of Middle East
- Africa
- South Africa
- Egypt
- Rest of Africa
- South America
- Brazil
- Argentina
- Rest of South America
- North America
Data Sources, Market Sizing, and Validation
Desk Research
Desk work started with public datasets that help anchor demand pools and technology shifts, and we used them to set reasonable boundaries before we built the model. Sources used include items such as the ITU for mobile network rollout signals, the FCC for spectrum and licensing context, the International Trade Centre (ITC) Trade Map for cross-checking semiconductor trade flows, and OECD industry statistics for macro electronics output indicators.
To ground the product side, we also referred to sources such as IEEE publications for device level trends (GaN, GaAs, LDMOS), patent databases to see where new RF device work is concentrated, and SEC filings plus investor presentations for directional revenue exposure by end market. A paid subscription for company financials and a separate news and financials source were used to keep corporate actions and capacity announcements consistent in timing. These examples are not exhaustive, and we consulted additional public documents and data tables to fill gaps, validate assumptions, and clarify the research story.
Primary Interviews and Surveys
Primary discussions were used to confirm what portion of transistor demand is truly RF or microwave, and how pricing changes by material and power class in real bids. We spoke with a mix of device suppliers, distribution participants, and OEM and subsystem buyers across telecom infrastructure, aerospace and defense, satellite communications, and industrial RF, then rechecked any outlier assumptions with follow up calls so the final model stays practical.
Distribution of primary research fieldwork respondents
| Company type | Respondent position | Region |
|---|---|---|
| Top tier: 38% | CXOs: 14% | APAC: 38% |
| Mid tier: 45% | Functional/Unit leaders: 38% | EMEA: 36% |
| Smaller Players: 17% | Managers: 48% | Americas: 26% |
Market-Sizing & Forecasting
We built the core market size using a top-down approach where semiconductor output indicators, wireless infrastructure activity, and defense and satellite procurement signals are reconstructed into a transistor demand pool, which is then filtered by typical transistor content per system and technology mix. To keep the totals grounded, we also ran selective bottom-up checks such as sampled ASP times unit volumes for key device groups, plus channel feedback on shipment momentum, and then adjusted for any double counting.
Inputs that mattered in this market included the 5G macro and small-cell rollout pace, RF power amplifier adoption by band, GaN versus GaAs versus LDMOS mix shifts, average selling price movement by power level, and the timing of radar and satellite payload builds. Where direct volume visibility is weak, for example in certain specialized defense programs, we handled gaps through proxy build rates and expert ranges, and we only expanded the range when multiple interviews pointed to the same uncertainty.
For forecasting, we used scenario analysis so different rollout and procurement paths could be tested without forcing a single straight line outcome. The scenarios were anchored on expected spectrum deployment timing, capacity expansion lead times, and pricing normalization, and our model was then rolled back to one central case that interviewees considered most likely.
Data Validation & Update Cycle
Outputs were cross checked against independent signals, such as regional telecom capex direction, trade flow changes for relevant semiconductor categories, and company commentary on RF device order patterns. Any sharp step changes were reviewed again at input level, and the drivers were re-tested so the logic remains consistent across regions and end uses.
Before sign-off, the draft model goes through a multi-step analyst review where assumptions, math links, and unit conversions are checked, followed by a final variance scan versus earlier editions. The report is refreshed annually, and interim updates are triggered when a material event occurs, such as a major capacity change, a large defense order cycle shift, or a technology inflection that changes the mix.
Mordor Intelligence's Global Rf and Microwave Transistors Market Size Measured Against Other Published Estimates
It is common to see different market values published for RF and microwave transistors because the boundary can shift between discrete transistors and broader RF power semiconductor content, and because some studies mix device revenue with module or subsystem revenue. Differences also show up when the base year is not the same, when currency conversion timing is handled differently, or when price trends are assumed to move faster than real contract pricing.
By tracking device-level mix (GaN, GaAs, LDMOS), checking telecom and defense demand indicators by region, and refreshing the model inputs on a defined annual cycle, Mordor Intelligence keeps the count tied to transistor revenue rather than adjacent RF modules. That focus is a key reason values can diverge across publishers.
Benchmark comparison
| Source | Market Size | Gaps in Research Methodology |
|---|---|---|
| Mordor Intelligence | USD 9.61 B (2026) | |
| Industry Publisher A | USD 5.15 B (2025) | This estimate is framed around RF and microwave power transistors only, which can omit lower power and broader signal transistor demand used in RF chains, and it also uses a different base year that changes the implied run rate. |
| Industry Publisher B | USD 4.60 B (2025) | The scope is stated around RF/microwave power transistors by type and application, and the model appears to lean heavily on a narrower application set, which can undercount device shipments tied to infrastructure refresh cycles outside the highlighted segments. |
The spread is mainly explained by what gets included, especially whether only power devices are counted or the wider RF and microwave transistor set is captured across end uses. When scope is kept consistent and inputs are tied back to observable rollout and build signals, the resulting number is easier to trace, explain, and update with the same repeatable steps year after year.
Key Questions Answered in the Report
What is the forecast value for the RF and microwave transistors market in 2031?
The market is expected to reach USD 14.66 billion by 2031, reflecting an 8.82% CAGR over the 2026-2031 forecast period.
Which region leads current demand for RF and microwave transistors?
Asia Pacific generates the largest revenue share at 43.92% because of extensive 5G infrastructure buildouts in China and India.
Which material platform is growing fastest?
GaN devices show the highest growth, advancing at 10.31% CAGR as they displace silicon LDMOS in high-power and millimeter-wave uses.
Why are radar systems an important growth avenue?
Radar programs in military aviation and missile defense are shifting to AESA architectures, which require high-power GaN transistors, fueling an 10.78% CAGR for the segment.
What is the main supply-chain challenge for GaN devices?
Tight wafer capacity among a handful of substrate suppliers pushes lead times beyond 26 weeks, affecting defense and telecom production schedules.
How do export controls influence competition?
United States restrictions on GaN devices above 27 GHz fragment global supply chains and encourage local fabrication efforts in China and allied countries.