
Market Overview
| Study Period | 2020 - 2031 |
|---|---|
| Market Size (2026) | USD 193.38 Billion |
| Market Size (2031) | USD 254.24 Billion |
| Growth Rate (2026 - 2031) | 5.63 % |
| Fastest Growing Market | Asia Pacific |
| Largest Market | Asia Pacific |
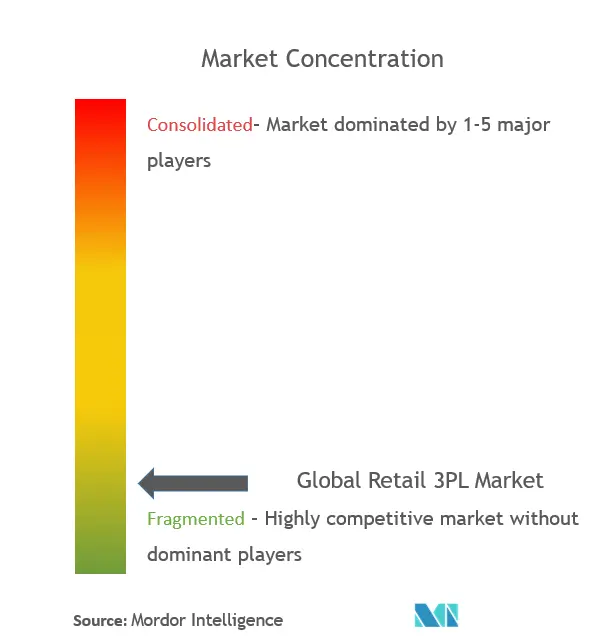
| Market Concentration | Low |
Major Players *Disclaimer: Major Players sorted in no particular order Image © Mordor Intelligence. Reuse requires attribution under CC BY 4.0. | |
Retail 3PL Market Analysis by Mordor Intelligence
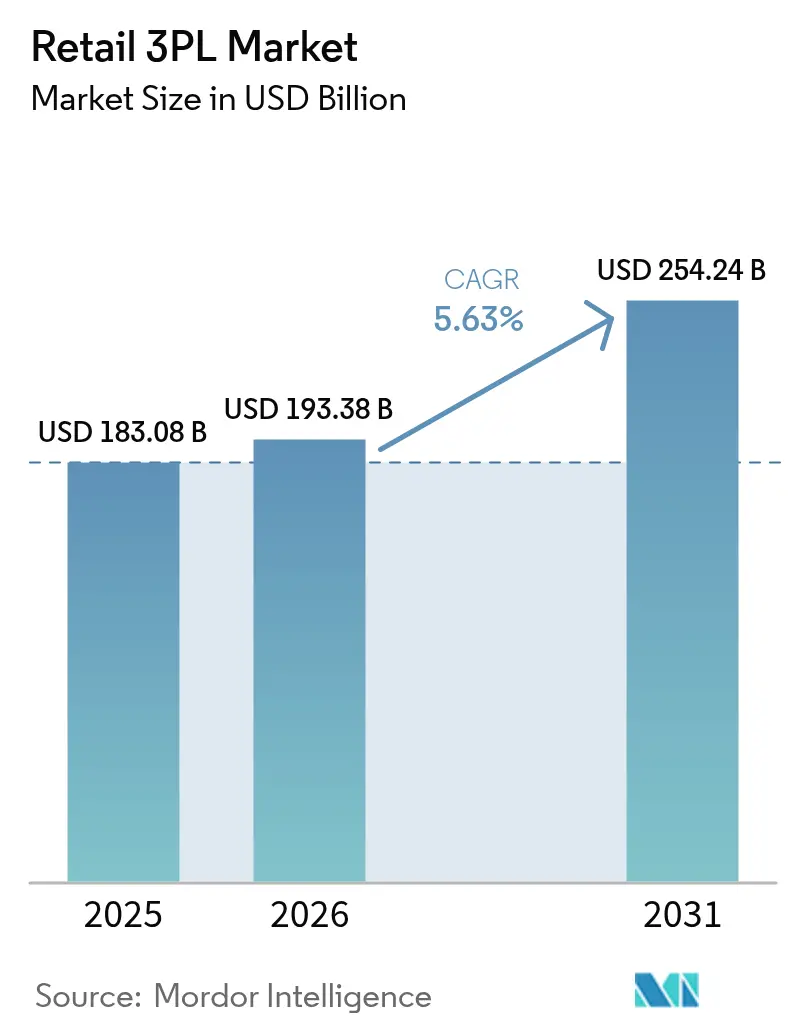
The Retail 3PL Market size was valued at USD 183.08 billion in 2025 and estimated to grow from USD 193.38 billion in 2026 to reach USD 254.24 billion by 2031, at a CAGR of 5.63% during the forecast period (2026-2031). Asia-Pacific leads with a 38% share in 2024 and also posts the fastest 7.62% CAGR, highlighting how retail modernisation and cross-border e-commerce concentrate growth in one region. The hybrid logistics model remains the structural cornerstone, but the asset-light approach is gaining ground, signalling a decisive shift toward variable-cost capacity, tighter technology integration, and nimble network design. Domestic Transportation Management still delivers the bulk of shipments, yet International Transportation Management grows faster as retailers pivot to global sourcing and cross-border parcel flows. Reverse logistics has moved from a peripheral service to a core differentiator because online fashion returns erode margins unless handled with specialised technology and processes. Labour shortages, wage inflation, and escalating cybersecurity threats temper growth, pushing 3PLs to automate, upskill, and harden digital defences.
Key Report Takeaways
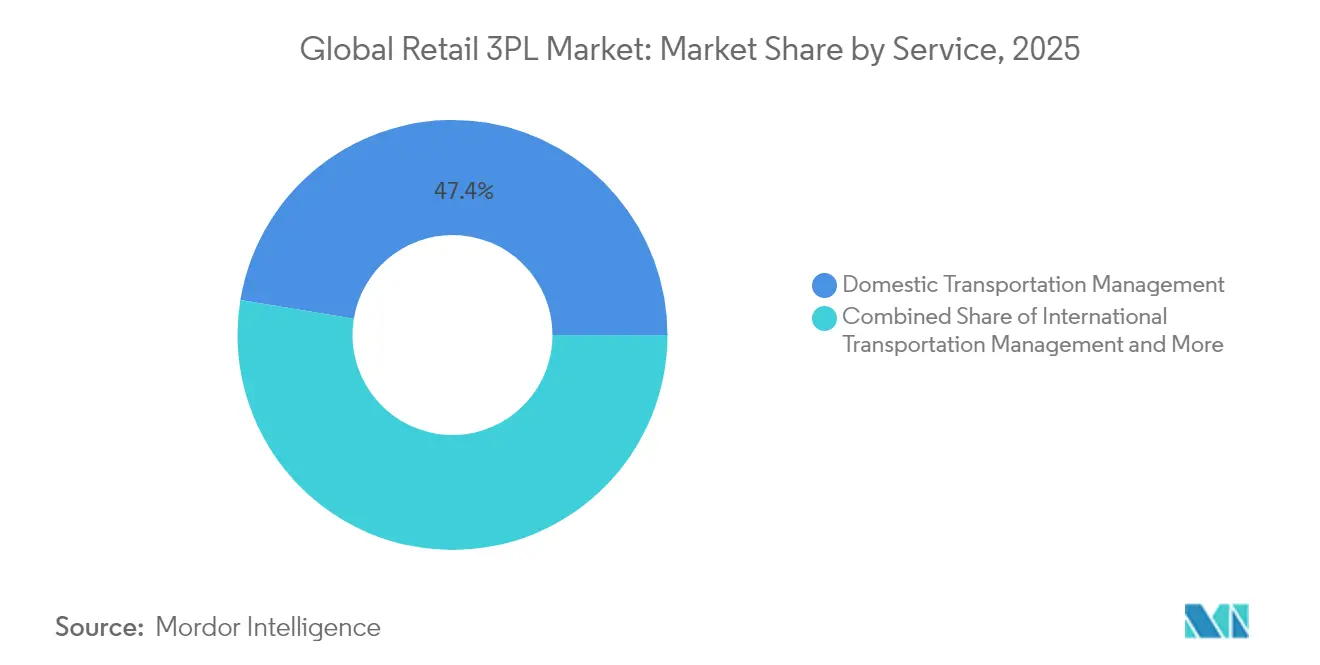
- By service, Domestic Transportation Management held 47.40% of the retail 3PL market share in 2025. The Retail 3PL Market for International Transportation Management is rising at a 6.84% CAGR between 2026-2031.
- By product category, Food & Beverages commanded a 33.55% share of the retail 3PL market size in 2025. The Retail 3PL Market for Fashion & Lifestyle is advancing at a 6.35% CAGR between 2026-2031.
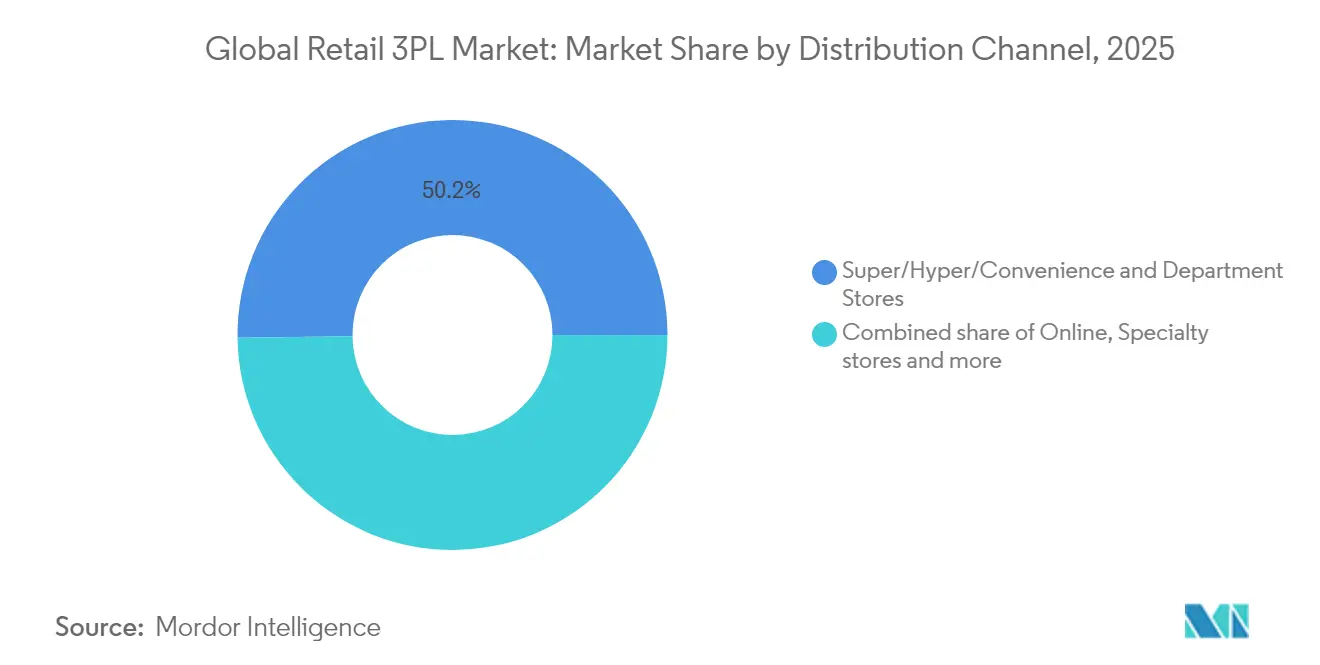
- By distribution channel, Super/Hyper/Convenience & Department Stores controlled 50.20% of the retail 3PL market size in 2025. The Retail 3PL Market for the Online channel is expanding at a 8.96% CAGR between 2026-2031.
- By the logistics model, the Hybrid model led with a 40.35% of the retail 3PL market size share in 2025. The Retail 3PL Market for the Asset-Light model is growing at 6.64% CAGR between 2026-2031.
- By region, Asia-Pacific accounted for 37.60% of the retail 3PL market share in 2025. The Retail 3PL Market in Asia-Pacific continues to outpace others with a 7.34% CAGR between 2026-2031.
Note: Market size and forecast figures in this report are generated using Mordor Intelligence’s proprietary estimation framework, updated with the latest available data and insights as of 2026.
Global Retail 3PL Market Trends and Insights
Drivers Impact Analysis*
| Driver | (~) % Impact on CAGR Forecast | Geographic Relevance | Impact Timeline |
|---|---|---|---|
| Surge in online fast-fashion returns | +1.2 | Global; strongest in North America & Europe | Medium term (3–4 years) |
| Adoption of micro-fulfilment centres | +0.9 | North America, Europe, developed Asia-Pacific | Medium term (3–4 years) |
| Cross-border e-commerce growth | +0.7 | Global; emphasis on China-to-world lanes | Long term (≥5 years) |
| Renewable-energy-powered warehouses | +0.3 | Europe, North America | Long term (≥5 years) |
| Omni-channel transformation | +1.0 | Global; led by North America | Medium term (3–4 years) |
| Near-shoring to Mexico | +0.6 | North America; spillover to Central America | Medium term (3–4 years) |
| Source: Mordor Intelligence | |||
Surge in Online Fast-Fashion Returns
Serial returners and generous return policies in online fashion retail create flux in warehouse workflows and inventory valuation. The National Retail Federation states that total retail returns hit USD 890 billion in 2024, with fashion the most affected segment. Returns now cost more than 50% of the original sales price, prompting retailers to shift the task to 3PLs that specialise in reclamation and refurbishment. Venture capital keeps flowing into technology-enabled reverse-logistics platforms, and DHL Supply Chain’s January 2025 acquisition of Inmar Supply Chain Solutions positions it as North America’s largest returns processor[1]DHL Group, “DHL Supply Chain to Acquire Inmar Returns,” group.dhl.com. Asset-light 3PLs scale swiftly in this niche because they can deploy cloud-based platforms without legacy network constraints, improving recovery rates and cycle time.
Adoption of Micro-Fulfilment Centers
Grocery chains and quick-commerce specialists compress last-mile distances by embedding 5,000-10,000 sq ft automated modules inside or beside urban stores. Hy-Vee partners with Takeoff Technologies, while Amazon pilots Fulfil’s robotics at select Whole Foods sites. The micro-fulfilment model trims unit economics: shorter picks, lower delivery miles, and higher on-shelf availability. For 3PLs, micro-fulfilment adds a new service line that blends automation engineering, maintenance, and rapid-replenishment transport. Early adopters report cycle-time reductions exceeding 30% and double-digit productivity gains, making the model a catalyst for wider network redesign.
Cross-Border E-commerce Platforms Fueling Bonded Warehousing
Retailers targeting consumers overseas rely on bonded warehouses that defer duties and simplify returns. China hosts 165 cross-border e-commerce pilot zones that have cut clearance times by 50% since 2020, accelerating throughput for brands shipping both into and out of the country. Latin American and Southeast Asian markets copy this blueprint, spurring 3PL investment in blockchain-enabled compliance and real-time customs visibility. Bonded capacity thus becomes a strategic asset that merges duty-saving benefits with speed-to-door expectations of global shoppers.
Renewable-Energy-Powered Warehouses
Solar, on-site storage, and electric-vehicle charging transform distribution hubs into micro-grids. Prologis surpasses 500 MW of installed solar and targets 1 GW in 2025. A joint Prologis–Maersk EV facility in Torrance, California, delivers 96 chargers and 18 MWh storage, supporting California’s 2035 diesel phase-out. While adoption lags in markets with lower electricity prices, regulatory incentives in Europe push 3PLs to integrate energy as part of value-added services, further differentiating providers.
Restraints Impact Analysis*
| Restraint | (~) % Impact on CAGR Forecast | Geographic Relevance | Impact Timeline |
|---|---|---|---|
| Labour shortages and wage inflation | -0.8% | Global; acute in North America, Europe | Short term (≤ 2 years) |
| Cyber-security risks | -0.6% | Global | Medium term (2-4 years) |
| Fragmented trucking capacity | -0.5% | North America, Europe | Short term (≤ 2 years) |
| Escalating warehouse rents | -0.4% | Global; urban nodes most affected | Medium term (2-4 years) |
| Source: Mordor Intelligence | |||
Labour Shortages & Wage Inflation
A projected 85 million-worker gap by 2030 raises operating costs and compresses margins. Warehouse operators report a 73% labour-availability shortfall. To maintain throughput, 3PLs deploy autonomous mobile robots, labour-management software, and cross-training programs that raise productivity per hour. However, rapid wage escalation still erodes profitability in low-margin service lines, forcing providers to renegotiate contracts and pass through surcharges.
Cyber-security Risk From API-Integrated Networks
Retailers expose fulfilment APIs to 3PLs for real-time order, inventory, and transport visibility, but this openness expands the attack surface. Ninety-eight percent of organisations connect to a third party that has experienced a breach. In response, leading providers set up Security Operations Centres with AI-driven SIEM and enforce multi-factor authentication across partner ecosystems. Cyber insurance premiums rise, adding indirect cost pressure and prompting 3PLs to invest heavily in zero-trust architectures.
*Our forecasts treat driver/restraint impacts as directional, not additive. The impact forecasts reflect baseline growth, mix effects, and variable interactions.
Segment Analysis
By Service: International Logistics Outpaces Domestic Growth
International Transportation Management accelerates at a 6.84% CAGR, outstripping overall retail 3PL market growth as retailers diversify sourcing and expand marketplace reach. This service line relies on optimised airfreight, duty management, and multimodal routing, helping brands shorten fashion lead times and replenish electronics during promotional spikes. UPS moves to acquire Estafeta to bolster cross-border express capacity between Mexico and the United States. The heightened demand for time-definite delivery pushes 3PLs to integrate digital freight marketplaces, intelligent routing, and carbon-efficient modal shifts.
Domestic Transportation Management still accounts for 47.40% of 2025 revenue, thanks to entrenched brick-and-mortar networks and high-volume parcel flows. Amazon shipped 9 billion same- or next-day packages in 2024, covering 140 US metro areas and setting new service benchmarks. Continuous network densification, predictive inventory placement, and regional sort centres shorten final-mile distance and lower per-parcel cost. The retail 3PL market size for domestic services will continue growing, yet its share may erode as international flows accelerate and omnichannel models demand end-to-end coverage.


By Product: Food & Beverages Dominates While Fashion & Lifestyle Accelerates
Food & Beverages holds 33.55% of the 2025 revenue. Cold-chain compliance, stringent expiry windows, and multi-temperature handling warrant specialised transport and warehousing, making this segment sticky and resilient. Blockchain pilots trace farm-to-fork provenance, cutting recall time and limiting waste. Grocery retailers push 3PLs to certify facilities, integrate IoT sensors, and deploy predictive spoilage analytics, embedding technology deeper into daily operations.
Fashion & Lifestyle grows fastest at 6.35% CAGR, riding booming online sales and high return volumes. Vertical integration gains traction as brands internalise printing, embroidery, or micro-batch manufacturing to meet rapid trend cycles. The retail 3PL market size dedicated to fashion returns processing widens because 96% of returned items handled by GXO re-enter inventory, preserving margin. Circular-economy models, including second-hand apparel marketplaces, demand meticulous grading, sanitising, and re-listing workflows that sophisticated 3PLs now embed into fulfilment logic.
By Distribution Channel: Online Segment Drives Innovation
The Online channel expands at 8.96% CAGR and forces 3PLs to engineer agile, software-rich fulfilment. DHL’s 2024 consumer survey shows 57% of shoppers use smartphones for purchases and 41% abandon carts due to costly shipping, exposing how logistics speed and transparency equal conversion. Provider differentiation thus shifts toward API-ready platforms, real-time delivery ETAs, and sustainable packaging.
Super/Hyper/Convenience & Department Stores still anchor 50.20% of 2025 revenue because physical stores retain traffic and offer immediate product access. Yet store-pickup and curbside fulfilment rely on the same orchestration software as e-commerce, blurring channel distinctions. Retailers engage 3PLs to unify inventory across online and offline nodes, ensuring accuracy and timely replenishment.
By Logistics Model: Asset-Light Approaches Gain Momentum
Hybrid models, combining owned assets with partner capacity, held a 40.35% share in 2025 and match established retailers’ need for control in core markets, plus scalability in peak seasons. These models reduce capital intensity yet retain service consistency because lead sites remain under direct management.
Asset-Light models grow fastest at 6.64% CAGR as rising interest rates and rapid demand cycles make fixed assets riskier. RXO’s USD 1.025 billion purchase of Coyote Logistics underscores the appetite for brokerage scale and data-driven capacity. Asset-heavy networks keep traction in high-compliance niches; DHL Supply Chain runs 520 North American warehouses staffed by 52,000 associates. The retail 3PL industry, therefore, features the coexistence of flexible brokerages and deep-capability operators, with convergence around common digital platforms to sync capacity and demand.
Geography Analysis
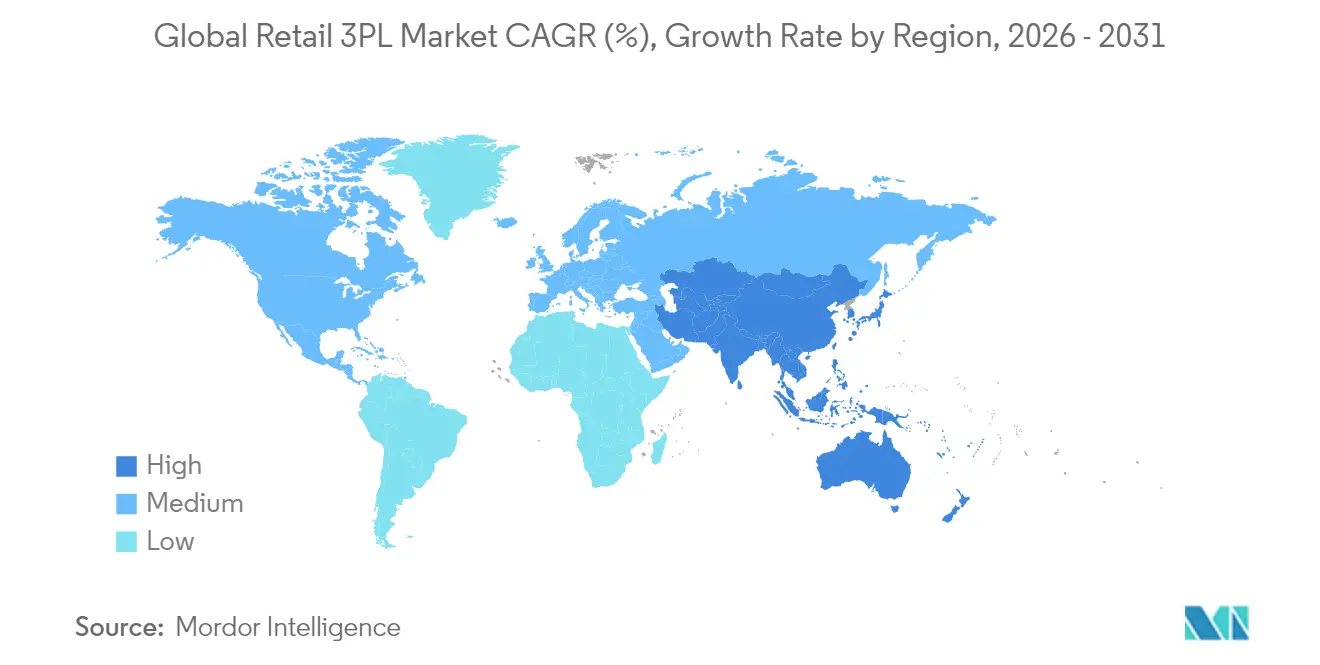
Asia-Pacific leads with a 37.60% share in 2025 and posts a 7.34% CAGR. China’s 165 e-commerce pilot zones slash customs delays, and India’s omnichannel adoption gains speed as mobile web traffic tops 60% of total sessions. Southeast Asian logistics corridors attract investment in smart sortation hubs and bonded, duty-free parks. Government incentives and booming middle-class consumption underpin sustained double-digit parcel growth, making the region a strategic imperative for global 3PLs. The retail 3PL market size in Asia-Pacific expands in tandem with electronic-goods exports and intra-Asia cross-border commerce.
North America remains technology-intensive and innovation-driven. Amazon leads the marketplace, while XPO expands less-than-truckload capacity after a major rival exited the market. High labour costs propel automation roll-outs, with Symbotic installing goods-to-person systems across Walmart’s network, adding a USD 5 billion backlog. Environmental regulations in California spur electrified drayage fleets, prompting 3PLs to invest in charging depots and renewable-powered distribution centres.
Europe features a regulatory push for carbon neutrality and continues to refine cross-border parcel compliance after Brexit. Prologis deploys rooftop solar at scale, and leading carriers trial hydrogen trucks along dense freight corridors. Escalating property rents in urban zones encourage multi-storey warehousing and robotic systems that maximise cubic utilisation. South America, the Middle East, and Africa remain smaller but show rapid e-commerce uptake, encouraging global 3PLs to pursue asset-light joint ventures, local partnerships, and targeted last-mile acquisitions.

Regulatory Landscape
Retail 3PL operations sit under a widening set of customs, tax, product-traceability, and sustainability compliance regimes, which increase the documentation and data-integration requirements placed on outsourced logistics providers. In March 2026, the European Parliament and Council reached a deal on Union Customs Code reform targeting e-commerce flows by shifting more responsibility to platforms/sellers as importers. The reform also creates a new EU Customs Authority in Lille and introduces a data-driven compliance model, including the EU Customs Data Hub, which raises the value of 3PLs offering importer-of-record support and auditable trade data management.
Region-specific programs also shape how 3PLs structure retail fulfillment and cross-border handling. Singapore IRAS updated its Approved Third Party Logistics Company Scheme e-Tax Guide in January 2026, tightening GST-related controls for qualifying 3PL activities. In the United States, national standards for third-party logistics providers under 21 USC 360eee-3 link certain logistics activities to licensing and accreditation requirements overseen through programs approved by the Secretary of Health and Human Services. In July 2026, US Customs and Border Protection updated its Supply Chain Integrity Guidelines, reinforcing the operational need for end-to-end traceability and screening aligned to enforcement tools such as Withhold Release Orders and UFLPA-related controls. This affects retail 3PLs running international transportation management and returns workflows.
Value Chain Analysis
The retail 3PL value chain begins with retailer demand planning and order capture (online and store-led), then moves through inbound freight management, covering domestic linehaul and international forwarding. Cross-border flows require customs and compliance services, followed by inventory positioning in multi-client distribution centers that increasingly incorporate automation. Fulfillment execution includes receiving, put-away, picking and packing, value-added services such as labeling, kitting, and postponement, and last-mile handoff to parcel and freight networks. Reverse logistics completes the loop through return authorization, inspection and grading, refurbishment, reintegration into saleable stock, and disposition (resale, liquidation, recycling). The hybrid logistics model remains central in retail because it combines controlled nodes for service consistency with variable-cost capacity for promotions and seasonal peaks.
Physical infrastructure owners, technology providers, and transport capacity partners act as key enablers and bottlenecks across the chain. Warehouse developers and operators provide multi-tenant space and energy or charging upgrades that influence site selection, while automation OEMs and WMS or TMS platforms shape throughput, labor intensity, and error rates, particularly in e-commerce and returns-heavy categories. Recent investments show where differentiation is concentrating: Maersk opened a 1.1 million sq ft fully automated distribution center in Singapore in March 2026 (World Gateway II), DP World launched an integrated logistics distribution center at Sokhna Logistics Park in Egypt in July 2026 to bundle warehousing with customs and freight coordination, and Hall Street 3PL expanded refrigerated capacity in Brooklyn, New York in May 2026 to serve perishable e-commerce and DTC fulfillment. These moves point to differentiation in automated fulfillment, cold-chain capability, and cross-border coordination, rather than basic storage and transport brokerage alone.
Competitive Landscape
Global leaders concentrate on scale, technology, and vertical integration. DSV’s planned EUR 14.3 billion (USD 16.28 billion) acquisition of Schenker will deepen European penetration and integrate Schenker’s value-added warehousing into DSV’s network. GXO’s USD 718 million purchase of Wincanton strengthens UK grocery and FMCG fulfilment. DHL Supply Chain gains returns-processing leadership through the Inmar deal.
E-commerce giants morph into logistics powerhouses. Amazon generated USD 156 billion from third-party services in 2024, dwarfing traditional 3PL revenues and compelling incumbents to match Amazon’s same-day benchmarks. Walmart’s automation investments pull robotics vendors like Symbotic into mainstream 3PL conversations, elevating pick-density expectations across the sector.
Brokerage consolidation heats up. RXO’s Coyote acquisition and Knight-Swift’s Dependable Highway Express deal expand network reach and tap synergies in procurement and asset utilisation. Asset-light economics lure investors because they deliver robust returns on capital via variable-cost structures and advanced data science. Providers unable to digitise encounter a margin squeeze and risk relegation to commodity capacity suppliers. Emerging disruptors deploy AI to forecast demand, match freight, and orchestrate multi-node fulfilment, creating white-space in sustainable logistics, bonded e-commerce, and reverse logistics specialties.
Retail 3PL Industry Leaders
DHL Supply Chain & Global Forwarding
XPO Inc.
DSV A/S
C.H. Robinson Worldwide
Ryder Supply Chain Solutions
- *Disclaimer: Major Players sorted in no particular order

Market Opportunities and Future Outlook
A major opportunity for retail 3PLs lies in taking on higher-accountability roles in cross-border e-commerce, where customs reforms and enforcement models are becoming more data-intensive. The March 2026 agreement on EU Union Customs Code reform, including the creation of an EU Customs Authority in Lille and the move toward centralized data mechanisms, expands demand for services such as importer-of-record support, bonded and duty-management workflows, and real-time customs visibility. These offerings can be embedded into international transportation management and returns handling.
Technology-enabled network orchestration is another clear whitespace area as retailers and large shippers consolidate providers and ask for integrated, multi-node fulfillment with predictable service levels. Industry work on 3PL-customer convergence, highlighted in 2026 by Armstrong & Associates, and the 2026 focus on advanced supply chain technologies, including AI-enabled planning and simulation, aligns with the report trend toward hybrid and asset-light models that rely on unified platforms to coordinate distributed capacity. Market activity reinforces this direction, including Maersk committing USD 100 million in July 2026 for a fulfillment hub in Hopedale, Massachusetts to add Northeast delivery capacity, and Maersk operating a fully automated mega-DC online in Singapore in March 2026, supporting investment in high-throughput, automation-heavy nodes that handle omnichannel retail and returns complexity.
Recent Industry Developments
- June 2026: DSV automated fulfilment operations at its Venlo logistics centre in the Netherlands by deploying an Exotec Skypod robotic system. The upgrade strengthens storage density and throughput for retail fulfillment and returns handling, supporting higher SKU complexity and peak-season volatility in shared-user sites.
- January 2025: DHL Supply Chain acquired Inmar Supply Chain Solutions, expanding its scale in reverse logistics and returns processing in North America. The deal deepened DHL’s capability in high-volume retail returns workflows, which are increasingly central to e-commerce service-level agreements and margin recovery programs.
- September 2024: RXO completed its USD 1.025 billion acquisition of Coyote Logistics, adding brokerage scale and a larger managed transportation footprint. The transaction increased access to variable-cost capacity and digital freight matching, reinforcing the asset-light model that many retailers use to flex transportation networks during demand swings.


Research Methodology Framework and Report Scope
Market Definition and Coverage
For this study, the retail 3PL market is defined as the value of outsourced logistics services that support retail supply chains, covering paid activities like transportation management, warehousing, fulfillment, and returns handled by third-party providers across regions.
Scope exclusions: We exclude retailer-run in-house logistics operations (owned fleets and captive warehouses) and pure carrier-only parcel delivery that is not sold as a contracted retail 3PL service.
Segmentation Overview
- By Service
- Domestic Transportation Management
- Roadways
- Railways
- Airways
- Waterways
- International Transportation Management
- Roadways
- Railways
- Airways
- Waterways
- Value-Added Warehousing and Distribution (VAWD)
- Domestic Transportation Management
- By Product
- Foods and Beverages
- Personal and Household Care
- Fashion and Lifestyle (accessories, apparel, footwear)
- Furniture
- Electronics and Household Appliances
- Other Products
- By Distribution Channel
- Super/Hyper/Convenience and Department Stores
- Specialty Stores
- Online
- Other Channels
- By Logistics Model
- Asset-Light (Management-Based)
- Asset-Heavy (Own Fleet and Warehouses)
- Hybrid
- By Region
- North America
- United States
- Canada
- Mexico
- South America
- Brazil
- Argentina
- Chile
- Rest of South America
- Europe
- Germany
- United Kingdom
- France
- Spain
- Italy
- Netherlands
- Russia
- Rest of Europe
- Asia-Pacific
- China
- India
- Japan
- South Korea
- Singapore
- Vietnam
- Indonesia
- Australia
- Rest of Asia-Pacific
- Middle East
- United Arab Emirates
- Saudi Arabia
- Turkey
- Israel
- Rest of Middle East
- Africa
- South Africa
- Egypt
- Nigeria
- Kenya
- Rest of Africa
- North America
Data Sources, Market Sizing, and Validation
Desk Research
Desk research was used to set the outer limits of the model and to cross-check trends that show up in retail outsourcing. We reviewed public releases and datasets from sources such as the World Bank, UN Comtrade, OECD, the International Transport Forum, and U.S. Bureau of Transportation Statistics, mainly to understand trade intensity, freight activity, and the direction of logistics cost.
On the industry side, we also used company annual reports, investor presentations, and reputable logistics press to map service mixes and pricing discussions (for example, contract warehousing versus transportation management). In addition, we referenced paid databases for company financials and news, plus an import and export shipment-level database and global contracts and tenders to sense demand signals for retail-focused logistics outsourcing. These desk sources are not exhaustive, and many other public documents and datasets were also referenced for data collection, validation, and research clarification.
Primary Interviews and Surveys
Primary work focused on interviews and short surveys with 3PL executives, commercial leaders, operations managers, retail logistics buyers, and sector specialists across major regions, since pricing and scope can shift quickly by lane and service bundle. We used these discussions to confirm what gets contracted out in retail networks, to validate service-level splits such as warehousing, transportation management, and returns, and to pressure-test assumptions that desk sources cannot show clearly.
Distribution of primary research fieldwork respondents
| Company type | Respondent position | Region |
|---|---|---|
| Top tier: 33% | CXOs: 16% | APAC: 50% |
| Mid tier: 45% | Functional/Unit leaders: 24% | EMEA: 30% |
| Smaller Players: 22% | Managers: 60% | Americas: 20% |
Market-Sizing & Forecasting
Sizing starts with a top-down build that reconstructs retail logistics outsourcing from sector demand signals and service-intensity ratios, and then rolls it into a global value by region. The totals are then corroborated with selective bottom-up approximations, including sampled provider revenue mixes tied to retail exposure, channel checks on contract warehousing and fulfillment activity, and reasonableness tests using volume and average price proxies where data is available.
Key inputs used in the model include retail sales growth and channel mix shifts (store, online, and omnichannel), cross-border trade and import reliance for retail goods, warehousing capacity needs driven by inventory turns, freight rate direction that moves transportation spend, and reverse-logistics intensity linked to e-commerce returns. Where bottom-up signals were incomplete, gaps were handled using conservative penetration ranges agreed in expert calls, followed by sensitivity checks to avoid overstating outsourcing in markets with heavier in-house operations.
For forecasting, scenario analysis was used so the model can reflect different demand paths for retail volumes, freight pricing, and fulfillment network expansion. The final forecast path was selected after aligning scenarios with what primary respondents described as realistic contract renewal terms, typical price pass-through behavior, and expected automation investments in warehouses and distribution.
Data Validation & Update Cycle
Validation is done through repeated cross-checks between the model output and independent market signals, and then it is reviewed again before sign-off. We compare implied spend per unit of retail activity, regional outsourcing intensity, and the split between warehousing and transportation services against what interviews and public indicators suggest should be plausible.
Outliers are flagged when growth rates jump without a matching change in retail demand, freight market conditions, or capacity trends, and those items are sent back for analyst review and, when needed, follow-up calls. Reports are refreshed annually, with interim updates when material events occur such as sharp freight rate resets, major regulatory changes, or large network expansions. Before delivery, a final pass is performed so clients receive the latest updated view based on the most recent data and interview feedback.
Mordor Intelligence's Global Retail 3pl Market Size Versus Other Published Estimates
Published numbers for retail 3PL can look far apart because authors do not always count the same service bundle, and the difference is amplified when pricing assumptions change quickly in freight and warehousing. In our checks, the biggest drivers were how each source treats carrier-only parcel activity, whether in-house retail logistics is blended in, and how returns handling is priced and timed in the base year.
Some estimates expand the scope to include broader retail logistics spend, which can pull in in-house distribution costs and general parcel carrier revenue. In Mordor Intelligence, the value is counted only when it is a contracted, fee-based third-party logistics service sold to retail customers, and pure carrier-only parcel delivery is not added unless it is part of a 3PL-managed package.
Benchmark comparison
| Source | Market Size | Gaps in Research Methodology |
|---|---|---|
| Mordor Intelligence | USD 193.38 B (2026) | |
| Trade Journal A | USD 215.00 B (2026) | Uses a wider retail logistics umbrella that appears to bundle carrier-only parcel revenues and some non-contracted delivery spend, which inflates the addressable 3PL value during high-parcel growth years. |
| Industry Association B | USD 178.00 B (2025) | Anchors to a prior year and applies a conservative price progression, and it also tends to undercount value-added warehousing, returns processing, and fulfillment add-ons that are commonly priced as separate retail 3PL lines. |
Across the three figures, the spread is mainly explained by what gets included in the service stack and how the base year is treated, not by a disagreement that retail is outsourcing more logistics work. By keeping the model tied to contract-based 3PL revenue and cross-checking it against retail demand, freight conditions, and warehousing activity, the result stays traceable to clear variables and repeatable steps.


Key Questions Answered in the Report
What is the current size of the retail 3PL market?
The market stands at USD 193.38 billion in 2026 and is projected to reach USD 254.24 billion by 2031.
Which region drives the fastest growth in retail 3PL services?
Asia-Pacific leads both in share (37.60% in 2025) and growth, expanding at a 7.34% CAGR through 2031.
Why are reverse-logistics capabilities attracting investment?
Online fashion returns cost more than 50% of the original sale value and reached USD 890 billion industrywide in 2024, prompting 3PLs to scale specialised processing networks.
How fast is the online distribution channel growing?
The online channel posts a 8.96% CAGR over 2026-2031, almost double the overall market rate.
What is driving the shift toward asset-light logistics models?
Retailers seek variable-cost flexibility, and asset-light 3PLs outperform peers in shareholder returns, leading to 6.64% CAGR in this model.
How are big-box retailers changing their fulfilment strategies?
They integrate automation and store-based fulfilment; for example, 95% of Target’s online orders now ship from stores, reducing delivery costs 40% and cutting transit time 30%.
Page last updated on:


 Your data is secure and never sold or shared.


