
Remote Tank Monitoring System Market Size and Share
Market Overview
| Study Period | 2020 - 2031 |
|---|---|
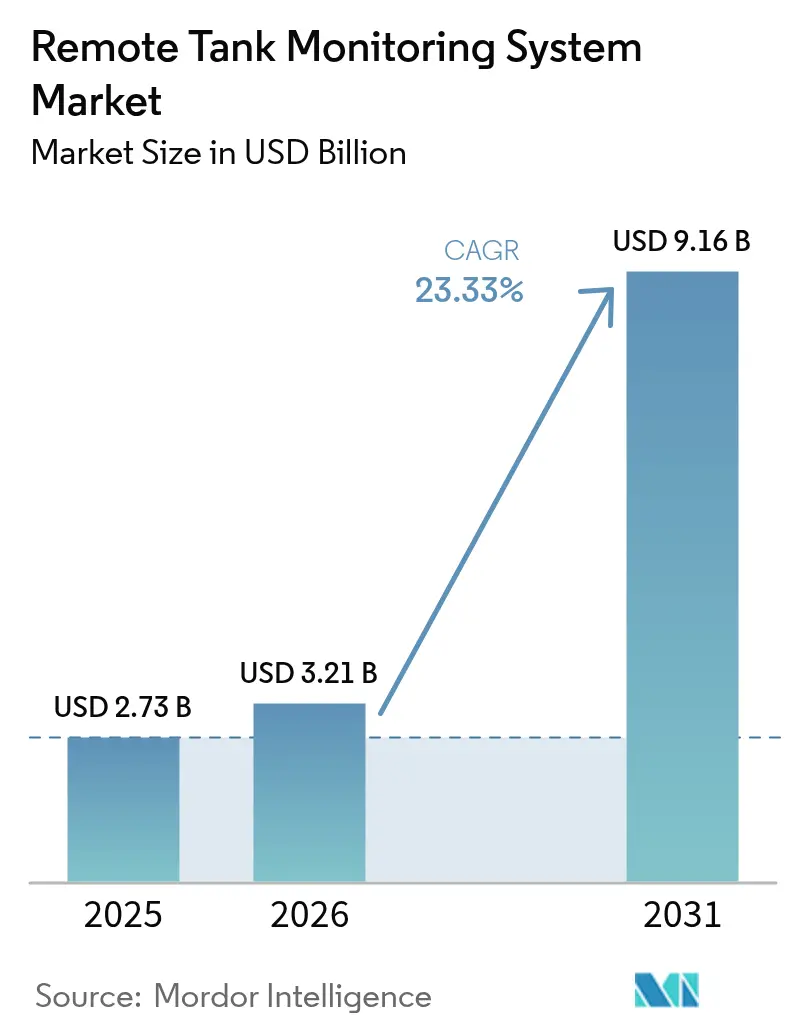
| Market Size (2026) | USD 3.21 Billion |
| Market Size (2031) | USD 9.16 Billion |
| Growth Rate (2026 - 2031) | 23.33% CAGR |
| Fastest Growing Market | Asia Pacific |
| Largest Market | North America |
| Market Concentration | Medium |
Major Players *Disclaimer: Major Players sorted in no particular order Image © Mordor Intelligence. Reuse requires attribution under CC BY 4.0. | |
Remote Tank Monitoring System Market Analysis by Mordor Intelligence
The Remote Tank Monitoring System market size is projected to expand from USD 2.73 billion in 2025 and USD 3.21 billion in 2026 to USD 9.16 billion by 2031, registering a CAGR of 23.33% between 2026 to 2031. Strong enforcement of environmental-protection rules, hardware-as-a-service (HaaS) pricing that lowers upfront costs, and low-earth-orbit (LEO) satellite links that eliminate cellular dead zones are accelerating deployments across oil, chemical, mining, and agricultural sites. Continuous-level gauges remain the preferred approach for regulated liquids, while contact sensors preserve a sizable installed base among custody-transfer terminals. Cellular networks still form the largest connectivity backbone, yet satellite and NB-IoT subscriptions are growing fastest as operators monitor assets in the Permian Basin, Western Australia, and Patagonia. The ecosystem is moderately consolidated: the top ten suppliers control about 55% of installed endpoints, but dozens of regional specialists target propane, irrigation, and mining niches. Shorter payback periods—now under 24 months for multi-tank farms—are broadening the Remote Tank Monitoring System market to mid-sized cooperatives and independent distributors.
Key Report Takeaways
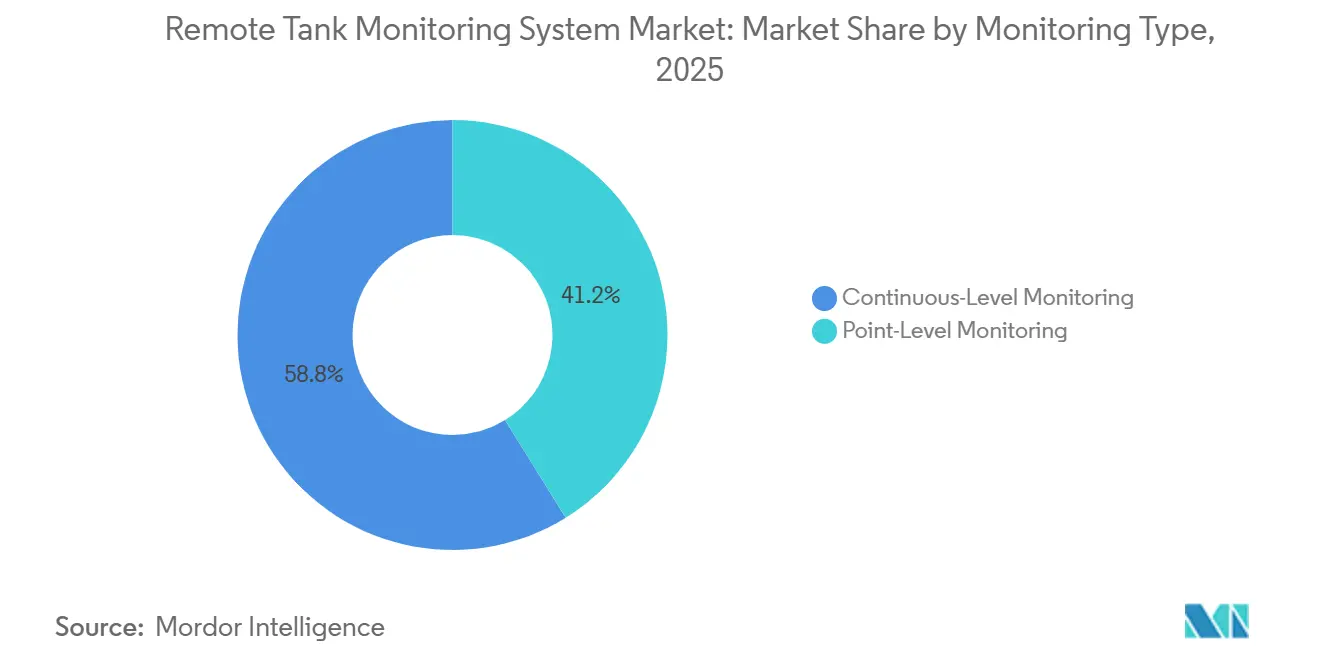
- By monitoring type, continuous-level systems held 58.82% of Remote Tank Monitoring System market share in 2025 and are forecast to advance at a 23.46% CAGR through 2031.
- By technology, contact sensors captured 36.77% share of the Remote Tank Monitoring System market size in 2025; they are projected to grow at 23.77% over 2026-2031.
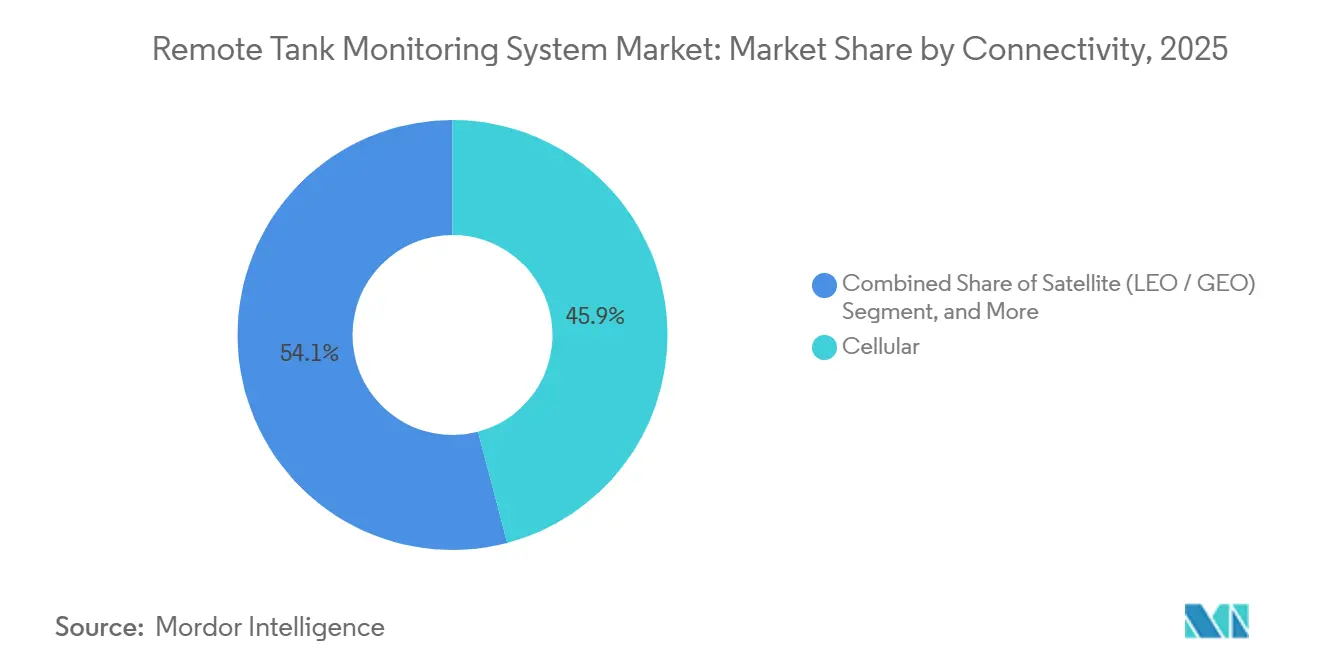
- By connectivity, cellular links accounted for 45.91% of 2025 revenue, whereas satellite is the fastest riser at 24.02% CAGR to 2031.
- By tank type, above-ground fixed-roof tanks led with 42.63% share in 2025, while floating-roof tanks post a 23.57% CAGR over the forecast horizon.
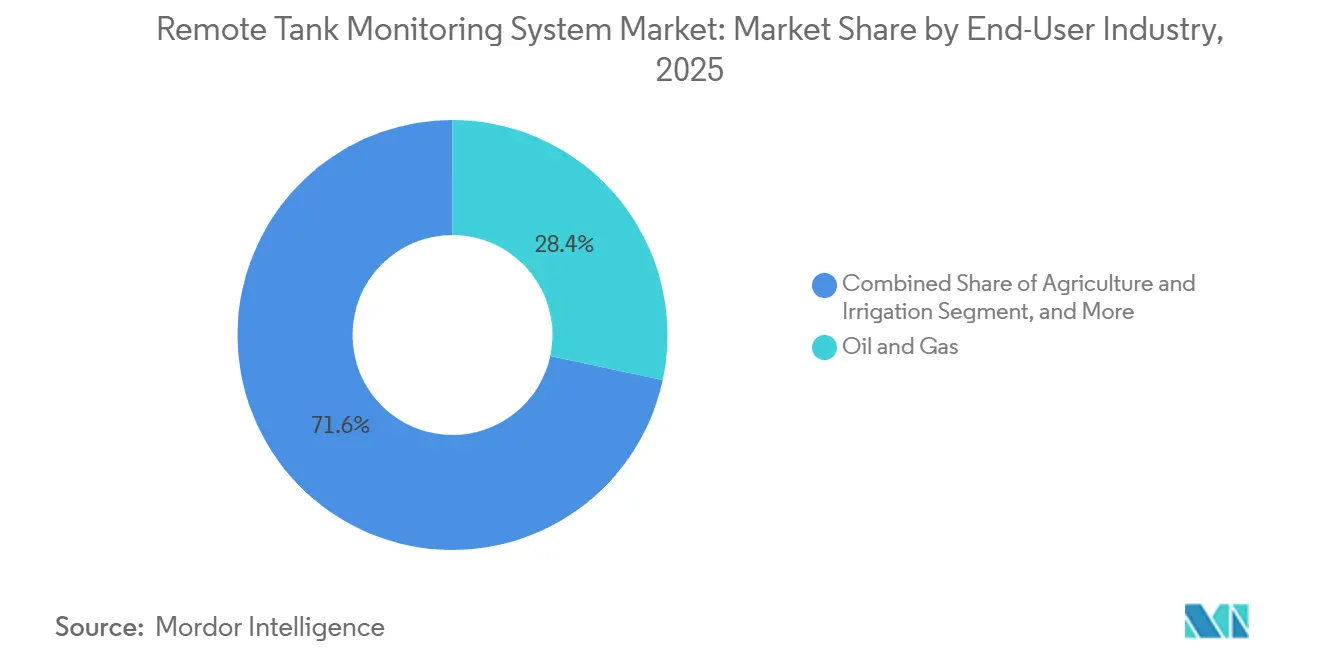
- By end-user industry, oil and gas contributed 28.36% of 2025 value, yet agriculture and irrigation command the quickest growth at 24.09% CAGR.
- By service model, stand-alone hardware sales represented 51.84% of 2025 turnover, but HaaS subscriptions exhibit a 23.41% CAGR to 2031.
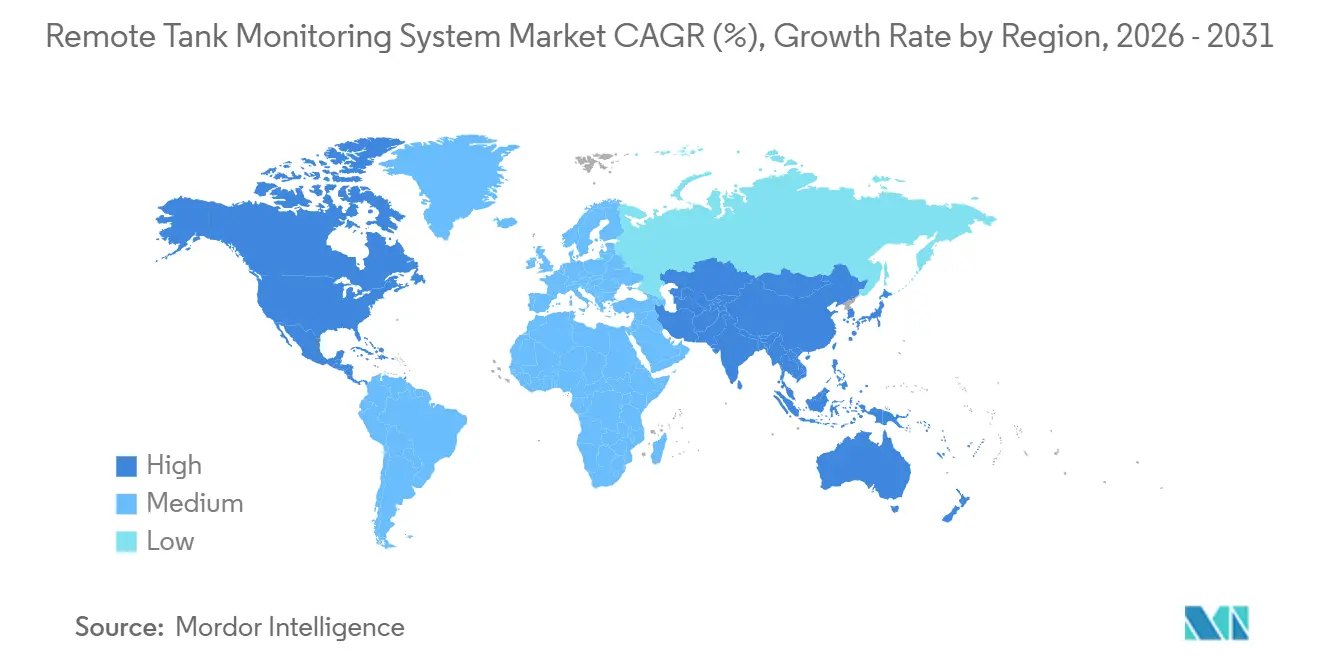
- By geography, North America led with 32.74% revenue in 2025; Asia-Pacific is set to grow at 24.13% CAGR, the steepest regional climb.
Note: Market size and forecast figures in this report are generated using Mordor Intelligence’s proprietary estimation framework, updated with the latest available data and insights as of 2026.
Global Remote Tank Monitoring System Market Trends and Insights
Drivers Impact Analysis*
| Driver | (~) % Impact on CAGR Forecast | Geographic Relevance | Impact Timeline |
|---|---|---|---|
| Expansion of oil and gas and chemical storage infrastructure | +4.2% | Global, with concentration in North America, Middle East, and Asia-Pacific petrochemical hubs | Medium term (2-4 years) |
| Proliferation of cloud-based IoT platforms | +3.8% | Global, led by North America and Europe, spillover to Asia-Pacific | Short term (≤ 2 years) |
| Stricter global spill-prevention and inventory regulations | +4.5% | North America and Europe, emerging enforcement in Asia-Pacific and Middle East | Long term (≥ 4 years) |
| Satellite-IoT coverage for ultra-remote tanks | +3.1% | North America shale basins, Australia mining districts, South America agriculture, Africa oil fields | Medium term (2-4 years) |
| HaaS subscription models lowering CAPEX barriers | +3.9% | Global, early adoption in North America and Europe, rapid uptake in Asia-Pacific | Short term (≤ 2 years) |
| Scope-3 ESG reporting pressure on bulk-liquid supply chains | +2.7% | Global, strongest in Europe and North America, growing in Asia-Pacific | Long term (≥ 4 years) |
| Source: Mordor Intelligence | |||
Expansion of Oil and Gas and Chemical Storage Infrastructure
Roughly 180 million barrels of new above-ground capacity were commissioned worldwide in 2025, 42% of which arose in the United States.[1]International Energy Agency, “Gas 2025,” iea.org Operators embedded radar and magnetostrictive probes during construction to satisfy American Petroleum Institute Standard 653, cutting retrofit expense and ensuring compliance at start-up. Saudi Aramco’s Jafurah condensate program equipped every new tank with wireless sensors feeding a digital twin, reducing manual gauging by 85% and unexpected shutdowns by 30%. In China’s Yangtze River Delta, 12,000 transmitters went live during 2025 to meet hazardous-chemical rules that require real-time alarms. Continuous telemetry shortens inventory reconciliation from weekly to hourly intervals, lowering working capital by up to 20% for integrated petrochemical hubs.
Proliferation of Cloud-Based IoT Platforms
Microsoft Azure IoT Operations processed 4.5 billion daily sensor messages by December 2025, with tank-level data ranking third largest.[2] Edge analytics on local gateways cut cellular traffic by 60% and maintained sub-second alarms during outages. Emerson Plantweb Optics added 2,300 endpoints in 2025, trimming tank-cleaning downtime by 25%. Democratized analytics now let mid-sized propane dealers run weather-driven refill schedules, reducing truck rolls. Total cost for a 50-tank installation has fallen from USD 85,000 in 2024 to USD 62,000 in 2026, pushing the Remote Tank Monitoring System market deeper into the mid-market.
Stricter Global Spill-Prevention and Inventory Regulations
The revised U.S. Spill Prevention, Control, and Countermeasure (SPCC) rule mandates electronic alarms and recordkeeping for high-risk sites, with 2025 penalties averaging USD 42,000 per violation. Europe’s Industrial Emissions Directive extended real-time monitoring to volatile-organic tanks.[3]European Commission, “Industrial Emissions Directive,” ec.europa.eu spurring an 18% jump in radar installations at German, French, and Dutch plants. China required quarterly leak surveys for benzene and xylene tanks, driving more than 8,000 wireless nodes at Sinopec and PetroChina sites in 2025. Compliance motives are turning sensor deployments into insurance premiums rather than discretionary upgrades, widening the Remote Tank Monitoring System market.
Satellite-IoT Coverage for Ultra-Remote Tanks
SpaceX Starlink Direct-to-Cell connected 1,200 West Texas tanks by December 2025, eliminating weekly USD 350 inspection trips and shrinking leak-detection latency from 7 days to 2 hours. Eutelsat OneWeb signed Australian miners to monitor diesel and water storage in the Pilbara desert, where geostationary latency hampers alarms. Argentine cooperatives installed 850 LoRa-to-satellite gateways in 2025, cutting water waste 22% and avoiding 14 chemical spills. Although satellite adds USD 18–25 monthly per node, it remains 70% cheaper than laying terrestrial backhaul for dispersed assets.
Restraints Impact Analysis*
| Restraint | (~) % Impact on CAGR Forecast | Geographic Relevance | Impact Timeline |
|---|---|---|---|
| High upfront hardware and integration costs | -2.8% | Global, most acute in price-sensitive segments such as agriculture and small distributors | Short term (≤ 2 years) |
| Cyber-security and data-ownership concerns | -1.9% | Global, heightened in critical infrastructure sectors (oil and gas, chemicals, water) | Medium term (2-4 years) |
| Battery-waste sustainability liabilities | -1.2% | Europe and North America, emerging in Asia-Pacific | Long term (≥ 4 years) |
| Steel and aluminum tariffs inflating device BOM | -1.6% | Global, concentrated impact in North America and Europe | Short term (≤ 2 years) |
| Source: Mordor Intelligence | |||
High Upfront Hardware and Integration Costs
A fully featured wireless radar node plus solar power and gateway averages USD 2,200–3,800, with another USD 800–1,500 for historian mapping and staff training. A 500-tank propane fleet costs USD 1.1 million, nearly two years of net income for many small distributors. Seventy-eight percent of Indian and Brazilian cooperatives in a 2025 International Water Management Institute survey said concessional loans would be required for breakeven within five years. HaaS eases the burden, but price-sensitive sectors still postpone adoption, limiting Remote Tank Monitoring System market penetration among micro-operators.
Cyber-Security and Data-Ownership Concerns
ICS-CERT logged 87 level-sensor incidents in 2025, highlighting rising operational-technology threats. Meeting IEC 62443 adds USD 15,000–40,000 to a 50-tank roll-out, while NIST recommends on-premises edge processing to retain data sovereignty, boosting hardware bills 25–30%. Many midsize firms lack the expertise to manage encryption, segmentation, and role-based access, delaying deployments or accepting residual risk, and thereby tempering Remote Tank Monitoring System market growth.
*Our forecasts treat driver/restraint impacts as directional, not additive. The impact forecasts reflect baseline growth, mix effects, and variable interactions.
Segment Analysis
By Monitoring Type: Continuous Dominance Reflects Compliance Mandates
The segment generated the largest share of Remote Tank Monitoring System market size in 2025 at 58.82%. Regulatory language in both the SPCC rule and Europe’s Industrial Emissions Directive explicitly calls for uninterrupted level tracking, locking in demand.
Continuous systems also feed machine-learning models that detect micro-leaks and optimize refill logistics, justifying their 60–80% price premium. Point-level probes remain relevant for low-value or non-hazardous liquids where budgets dominate purchase decisions, but their footprint is slowly eroding as standards migrate toward real-time visibility.


By Technology: Contact Sensors Retain Installed-Base Advantage
Contact probes held 36.77% Remote Tank Monitoring System market share in 2025, buoyed by decades of installed magnetostrictive and float-and-tape devices in refined-product terminals. Their ±1 mm accuracy still defines custody-transfer contracts, sustaining replacement demand.
Non-contact radar receivers are closing the gap for corrosive, foaming, or high-temperature duties, and the VEGAPULS 6X’s 80 GHz beam is displacing guided-wave radar in obstructed tanks. Yet many operators prefer proven wetted probes until decommissioning cycles force capex decisions, keeping contact technology expansion at a healthy 23.77% CAGR.
By Connectivity: Cellular Leads, Satellite Surges in Remote Zones
Cellular lines delivered 45.91% of 2025 revenue, supported by module prices that fell to USD 8–12 and data plans of USD 1.50–2.50 per month after Vodafone’s NB-IoT expansion across Germany.
Satellite services, however, register the fastest 24.02% CAGR. Starlink and OneWeb give miners, ranchers, and shale drillers real-time insight where towers are absent, and new flat-panel antennas simplify solar mounting. Hybrid modems that switch between Iridium and LTE cut fees 30% for Bakken assets, widening appeal.

By Tank Type: Fixed-Roof Tanks Dominate, Floating-Roof Grows Fastest
Fixed-roof designs controlled 42.63% of 2025 turnover. They house water, chemicals, and food liquids where vapor management is minor.
Crude-oil floating roofs, though, post a 23.57% CAGR as Standard 2350 overfill clauses and OGMP 2.0 methane audits compel radar decks. Endress+Hauser’s FMR67 compensates deck tilt, adding 2–3% usable capacity and quick payback.
By End-User Industry: Oil and Gas Leads, Agriculture Accelerates
Oil and gas supplied 28.36% of 2025 spending, chiefly for midstream and terminal compliance. Agriculture and irrigation, spurred by water-scarcity penalties and precision farming grants, climbs the fastest at 24.09% CAGR.
John Deer’s telemetry linked fertilizer tanks with variable-rate sprayers, trimming chemical waste 18% and raising yields 8–12% across Midwest corn and soy trials. Similar integrations across Asia-Pacific cooperatives enlarge the Remote Tank Monitoring System industry footprint beyond hydrocarbons.
By Service Model: Hardware Sales Dominate, Subscriptions Gain Momentum
Traditional hardware purchases still represented 51.84% of 2025 revenue as large refineries and pipelines prefer capex ownership.
HaaS subscriptions, though, expand at 23.41% as propane dealers and cooperatives shift costs to opex. Schneider Electric’s USD 50–65 monthly bundle reduced unplanned outages 28% in its first quarter. In parallel, fully managed platforms handle installation, connectivity, and analytics, appealing to operators short on IT staff.
Geography Analysis
North America commanded 32.74% of 2025 sales, driven by SPCC retrofits and strong propane adoption in the United States and Canada, driven by SPCC enforcement, extensive oil and gas infrastructure, and early industrial IoT adoption. Federal grants for rural broadband enhance LPWAN coverage, further propelling the deployment of remote tank monitoring systems in agricultural states. Canada’s renewed strategic petroleum reserve buildout adds cross-border momentum as operators harmonize asset management platforms.
Asia-Pacific increases the Remote Tank Monitoring System market size fastest at 24.13% CAGR. Chinese petrochemical clusters in Zhejiang and Jiangsu require vapor caps and continuous gauges, while India’s Jal Jeevan Mission funds LoRaWAN nodes for groundwater oversight.
Europe delivers 24% of global revenue on the back of Industrial Emissions enforcement and ESG reporting mandates. The Middle East deploys sensors for OGMP 2.0 methane tracking, and Australia’s miners use satellite backhaul to slash truck visits by 55%.

Regulatory Landscape
Remote tank monitoring deployments are shaped by spill prevention, overfill protection, and hazardous-area device requirements that push operators toward continuous measurement, automated alarms, and audit-ready data logging. In the United States, the EPA Spill Prevention, Control, and Countermeasure (SPCC) rule (40 CFR Part 112) is a primary compliance driver for aboveground oil storage, while API STD 2350 overfill protection practices are widely referenced for petroleum storage operations. In Europe, obligations tied to the Industrial Emissions Directive and major accident prevention regimes such as Seveso III (and national frameworks such as France ICPE) increase emphasis on real-time monitoring, recordkeeping, and alarm management at regulated storage sites.
Standards and safety certifications also act as market-entry gates for devices and system architectures. ISO/TS 7344:2024 supports interoperability considerations for wireless sensor communication in logistics and transport contexts, and hazardous-location deployments typically require IECEx or equivalent explosion-protection certification (aligned with IEC 60079 series) for monitors installed in potentially explosive atmospheres. U.S. critical infrastructure oversight continues to touch remote sensing and monitoring: PHMSA published regulatory documentation on April 24, 2026 on remote monitoring of hazardous liquid pipeline rectifiers, reinforcing scrutiny around remote monitoring infrastructure used in energy networks.
Value Chain Analysis
The value chain starts with sensing hardware and certified field devices (radar/FMCW, ultrasonic, hydrostatic pressure, magnetostrictive and float-based probes), supported by enclosures, intrinsically safe power options, and calibration practices aligned with custody-transfer and safety requirements (for example, ISO 15169 for hybrid tank measurement systems and metrology guidance such as OIML R 71 for level gauges). Device OEMs and system integrators then combine sensors with gateways and edge computing, handling protocol translation (for example, Modbus, HART, OPC UA, MQTT), site commissioning, and integration into historians, SCADA, and enterprise inventory systems. Connectivity providers complete the chain across cellular (LTE-M, NB-IoT), LPWAN, and satellite backhaul, with LEO and 5G non-terrestrial network (NTN) options used to address dead zones at dispersed assets.
Downstream, solution providers monetize through stand-alone hardware, HaaS/Tank Monitoring as a Service models, and fully managed turnkey offerings that bundle installation, connectivity, analytics, and support. Recent product activity highlights how the chain is shifting toward bolt-on connectivity and satellite options for remote coverage: Mopeka introduced GaugeLink to bridge mechanical gauges into BLE and cellular monitoring, and later launched Mopeka Satellite using Myriota connectivity, while One-Tank launched a Pulse satellite tank monitoring solution with Myriota. Compliance and hazardous-area requirements influence component selection and qualification across regions, including conformity expectations for explosive atmospheres referenced in large operator technical specifications (for example, Petrobras requirements tied to Brazil conformity regimes) and type-approval practices for measurement devices in markets such as the United Kingdom (OPSS).
Competitive Landscape
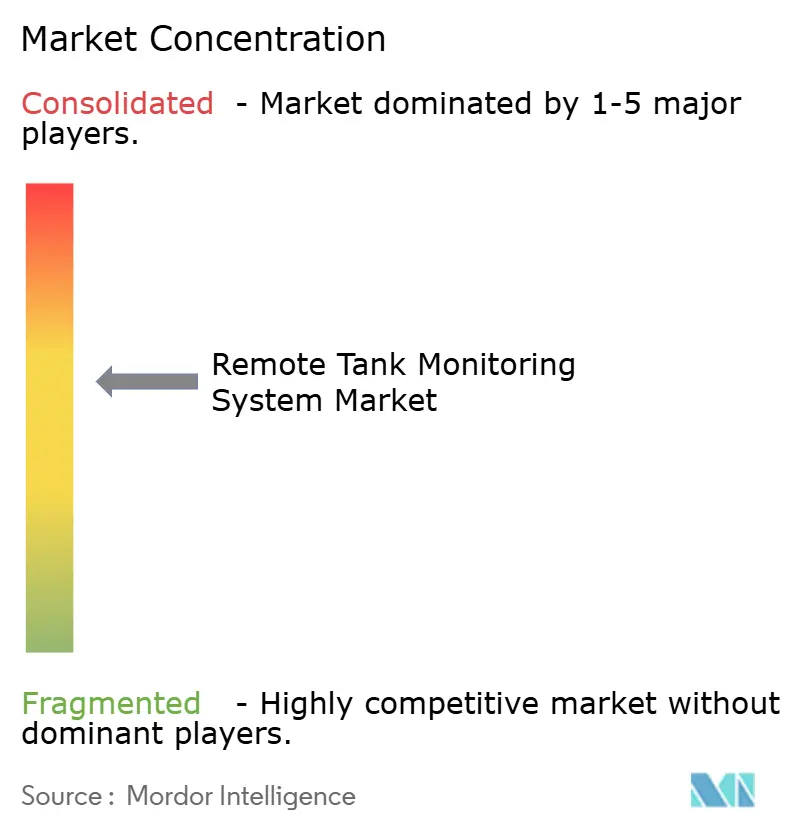
Market concentration is moderate, The ten largest vendors hold roughly 55% of installed endpoints. Emerson, Endress+Hauser, Honeywell, and Schneider Electric leverage multidecade relationships, proprietary protocols, and global service crews to maintain account stickiness.
Specialty firms such as Tank Utility, Otodata Wireless Network, and SkyBitz compete on turnkey cellular or satellite bundles that undercut incumbents 25–35% but forgo complex protocol translation. Emerging disruptors add edge AI to vibration or acoustic sensors, commanding premium pricing; Mistras Group’s predictive package prevented two catastrophic Gulf Coast releases in 2025.
Patent filings show Siemens and ABB racing to commercialize battery-free, energy-harvesting probes that answer EU Battery Regulation 2023/1542 obligations. Gateways priced at USD 120–180 from Digi International or Banner Engineering democratize access for cooperatives. The absence of a universal standard opens white space for interoperability clouds—Anova’s protocol-agnostic platform already stitches together Modbus, HART, OPC UA, and MQTT feeds.
Remote Tank Monitoring System Industry Leaders
Schneider Electric SE
Emerson Electric Co.
Banner Engineering Corp.
ATEK Access Technologies, LLC (TankScan)
Digi International Inc.
- *Disclaimer: Major Players sorted in no particular order

Market Opportunities and Future Outlook
A key opportunity lies in modernizing legacy and mechanically gauged tanks with bolt-on connectivity and simplified architectures that reduce retrofit complexity and bring smaller operators into managed service models. This shift is already visible, including Mopeka's GaugeLink launch to modernize tank monitoring by connecting mechanical gauges via BLE and cellular, and Emerson's Rosemount 2405 Monitoring Hub approach that consolidates data concentration, communications, and local display for automated inventory management. Replacement cycles also create whitespace where incumbent product lines are rationalized, for example Schneider Electric's end-of-production pathway for the Centeron tank monitoring line, which opens migration demand toward LTE/NB-IoT, hybrid, and satellite-capable alternatives.
Connectivity expansion into ultra-remote sites is also a practical route to new endpoints and higher-value service bundles, supported by recent satellite tank monitoring launches and partnerships such as One-Tank with Myriota (Pulse) and Mopeka Satellite using Myriota connectivity. Regulation and compliance add openings for platforms that automate records and alarms across multi-site portfolios: PHMSA actions in 2026 around remote monitoring for hazardous liquid pipeline rectifiers and proposed updates to inspection approaches for breakout tanks reflect ongoing rulemaking attention to monitoring and inspection practices, while the EU adopted Implementing Decision (EU) 2026/989 referencing EN 13616-1:2025 for overfill prevention devices. Together, these developments keep demand focused on certified devices, interoperable data capture, and secure remote operations aligned with cybersecurity frameworks such as IEC 62443.
Recent Industry Developments
- June 2026: Banner Engineering and RS expanded availability of plug-and-play Industry 4.0 sensors, including non-contact options used in remote monitoring and automation applications. Wider distribution through a major industrial channel improves procurement reach for integrators and end users standardizing sensor fleets across multiple sites. The move also supports faster retrofits where suppliers want short lead times and consistent part availability.
- November 2025: Emerson introduced the Rosemount 2405 Monitoring Hub to streamline tank monitoring architectures by consolidating communication, data concentration, and local display functions. The hub reduces integration effort for automated tank inventory management, which is a common friction point in multi-tank upgrades. It also strengthens Emerson's positioning in modernization projects that need a single point of connection to plant and enterprise systems.
- August 2024: TankScan (formerly ATEK Access Technologies) transitioned to new ownership under the ITEK LLC group. The change can influence product roadmap investment, channel strategy, and support continuity for installed base customers in niche tank monitoring deployments. It also reflects ongoing consolidation and portfolio reshaping among specialized telemetry providers.


Research Methodology Framework and Report Scope
Market Definition and Coverage
This market covers remote tank monitoring systems used to measure tank levels and basic tank conditions, and to send that data to a remote user through a software interface. It includes the typical device stack that makes remote visibility possible, plus related software and support services.
Scope exclusions: We exclude manual tank gauging without remote telemetry, and we also exclude broader SCADA or plant automation projects when tank monitoring is only a small add-on.
Segmentation Overview
- By Monitoring Type
- Point-Level Monitoring
- Continuous-Level Monitoring
- By Technology
- Contact Sensors
- Float and Tape Gauge
- Magnetostrictive
- Hydrostatic Pressure
- Non-Contact Sensors
- Ultrasonic
- Radar / FMCW
- Optical / Laser
- Contact Sensors
- By Connectivity
- Cellular (4G LTE, 5G, NB-IoT, Cat-M)
- LPWAN (LoRaWAN, Sigfox)
- Satellite (LEO / GEO)
- Short-Range RF / Wi-Fi / BLE
- By Tank Type
- Above-Ground Fixed-Roof
- Above-Ground Floating-Roof
- Underground / UST
- By End-User Industry
- Oil and Gas
- Chemicals and Petrochemicals
- Water and Wastewater
- Food and Beverage
- Agriculture and Irrigation
- Power Generation
- Mining and Metals
- Pharmaceuticals and Healthcare
- By Service Model
- Stand-alone Hardware Sales
- Hardware-as-a-Service (HaaS) Subscription
- Fully Managed Turnkey Platforms
- By Geography
- North America
- United States
- Canada
- Mexico
- South America
- Brazil
- Argentina
- Rest of South America
- Europe
- United Kingdom
- Germany
- France
- Italy
- Spain
- Russia
- Rest of Europe
- Asia-Pacific
- China
- Japan
- India
- South Korea
- Australia and New Zealand
- Southeast Asia
- Rest of Asia-Pacific
- Middle East
- Saudi Arabia
- United Arab Emirates
- Turkey
- Rest of Middle East
- Africa
- South Africa
- Nigeria
- Kenya
- Rest of Africa
- North America
Data Sources, Market Sizing, and Validation
Desk Research
Desk research helped us set the market boundaries and build the first demand picture before we spoke to participants. We leaned on public, non-paywalled sources such as US EPA spill-prevention guidance, USGS water and industrial data series, IEA energy statistics, and published spectrum and IoT connectivity notes from regulators and standards bodies.
To translate adoption into spend, we also reviewed company annual reports, investor decks, and product documentation that clarifies what is sold as hardware, software subscriptions, and field services. Where available, patent databases were used to map sensor and connectivity innovation, and paid subscription access to company financials and news helped cross-check revenue signals and major contract announcements. These examples are not exhaustive, and many other sources were also referenced to collect, validate, and clarify the final analysis.
Primary Interviews and Surveys
Primary work focused on interviewing system makers, integration partners, distributors, and large end users that operate tanks across fuels, chemicals, water, and agriculture. We used these interviews to confirm adoption pace, typical pricing behavior across hardware and recurring software, and the split between cellular and satellite deployments across APAC, EMEA, and the Americas.
Distribution of primary research fieldwork respondents
| Company type | Respondent position | Region |
|---|---|---|
| Top tier: 39% | CXOs: 12% | APAC: 45% |
| Mid tier: 47% | Functional/Unit leaders: 43% | EMEA: 35% |
| Smaller Players: 14% | Managers: 45% | Americas: 20% |
Market-Sizing & Forecasting
Sizing starts with a top-down build that links the reachable tank population and monitoring penetration to annual spending, where the installed base, replacement cycles, and service attach rates are reconstructed into value. The totals are then stress-tested using selective bottom-up checks, such as sampled average selling price ranges multiplied by expected unit volumes, plus channel feedback on subscription mix, to reduce overstatement.
Key inputs used in the model include the installed base of connected tanks, the share of tanks in regulated or high-risk liquid categories that require continuous monitoring, the connectivity split between cellular and satellite (including coverage constraints), average subscription terms, and typical hardware refresh timing. When information is missing by country or end-user type, we interpolate using nearby markets with similar tank density and similar connectivity economics, and then re-check the implied spend per monitored tank with interview feedback.
For forecasting, we use scenario analysis because adoption and pricing can shift quickly with regulation, network coverage, and changes in the service model. Assumptions on penetration uplift and price progression are aligned to what practitioners expect by region, and then applied consistently across the forecast window.
Data Validation & Update Cycle
Outputs are cross-checked against independent signals, including known installed base ranges, typical subscription pricing bands, and region-level adoption narratives from interviews. Large jumps by region or by component are flagged, and the model is revised until the implied unit economics and adoption curves look consistent.
Before sign-off, a second analyst reviews core inputs, conversions, and year-on-year movements, and follow-up outreach is triggered if a key assumption sits outside the interview range. The report is refreshed annually, and interim updates are made when material changes affect expected adoption or pricing. Right before delivery, we do a final pass to ensure the latest public updates and field feedback are reflected.
Mordor Intelligence's Global Remote Tank Monitoring System Market Estimate Compared With Other Published Estimates
Published market values for remote tank monitoring can look far apart even when they refer to similar technology. The gaps usually come from how each study defines what counts as a system sale, which year is treated as the base, and how recurring software and services are included in the total.
The biggest drivers for this market are whether installed base indicators are converted into revenue using realistic replacement cycles, whether connectivity and the service-model mix are updated each year, and how pricing is handled for subscription plans versus one-time hardware. Differences also show up when one estimate treats adjacent remote monitoring categories as in-scope, or when currency timing and inflation restatement are handled differently across regions.
Benchmark comparison
| Source | Market Size | Gaps in Research Methodology |
|---|---|---|
| Mordor Intelligence | USD 2.73 B (2025) | |
| Industry Research Desk A | USD 1.80 B (2025) | Uses a narrower conversion from monitored tanks to revenue and applies conservative service attach rates, which can undercount recurring software and support in markets where subscriptions dominate. |
| Market Outlook Publisher B | USD 2.50 B (2025) | Relies on broad type and application splits with less explicit checks on installed base, replacement timing, and connectivity mix, which can shift the implied spend per monitored tank by region. |
The table shows a tight cluster around 2025 with one lower outlier, and in Mordor Intelligence's model the total is anchored to an installed-base-to-revenue bridge that separates hardware from recurring subscriptions and then revalidates the implied spend per monitored tank across regions. Once pricing, replacement, and service attachment are treated consistently, the result is easier to trace back to clear inputs and repeatable steps.


Key Questions Answered in the Report
How large will the Remote Tank Monitoring System market become by 2031?
It is projected to reach USD 9.16 billion by 2031, expanding at a 23.33% CAGR from 2026 to 2031.
Which end-user industry is growing fastest?
Agriculture and irrigation posts the steepest rise, advancing at a 24.09% CAGR as water-scarcity policies spur real-time reservoir tracking.
What advantage does satellite backhaul offer over cellular?
Low-earth-orbit links extend coverage to remote basins and mining sites, cutting inspection truck rolls by up to 70% while maintaining sub-hourly data updates.
Why are hardware-as-a-service models popular with propane dealers?
Monthly fees of USD 8–12 per tank bundle sensors, connectivity, and analytics, eliminating large upfront payments and reducing customer run-outs.
Which sensor technology dominates custody-transfer terminals?
Magnetostrictive contact probes remain preferred for ±1 mm accuracy that minimizes inventory reconciliation discrepancies.
What standard guides cyber-security for industrial tank networks?
IEC 62443 specifies segmentation, encryption, and role-based controls to protect level sensors and gateways from unauthorized access.
Page last updated on:






