RTD Tea Market Size and Share
Market Overview
| Study Period | 2018 - 2030 |
|---|---|
| Base Year For Estimation | 2024 |
| Forecast Data Period | 2025 - 2030 |
| Market Size (2025) | USD 75.65 Billion |
| Market Size (2030) | USD 107.7 Billion |
| Growth Rate (2025 - 2030) | 7.31% CAGR |
| Market Concentration | Low |
Major Players*Disclaimer: Major Players sorted in no particular order Image © Mordor Intelligence. Reuse requires attribution under CC BY 4.0. |
|

RTD Tea Market Analysis by Mordor Intelligence
The RTD Tea Market size is estimated at 75.65 billion USD in 2025, and is expected to reach 107.7 billion USD by 2030, growing at a CAGR of 7.31% during the forecast period (2025-2030).
The RTD Tea Market is experiencing a significant transformation driven by evolving consumer health consciousness and wellness preferences. This shift is particularly evident in developed markets where obesity concerns are prompting consumers to seek healthier beverage alternatives. In the United States, where approximately 41.9% of adults and 19.7% of children are classified as obese, consumers are increasingly gravitating toward sugar-free and low-calorie ready-to-drink tea options. The industry has responded by incorporating natural sweeteners like stevia, coconut sugar, and organic honey, positioning RTD Tea as a healthier alternative to traditional sugary beverages. This health-conscious trend is further reinforced by the fact that around 50% of global consumers preferred green tea over other varieties in 2022, highlighting the growing awareness of its health benefits.
Product innovation and diversification have become key strategies in the RTD Tea Market, with manufacturers continuously expanding their portfolios to meet diverse consumer preferences. Japan exemplifies this trend, with approximately 700 tea drink variations circulating in its market as of 2022, and over 100 new variations being introduced annually. Companies are increasingly focusing on functional ingredients, incorporating vitamins, minerals, and antioxidants to enhance the nutritional profile of their products. The innovation extends to flavor profiles, with traditional green and black teas being complemented by herbal blends, fruit infusions, and specialty varieties that cater to evolving consumer tastes.
Consumer consumption patterns have shown a marked preference for convenience without compromising on quality and authenticity. In the United States, iced tea dominates consumption patterns, accounting for 75-80% of total tea consumption in 2022. This trend reflects the broader global shift toward ready-to-drink tea formats that offer both convenience and refreshment. In Vietnam, market research indicates that 85% of consumers actively sought food and beverages that enhance well-being in 2022, demonstrating the growing intersection of convenience and health consciousness in consumer decision-making.
The industry has witnessed significant developments in distribution channels and packaging innovations, with sustainability becoming a central focus. Major manufacturers are transitioning toward eco-friendly packaging solutions, with several companies adopting recyclable materials and reducing plastic usage in their packaging designs. For instance, Lipton's shift to SIG aseptic carton packs with SIGNATURE FULL BARRIER packaging material in the Netherlands in 2023 exemplifies this trend. The industry is also seeing a transformation in retail strategies, with online channels gaining prominence and traditional retailers expanding their RTD Tea offerings to meet growing demand.
Global RTD Tea Market Trends and Insights
RTD Tea is majorly driven by health and wellness along with convenience in on-the-go lifestyles across regions
- Around 600,000 tons of green tea are consumed globally each year, which is about one-fifth of all tea consumed. Furthermore, other functional teas will continue to advance the RTD tea sector, supported by trends prioritizing health and wellness.
- The popularity of organic label and herbal teas are on the rise globally owing to increasing popularity. This can be attributed to their health benefits and enhanced benefits of ingredients such as basil, tulsi, etc., shifting consumer preferences toward natural ingredients-based products.
- The average price range of RTD tea market ranges between USD 2.50 to 4.50 in the united states. Among variants, lemon and raspberry as the most popular RTD tea drinks variants. These were priced 12.22% higher than the average price of a RTD tea drinks.
- Growing awareness about the benefits of drinking tea for patients with arthritis, cardiovascular diseases, obesity, overweight, and high blood pressure will drive market growth and expansion in the coming years.
OTHER KEY INDUSTRY TRENDS COVERED IN THE REPORT
- Premiumization in product and flavor profile using quality ingredients is driving the market growth
- Effective marketing strategies, competitive pricing, and a focus on innovation have further fueled Master Kong's dominance in the RTD tea market, allowing it to establish a strong foothold in various countries around the world
Segment Analysis: Soft Drink Type
Iced Tea Segment in RTD Tea Market
Iced tea has emerged as the dominant force in the global ready-to-drink (RTD) tea market, commanding approximately 39% of the market share in 2024. This significant market position can be attributed to several factors, including its refreshing taste profile and widespread consumer acceptance across different age groups. The segment's growth is particularly pronounced in regions with warm climates, where iced tea serves as a popular alternative to carbonated beverages. Manufacturers are actively expanding their iced tea portfolios by introducing innovative flavors and healthier variants, including low-sugar and zero-calorie options. The segment's success is further bolstered by strong distribution networks across both modern and traditional retail channels, making iced tea readily available to consumers worldwide.
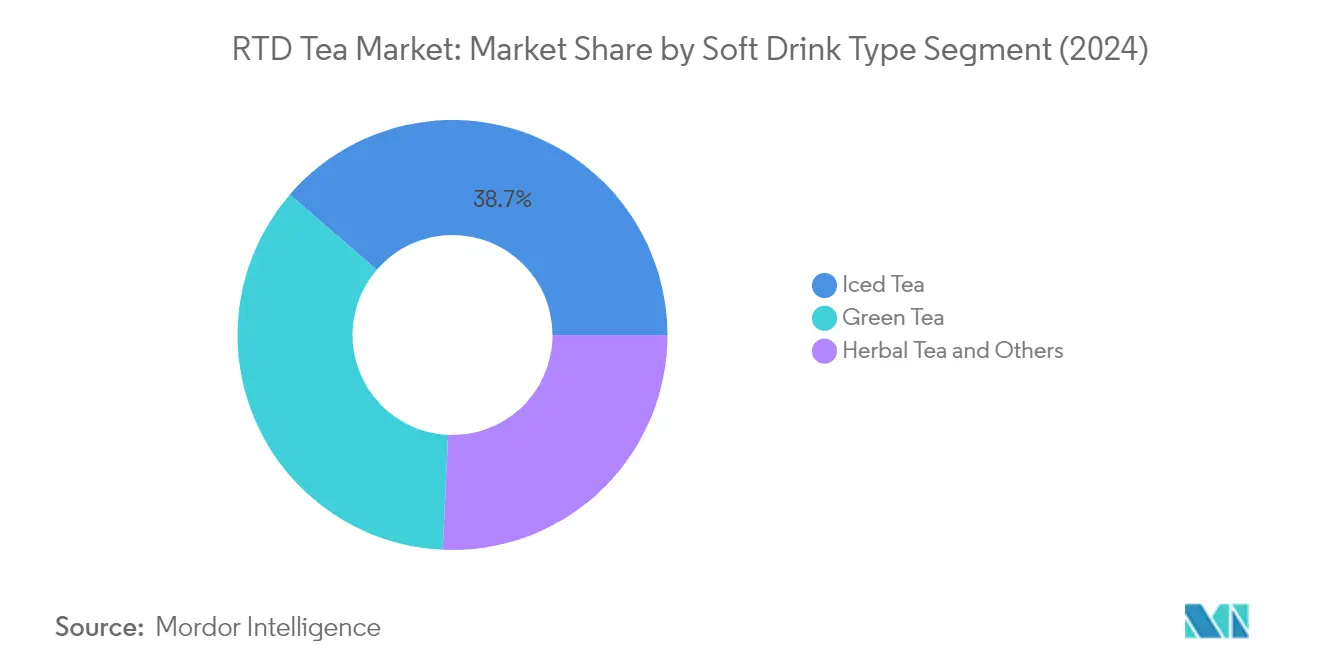
Herbal Tea Segment in RTD Tea Market
The herbal tea segment is experiencing remarkable growth in the RTD tea market, projected to expand at approximately 8% from 2024 to 2029. This impressive growth trajectory is driven by increasing consumer awareness of the health benefits associated with herbal tea consumption. Manufacturers are capitalizing on this trend by introducing innovative herbal blends that incorporate functional ingredients like chamomile, peppermint, and hibiscus, targeting specific health concerns such as stress relief, digestion, and immune support. The segment's growth is further supported by the rising demand for natural and caffeine-free beverage options, particularly among health-conscious consumers and those seeking alternatives to traditional caffeinated beverages. The expansion of premium and organic herbal tea offerings has also contributed to the segment's robust growth prospects.
Remaining Segments in Soft Drink Type
The RTD tea market's remaining segments, including green tea and other specialty teas, continue to play vital roles in shaping the industry landscape. Green tea, with its well-established reputation for health benefits and antioxidant properties, maintains a strong presence in the market, particularly in Asia-Pacific regions where it holds cultural significance. Other RTD tea variants, including black tea and specialty blends, cater to diverse consumer preferences and regional tastes, contributing to the market's overall diversity. These segments are characterized by continuous innovation in flavors, formulations, and packaging, helping manufacturers address specific consumer needs and preferences across different geographical markets.
Segment Analysis: Packaging Type
PET Bottles Segment in RTD Tea Market
PET bottles dominate the RTD tea packaging landscape, commanding approximately 74% of the market share in 2024. This overwhelming preference for PET bottles stems from their lightweight properties, convenience, and versatility in shape and design options. The transparency of PET bottles plays a crucial role in consumer purchasing decisions, allowing customers to visually inspect the product before purchase. Major industry players like Coca-Cola, PepsiCo Inc., and ITO EN Ltd are increasingly investing in sustainable PET bottle solutions, with many transitioning to recycled PET (rPET) materials. The segment's popularity is further enhanced by its cost-effectiveness in manufacturing and transportation, making it an attractive option for both manufacturers and retailers.
Glass Bottles Segment in RTD Tea Market
The glass bottles segment is emerging as the fastest-growing packaging format in the RTD tea market, projected to achieve approximately 10% growth annually from 2024 to 2029. This surge is primarily driven by increasing consumer concerns about health risks associated with plastic and aluminum packaging materials. Glass, being non-reactive and free from chemical leaching, is increasingly perceived as a safer choice for beverage packaging. The segment's growth is further propelled by its superior ability to preserve product freshness, nutritional content, and sensory attributes over extended periods. Premium RTD tea brands are particularly gravitating towards glass packaging to enhance their product positioning and meet the growing consumer demand for sustainable packaging solutions.
Remaining Segments in Packaging Type
Metal cans and aseptic packages represent significant segments in the RTD tea packaging market, each offering unique advantages. Canned tea is valued for its excellent recyclability, superior product protection, and rapid cooling capabilities, making it particularly suitable for ready-to-drink beverages. Aseptic packages, on the other hand, are gaining traction due to their ability to preserve beverage quality without requiring refrigeration, coupled with their lightweight nature and efficient storage capabilities. Both packaging types are seeing increased adoption as manufacturers diversify their packaging options to meet varying consumer preferences and sustainability requirements.
Segment Analysis: Distribution Channel
Off-trade (Supermarkets/Hypermarkets) Segment in RTD Tea Market
Supermarkets and hypermarkets continue to dominate the RTD tea distribution landscape, commanding approximately 49% of the global market share in 2024. This channel's prominence can be attributed to its extensive product range and strategic merchandising capabilities. These retail giants leverage their vast networks and shelf space to showcase diverse RTD tea offerings, from traditional variants to innovative flavors. The success of supermarkets and hypermarkets is further bolstered by their ability to offer competitive pricing through bulk purchasing power and frequent promotional activities. Additionally, these outlets often feature dedicated beverage sections with specialized displays for RTD tea products, enhancing visibility and driving impulse purchases. The channel's widespread accessibility across urban and suburban areas, coupled with the convenience of one-stop shopping, has solidified its position as the preferred destination for RTD tea purchases.
Online Retail Segment in RTD Tea Market
The online retail channel is experiencing remarkable growth in the RTD tea market, projected to achieve approximately 9% growth annually from 2024 to 2029. This surge is primarily driven by the increasing adoption of e-commerce platforms and changing consumer shopping preferences. Online retailers are revolutionizing the RTD tea shopping experience by offering extensive product selections, detailed product information, and convenient home delivery services. The channel's growth is further accelerated by the integration of advanced technologies, such as mobile apps and subscription services, making it easier for consumers to discover and purchase their favorite RTD tea products. Digital platforms also enable brands to gather valuable consumer insights, facilitate personalized marketing campaigns, and provide enhanced customer service through features like automated reordering and loyalty programs. The convenience of 24/7 shopping accessibility, coupled with competitive pricing and exclusive online promotions, continues to attract a growing base of digital-savvy consumers.
Remaining Segments in Distribution Channel
The RTD tea market's distribution landscape is further diversified through several other significant channels, including convenience stores, on-trade establishments, and other off-trade outlets. Convenience stores play a crucial role in serving immediate consumption needs, particularly in urban areas and high-traffic locations. The on-trade segment, encompassing restaurants, cafes, and food service establishments, contributes to the market by offering RTD tea as part of their beverage menus and creating unique consumption experiences. Other off-trade channels, including specialty stores, vending machines, and traditional grocery stores, serve specific consumer segments and geographical locations, adding depth to the market's distribution network. These channels collectively ensure comprehensive market coverage and cater to diverse consumer preferences and purchasing patterns.
RTD Tea Market Geography Segment Analysis
RTD Tea Market in Africa
The African RTD tea market demonstrates significant potential, driven by changing consumer preferences and increasing urbanization across the region. Egypt, Nigeria, and South Africa represent key markets, each with distinct consumption patterns and growth drivers. The region's expanding middle class and growing health consciousness have spurred demand for ready-to-drink tea market products, with manufacturers focusing on introducing innovative flavors and healthier variants to cater to evolving consumer preferences.
RTD Tea Market in South Africa
South Africa emerges as the dominant force in Africa's RTD tea industry, commanding approximately 41% of the regional RTD tea market share in 2024. The country's robust retail infrastructure and sophisticated distribution networks have facilitated widespread product availability. South African consumers exhibit a strong preference for RTD tea market products that offer both convenience and health benefits. The market is characterized by intense competition among both local and international players, with companies continuously innovating their product offerings to maintain market position. The presence of major retail chains and modern trade outlets has significantly contributed to market growth, while increasing health consciousness among consumers drives demand for sugar-free and natural variants.
RTD Tea Market in Nigeria
Nigeria stands out as the fastest-growing RTD tea market in Africa, projected to achieve approximately 15% growth annually from 2024 to 2029. The country's burgeoning young population and increasing urbanization drive market expansion. Nigerian consumers increasingly seek convenient, on-the-go beverage options, particularly in urban areas where busy lifestyles necessitate quick refreshment solutions. The market witnesses growing demand for innovative flavors and functional benefits, with manufacturers introducing products tailored to local preferences. Rising disposable incomes and growing health awareness among Nigerian consumers further catalyze market growth, while expanding retail infrastructure facilitates better product accessibility.
RTD Tea Market in Asia-Pacific
The Asia-Pacific region represents a dynamic and diverse RTD tea market, characterized by strong cultural tea-drinking traditions and innovative product developments. Countries including Australia, China, India, Indonesia, Japan, Malaysia, South Korea, Thailand, and Vietnam each contribute uniquely to the market landscape. The region's vast population base, coupled with increasing urbanization and rising disposable incomes, drives market growth. Manufacturers in the region focus on product innovation, introducing new flavors and functional benefits to meet evolving consumer preferences.
RTD Tea Market in China
China dominates the Asia-Pacific RTD tea industry, holding approximately 41% of the regional RTD tea market share in 2024. The country's deep-rooted tea culture and extensive distribution networks contribute to its market leadership. Chinese consumers demonstrate sophisticated preferences, embracing both traditional and innovative RTD tea variants. The market benefits from strong retail infrastructure and e-commerce penetration, while manufacturers continuously introduce new products aligned with health and wellness trends. Urban consumers particularly drive demand, seeking convenient yet authentic tea experiences.
RTD Tea Market in India
India emerges as the fastest-growing market in the Asia-Pacific region, with an anticipated growth rate of approximately 11% annually from 2024 to 2029. The country's massive young population and evolving consumer preferences drive market expansion. Indian consumers increasingly embrace ready-to-drink tea market as a convenient alternative to traditional tea preparation methods. The market witnesses significant product innovations, with manufacturers introducing localized flavors and functional benefits. Growing health consciousness and rising disposable incomes further fuel market growth, while expanding retail infrastructure enhances product accessibility.
RTD Tea Market in Europe
Europe's RTD tea market showcases sophisticated consumer preferences and strong demand for premium and innovative products. The region encompasses diverse markets including Belgium, France, Germany, Italy, Netherlands, Russia, Spain, Turkey, and the United Kingdom. European consumers increasingly seek healthier beverage alternatives, driving demand for natural and organic RTD tea variants. The market benefits from well-established retail infrastructure and strong distribution networks.
RTD Tea Market in Germany
Germany leads the European RTD tea market, with its strong retail infrastructure and sophisticated consumer base driving market growth. The country's emphasis on health and wellness, coupled with increasing demand for convenient beverage options, supports market expansion. German consumers show particular interest in organic and natural RTD tea variants, while manufacturers focus on sustainable packaging solutions and innovative product formulations. The market benefits from extensive distribution networks and a strong presence of both domestic and international brands.
RTD Tea Market in France
France demonstrates remarkable growth potential in the European RTD tea market, with its health-conscious consumer base driving demand for innovative and premium products. French consumers increasingly seek RTD tea varieties that offer functional benefits and natural ingredients. The market witnesses continuous product innovations, with manufacturers introducing new flavors and formulations to meet evolving consumer preferences. Strong retail infrastructure and growing health awareness contribute to market expansion.
RTD Tea Market in Middle East
The Middle Eastern RTD tea market, encompassing Qatar, Saudi Arabia, and the UAE, shows strong growth potential driven by changing consumer preferences and increasing health consciousness. Saudi Arabia emerges as the largest market in the region, while the UAE demonstrates the fastest growth rate. The region's hot climate and growing young population contribute to increased RTD tea consumption, with consumers seeking convenient and refreshing beverage options.
RTD Tea Market in North America
The North American RTD tea market, comprising Canada, Mexico, and the United States, demonstrates robust growth driven by increasing health consciousness and demand for convenient beverage options. The United States leads the regional market, while Mexico shows the fastest growth potential. The region's strong retail infrastructure and consumer preference for healthier alternatives to carbonated drinks contribute to market expansion.
RTD Tea Market in South America
The South American RTD tea market, featuring Argentina and Brazil, shows significant growth potential driven by changing consumer preferences and increasing health awareness. Brazil emerges as both the largest and fastest-growing market in the region, supported by its large population base and evolving consumer preferences. The region witnesses increasing product innovations and expanding distribution networks, contributing to market growth.
Competitive Landscape
Top Companies in RTD Tea Market
The RTD tea market features prominent players like PepsiCo, Coca-Cola Company, Tingyi Holding, and Uni-President Enterprises leading the competitive landscape. Product innovation remains a key strategic focus, with companies continuously introducing new flavors, functional ingredients, and healthier variants to meet evolving consumer preferences. Operational agility is demonstrated through investments in state-of-the-art manufacturing facilities and the adoption of sustainable packaging solutions, particularly recyclable PET bottles and eco-friendly materials. Companies are actively pursuing strategic partnerships with local distributors, retailers, and technology providers to enhance their market presence and distribution capabilities. Geographic expansion strategies focus on penetrating emerging markets while strengthening positions in established regions through acquisitions and joint ventures. The industry witnesses ongoing efforts to optimize supply chain efficiency and embrace digital transformation to improve operational effectiveness and customer engagement.
Market Dominated by Global Beverage Conglomerates
The RTD tea market exhibits a moderately consolidated structure, with global beverage conglomerates wielding significant influence through their established brands and extensive distribution networks. These major players leverage their diverse product portfolios, substantial research and development capabilities, and strong financial resources to maintain market leadership. Regional players maintain competitive positions in specific markets through their deep understanding of local tastes and preferences, often competing effectively with global brands through targeted marketing and specialized product offerings. The market also sees the presence of specialized bottled tea companies that focus on premium and niche segments, particularly in regions with strong tea-drinking cultures.
The industry landscape is characterized by strategic mergers and acquisitions aimed at expanding geographic reach and strengthening product portfolios. Large companies frequently acquire local brands to gain quick market access and establish a stronger regional presence. Joint ventures between international and local players are common, combining global expertise with local market knowledge. The market also witnesses vertical integration strategies, with companies investing in tea plantations and processing facilities to ensure supply chain control and product quality consistency. Partnerships with technology providers and sustainability initiatives are becoming increasingly important for maintaining competitive advantage.
Innovation and Sustainability Drive Future Success
Success in the ready-to-drink tea industry increasingly depends on companies' ability to innovate while maintaining sustainable practices throughout their operations. Incumbents must focus on developing unique product formulations that align with health and wellness trends while investing in sustainable packaging solutions and production processes. Building strong digital capabilities, including e-commerce presence and direct-to-consumer channels, is becoming crucial for maintaining market share. Companies need to establish robust supply chain partnerships and implement advanced technology solutions for production and distribution efficiency. Creating authentic brand stories and maintaining transparency in sourcing and production practices helps build consumer trust and loyalty.
For contenders looking to gain market share, focusing on niche segments and underserved markets presents significant opportunities. Success requires developing innovative flavors and functional benefits that differentiate products from established brands. Building strong relationships with retailers and investing in targeted marketing campaigns helps create brand awareness and market penetration. Regulatory compliance, particularly regarding health claims and packaging requirements, remains crucial for both incumbents and contenders. Companies must also address the growing consumer demand for environmentally responsible practices and clean label products. Developing efficient distribution networks and leveraging digital platforms for market reach and consumer engagement are essential strategies for gaining competitive advantage.
RTD Tea Industry Leaders
-
PepsiCo, Inc.
-
Suntory Holdings Limited
-
The Coca-Cola Company
-
Tingyi (Cayman Islands) Holding Corporation
-
Uni-President Enterprises Corp.
- *Disclaimer: Major Players sorted in no particular order

Recent Industry Developments
- November 2023: The Coca-Cola Company's brand ChaiChun brought exquisite teas to Delhi with its new store, The ChaiChun Store, expanding its business.
- January 2023: Lipton Tea has announced a new partnership with Full Cart, a program within nonprofit U.S. Hunger, and a virtual food pantry to make heart-friendly nutrition and grocery assistance more accessible.
- December 2022: Pure Leaf rolled out a limited-edition Merry Mint Iced Tea, coinciding with the release of the Christmas movie 'Christmas Class Reunion'. This mint-flavored iced tea was simultaneously launched through a social media giveaway, enhancing the movie-watching experience for consumers.
Global RTD Tea Market Report Scope
Green Tea, Herbal Tea, Iced Tea are covered as segments by Soft Drink Type. Aseptic packages, Glass Bottles, Metal Can, PET Bottles are covered as segments by Packaging Type. Off-trade, On-trade are covered as segments by Distribution Channel. Africa, Asia-Pacific, Europe, Middle East, North America, South America are covered as segments by Region.| Green Tea |
| Herbal Tea |
| Iced Tea |
| Other RTD Tea |
| Aseptic packages |
| Glass Bottles |
| Metal Can |
| PET Bottles |
| Off-trade | Convenience Stores |
| Online Retail | |
| Supermarket/Hypermarket | |
| Others | |
| On-trade |
| Africa | Egypt |
| Nigeria | |
| South Africa | |
| Rest of Africa | |
| Asia-Pacific | Australia |
| China | |
| India | |
| Indonesia | |
| Japan | |
| Malaysia | |
| South Korea | |
| Thailand | |
| Vietnam | |
| Rest of Asia-Pacific | |
| Europe | Belgium |
| France | |
| Germany | |
| Italy | |
| Netherlands | |
| Russia | |
| Spain | |
| Turkey | |
| United Kingdom | |
| Rest of Europe | |
| Middle East | Qatar |
| Saudi Arabia | |
| United Arab Emirates | |
| Rest of Middle East | |
| North America | Canada |
| Mexico | |
| United States | |
| Rest of North America | |
| South America | Argentina |
| Brazil | |
| Rest of South America |
| Soft Drink Type | Green Tea | |
| Herbal Tea | ||
| Iced Tea | ||
| Other RTD Tea | ||
| Packaging Type | Aseptic packages | |
| Glass Bottles | ||
| Metal Can | ||
| PET Bottles | ||
| Distribution Channel | Off-trade | Convenience Stores |
| Online Retail | ||
| Supermarket/Hypermarket | ||
| Others | ||
| On-trade | ||
| Region | Africa | Egypt |
| Nigeria | ||
| South Africa | ||
| Rest of Africa | ||
| Asia-Pacific | Australia | |
| China | ||
| India | ||
| Indonesia | ||
| Japan | ||
| Malaysia | ||
| South Korea | ||
| Thailand | ||
| Vietnam | ||
| Rest of Asia-Pacific | ||
| Europe | Belgium | |
| France | ||
| Germany | ||
| Italy | ||
| Netherlands | ||
| Russia | ||
| Spain | ||
| Turkey | ||
| United Kingdom | ||
| Rest of Europe | ||
| Middle East | Qatar | |
| Saudi Arabia | ||
| United Arab Emirates | ||
| Rest of Middle East | ||
| North America | Canada | |
| Mexico | ||
| United States | ||
| Rest of North America | ||
| South America | Argentina | |
| Brazil | ||
| Rest of South America | ||
Market Definition
- Carbonated Soft Drinks (CSDs) - Carbonated soft drinks (CSDs) refer to non-alcoholic beverages that are carbonated and typically flavored, containing dissolved carbon dioxide to create effervescence. These beverages commonly include cola, lemon-lime, orange, and various fruit-flavored sodas. Marketed in cans, bottles, or fountain dispense.
- Juices - We have considered packaged juices which encompass non-alcoholic beverages derived from fruits, vegetables, or a combination thereof, processed and sealed in various packaging formats such as bottles, cartons, or pouches. Excluding fresh juices, this market segment involves commercially prepared and preserved juices, often with added preservatives and flavors.
- Ready-to-Drink (RTD) Tea and RTD Coffee - Ready-to-Drink (RTD) tea and RTD coffee are pre-packaged, non-alcoholic beverages that are brewed and prepared for consumption without further dilution. RTD tea typically includes various tea varieties, infused with flavors and sweeteners, and comes in bottles, cans, or cartons. Similarly, RTD coffee involves pre-brewed coffee formulations, often mixed with milk, sugar, or flavorings, and is conveniently packaged for on-the-go consumption.
- Energy Drinks - Energy drinks are non-alcoholic beverages formulated to provide a quick boost of energy and alertness. Whereas, sports drinks are beverages designed to hydrate and replenish electrolytes, particularly after physical exertion, exercise, or intense activity
| Keyword | Definition |
|---|---|
| Carbonated Soft Drinks | Carbonated soft drinks (CSDs) are a combination of carbonated water and flavouring, sweetened by sugar or a non-sugar sweeteners. |
| Standard Cola | Standard Cola is defined as the original flavor of cola soda. |
| Diet Cola | A cola-based soft drink containing no or low amounts of sugar |
| Fruit Flavored Carbonates | A carbonated beverage prepared from fruit juice/fruit flavor with carbonated water and containing sugar, dextrose, invert sugar or liquid glucose either singly or in combination. It may contain peel oil and fruit essences. |
| Juice | Juice is a drink made from the extraction or pressing of the natural liquid contained in fruit and vegetables. |
| 100% Juice | Fruit/vegetable juice made from fruit in the form of its juice with no water added to make up the volume. It is not permitted to add sugars, sweeteners, preservatives, flavourings or colourings to fruit juice. |
| Juice Drinks (up to 24% Juice) | Fruit/vegetable juice drinks with up to 24% fruits/vegetable extract. |
| Nectars (25-99% Juice) | Juices that can have between 25 and 99% of fruit, with the minimum legal limits defined depending on the type of fruit |
| Juice concentrates | Juice Concentrates are those form of juices when most of this liquid is removed resulting in a thick, syrupy product known as juice concentrate. |
| RTD Coffee | Packaged coffee beverages that are sold in a prepared form and are ready for consumption at the time of purchase. |
| Iced Coffee | An iced coffee is a cold version of coffee, usually a combination of hot espresso and milk with ice added to it. |
| Cold Brew Coffee | Cold brew also called cold water extraction or cold pressing is made by steeping ground coffee in room-temperature water for several hours. |
| RTD Tea | Ready-to-drink (RTD) tea is a packaged tea product ready for immediate consumption without brewing or preparation |
| Iced Tea | Ice tea or iced tea is a drink made from tea without milk but with sugar and sometimes fruit flavourings, drunk cold. |
| Green Tea | Green tea is a tea beverage which promotes mental alertness, relieving digestive symptoms and promoting weight loss. |
| Herbal Tea | Herbal tea beverages are made from the infusion or decoction of herbs, spices, or other plant material in hot water. |
| Energy Drink | A type of drink containing stimulant compounds, usually caffeine, which is marketed as providing mental and physical stimulation. They may or may not be carbonated and may also contain sugar, other sweeteners, or herbal extracts, among numerous possible ingredients. |
| Sugar-free or Low-calories Energy Drinks | Sugar-free or Low-calories Energy Drinks are sugar-free, artificially sweetened energy drinks with few or no calories. |
| Traditional Energy Drink | Traditional Energy Drinks are functional soft drinks containing ingredients designed to boost the consumer's energy. |
| Natural/Oraganic Energy Drinks | Natural/Organic energy drinks are energy drinks free of artificial sweeteners and synthetic colorings. Instead, they contain naturally derived ingredients such as green tea, yerba mate, and botanical extracts. |
| Energy Shots | A small but highly concentrated energy drink that contains large amounts of caffeine and/or other stimulants. The quantity is comparatively smaller compared to energy drinks. |
| Sports Drink | Sports drinks are beverages designed specifically for the rapid supply of fluid, carbohydrates, and electrolytes before, during or after exercise. |
| Isotonic | Isotonic drinks contain similar concentrations of salt and sugar as in the human body, and are designed to quickly replace fluids lost during exercise but with an increase of carbohydrate. |
| Hypertonic | Hypertonic drinks have a higher concentration of salt and sugar than the human body. They are best drunk after exercise as it is important to replace glycogen levels quickly after exercise. |
| Hypotonic | Hypotonic drinks are designed to quickly replace fluids lost during exercise. They have very low carbohydrate content and a lower concentration of salt and sugar than the human body. |
| Electrolyte-Enhanced Water | Electrolyte water is water infused with electrically-charged minerals, such as sodium, potassium, calcium, and magnesium. |
| Protein-based Sport Drinks | Protein-based sports drinks are those sports drinks which has added protein in it that will improve performance and reduce muscle protein breakdown. |
| On-Trade | The on-trade refers to places that sell beverages for immediate consumption on the premises like bars, restaurants, and pubs |
| Off-Trade | Off-trade usually means places like liquor stores, supermarkets and other places where you don't consume the beverage right away. |
| Convenience Store | A retail business that provides the public with a convenient location to quickly purchase a wide variety of consumable products and services, generally food and gasoline. |
| Specialty store | A specialty store is a shop/store that carries a deep assortment of brands, styles, or models within a relatively narrow category of goods |
| Online Retail | Online retail is a type of eCommerce whereby a business sells goods or services directly to consumers from a website. |
| Aseptic Packaging | Aseptic packaging refers to the filling of a cold, commercially sterile product under sterile conditions into a presterilized container and closure under sterile conditions to form a seal that effectively excludes microorganisms. These includes tetra packs, cartons, pouches etc. |
| PET Bottle | PET bottle means a bottle made of polyethylene terephthalate. |
| Metal Cans | Metal containers made of aluminum or tin- plated or zinc-plated steel, which are commonly used for packaging food, beverages or other products. |
| Disposable Cups | Disposable Cup means a cup or other container designed for single use to serve beverages, such as water, cold drinks, hot drinks and alcoholic beverages. |
| Gen Z | A way of referring to the group of people who were born in the late 1990s and early 2000s. |
| Millenial | Anyone born between 1981 and 1996 (ages 23 to 38 in 2019) is considered a Millennial |
| Taurine | Taurine is an amino acid that supports immune health and nervous system function. |
| Bars & Pubs | It is a drinking establishment licensed to serve alcoholic drinks for consumption on the premises. |
| Café | It is a foodservice establishment serving refreshments (mainly coffee) and light meals. |
| On the go | It means doing / dealing with while busily engaged with something and not diverting plans in order to accommodate. |
| Internet Penetration | The Internet Penetration Rate corresponds to the percentage of the total population of a given country or region that uses the Internet. |
| Vending Machine | A machine that dispenses small articles such as food, drinks, or cigarettes when a coin or token is inserted |
| Discount store | A discount store or discounter offers a retail format in which products are sold at prices that are in principle lower than an actual or supposed "full retail price". Discounters rely on bulk purchasing and efficient distribution to keep down costs. |
| Clean Label | Clean label on the beverage market are drinks that are made from few ingredients of natural origin and are not or only slightly processed. |
| Caffeine | An alkaloid compound which is a stimulant of the central nervous system. It is mainly used recreationally, as a mild cognitive enhancer to increase alertness and attentional performance. |
| Extreme sport | Action sports, adventure sports or extreme sports are activities perceived as involving a high degree of risk. |
| High-intensity interval training | It incorporates several rounds that alternate between several minutes of high intensity movements to significantly increase the heart rate to at least 80% of one's maximum heart rate, followed by short periods of lower intensity movements. |
| Shelf life | The length of time for which an item remains usable, fit for consumption, or saleable. |
| Cream Soda | Cream soda is a sweet soft drink. Generally flavored with vanilla and based on the taste of an ice cream float |
| Root Beer | Root beer is a sweet North American soft drink traditionally made using the root bark of the sassafras tree Sassafras albidum or the vine of Smilax ornata as the primary flavor. Root beer is typically, but not exclusively, non-alcoholic, caffeine-free, sweet, and carbonated. |
| Vanilla Soda | A carbonated soft drink flavoured with vanilla. |
| Dairy-Free | A product that does not contain any milk or milk products from cows, sheep or goats. |
| Caffeine-Free Energy Drinks | Caffeine-free energy drinks rely on other ingredients to boost the energy. Popular choices include amino acids, B vitamins, and electrolytes. |
Research Methodology
Mordor Intelligence follows a four-step methodology in all our reports.
- Step-1: IDENTIFY KEY VARIABLES: In order to build a robust forecasting methodology, the variables and factors identified in Step 1 are tested against available historical market numbers. Through an iterative process, the variables required for market forecast are set, and the model is built on the basis of these variables.
- Step-2: Build a Market Model: Market-size estimations for the forecast years are in nominal terms. Inflation is not a part of the pricing, and the average selling price (ASP) is kept constant throughout the forecast period for each country.
- Step-3: Validate and Finalize: In this important step, all market numbers, variables, and analyst calls are validated through an extensive network of primary research experts from the market studied. The respondents are selected across levels and functions to generate a holistic picture of the market studied.
- Step-4: Research Outputs: Syndicated reports, custom consulting assignments, databases & subscription platforms


